Effects of anhedonia from multiple linear regressions controlling for...
- plos.figshare.com
xlsUpdated Jun 2, 2023 Share
Share Facebook
 Twitter
 EmailClick to copy linkLink copiedCiteYi Zhou; Narun Pat; Michael C. Neale (2023). Effects of anhedonia from multiple linear regressions controlling for sociodemographic factors and clinical comorbidities across the ABCD study samples. [Dataset]. http://doi.org/10.1371/journal.pone.0277158.t006xlsAvailable download formatsUnique identifierhttps://doi.org/10.1371/journal.pone.0277158.t006Dataset updatedJun 2, 2023AuthorsYi Zhou; Narun Pat; Michael C. NealeLicense
Attribution 4.0 (CC BY 4.0)https://creativecommons.org/licenses/by/4.0/
License information was derived automaticallyDescriptionEffects of anhedonia from multiple linear regressions controlling for sociodemographic factors and clinical comorbidities across the ABCD study samples.
Reproduction and replication t-test results comparing controls and those...
- plos.figshare.com
xlsUpdated Jun 2, 2023ShareFacebookTwitterEmailClick to copy linkLink copiedCiteYi Zhou; Narun Pat; Michael C. Neale (2023). Reproduction and replication t-test results comparing controls and those with anhedonia across ABCD study samples. [Dataset]. http://doi.org/10.1371/journal.pone.0277158.t002xlsAvailable download formatsUnique identifierhttps://doi.org/10.1371/journal.pone.0277158.t002Dataset updatedJun 2, 2023AuthorsYi Zhou; Narun Pat; Michael C. NealeLicenseAttribution 4.0 (CC BY 4.0)https://creativecommons.org/licenses/by/4.0/
License information was derived automaticallyDescriptionReproduction and replication t-test results comparing controls and those with anhedonia across ABCD study samples.
- f
Multiple linear regression results in ABCD 4.0 (excluding 1.0) sample,...
- plos.figshare.com
xlsxUpdated Jun 2, 2023+ more versionsShareFacebookTwitterEmailClick to copy linkLink copiedCiteYi Zhou; Narun Pat; Michael C. Neale (2023). Multiple linear regression results in ABCD 4.0 (excluding 1.0) sample, controlling for sociodemographic covariates. [Dataset]. http://doi.org/10.1371/journal.pone.0277158.s023xlsxAvailable download formatsUnique identifierhttps://doi.org/10.1371/journal.pone.0277158.s023Dataset updatedJun 2, 2023Dataset provided byPLOS ONEAuthorsYi Zhou; Narun Pat; Michael C. NealeLicenseAttribution 4.0 (CC BY 4.0)https://creativecommons.org/licenses/by/4.0/
License information was derived automaticallyDescriptionThe partial regression coefficients (Estimate), standard errors (Std.Err), t-values, p-values, significance, model R2 (R^2), Bonferroni-Hochberg Adjusted p-values (BH adjustment), Bonferroni adjustd p-values, Durbin-Watson statistic (DW_statistic), Breusch-Pagan Chi^2 (BP Chi^2), and Breusch-Pagan (BP) p-values are presented. The ICC is the proportion of variance in rsfMRI connectivity explained by the family structure random effect. (XLSX)
- f
Effects of bipolar II disorder, irritability, and depressed mood from...
- plos.figshare.com
xlsxUpdated Jun 2, 2023ShareFacebookTwitterEmailClick to copy linkLink copiedCiteYi Zhou; Narun Pat; Michael C. Neale (2023). Effects of bipolar II disorder, irritability, and depressed mood from multiple linear regression analyses across the ABCD study samples for 27 rsfMRI measures associated with anhedonia. [Dataset]. http://doi.org/10.1371/journal.pone.0277158.s034xlsxAvailable download formatsUnique identifierhttps://doi.org/10.1371/journal.pone.0277158.s034Dataset updatedJun 2, 2023Dataset provided byPLOS ONEAuthorsYi Zhou; Narun Pat; Michael C. NealeLicenseAttribution 4.0 (CC BY 4.0)https://creativecommons.org/licenses/by/4.0/
License information was derived automaticallyDescriptionEffect size (effect_CIs) with 95% confidence intervals represents the percentage of the total variance (proportion of variance * 100%) in a rsfMRI connectivity measure accounted for by each predictor (psychiatric symptom or diagnosis). Total model R^2 (total_R2), partial regression coefficients (Estimate), standard errors (Std.Err), t-values, p-values, and Benjamini-Hochberg corrected p-values (BH_adjustment) values are reported. (XLSX)
Single-echo/multi-echo comparison pilot
- openneuro.org
Updated Jun 20, 2024+ more versionsShareFacebookTwitterEmailClick to copy linkLink copiedCiteTaylor Salo; Dylan Tisdall; Lia Brodrick; Adam Czernuszenko; David Roalf; Sage Rush-Goebel; Nick Wellman; Ted Satterthwaite (2024). Single-echo/multi-echo comparison pilot [Dataset]. http://doi.org/10.18112/openneuro.ds005250.v1.0.0Unique identifierhttps://doi.org/10.18112/openneuro.ds005250.v1.0.0Dataset updatedJun 20, 2024AuthorsTaylor Salo; Dylan Tisdall; Lia Brodrick; Adam Czernuszenko; David Roalf; Sage Rush-Goebel; Nick Wellman; Ted SatterthwaiteLicenseCC0 1.0 Universal Public Domain Dedicationhttps://creativecommons.org/publicdomain/zero/1.0/
License information was derived automaticallyDescriptionSingle-echo/multi-echo comparison pilot
This dataset contains ABCD-protocol single-echo BOLD scans, along with complex-valued, multi-echo BOLD scans for comparison. The multi-echo BOLD protocol uses the CMRR MB-EPI sequence, and comes from collaborators at UMinn. These scans include five echoes with both magnitude and phase reconstruction.
The primary goal of this dataset was to evaluate the usability of the multi-echo fMRI protocol in a larger study, via direct comparison to the ABCD fMRI protocol, as well as via test-retest reliability analyses. However, these data may be useful to others (e.g., for testing complex-valued models, applying phase regression to multi-echo data, testing multi-echo denoising methods).
Dataset contents
This dataset includes 8 participants, each with between 1 and 3 sessions. MR data were acquired using a 3-Tesla Siemens Prisma MRI scanner.
The imaging data were converted to NIfTI-1 format with dcm2niix v1.0.20220505, using heudiconv 0.13.1.
In each session, the following scans were acquired:
Structural data
A T1-weighted anatomical scan (256 slices; repetition time, TR=1900 ms; echo time, TE=2.93 ms; flip angle, FA=9 degrees; field of view, FOV=176x262.144 mm, matrix size=176x256; voxel size=1x0.977x0.977 mm).
Functional data
One run of Penn fractal n-back task five-echo fMRI data (72 slices; repetition time, TR=1761 ms; echo times, TE=14.2, 38.93, 63.66, 88.39, 113.12 ms; flip angle, FA=68 degrees; field of view, FOV=220x220 mm, matrix size=110x110; voxel size=2x2x2 mm; multiband acceleration factor=6). Both magnitude and phase data were reconstructed for this run. The run was 7:03 minutes in length, including the three no-radiofrequency-excitation volumes at the end. After the
_noRFvolumes were split into separate files, each run was 6:58 minutes long.Two runs of open-eye resting-state five-echo fMRI data (72 slices; repetition time, TR=1761 ms; echo times, TE=14.2, 38.93, 63.66, 88.39, 113.12 ms; flip angle, FA=68 degrees; field of view, FOV=220x220 mm, matrix size=110x110; voxel size=2x2x2 mm; multiband acceleration factor=6). Both magnitude and phase data were reconstructed for these runs. Each run was 5:59 minutes in length, including the three no-radiofrequency-excitation volumes at the end. After the
_noRFvolumes were split into separate files, each run was 5:54 minutes long.Two runs of open-eye resting-state single-echo fMRI data acquired according to the ABCD protocol (60 slices; repetition time, TR=800 ms; echo time, TE=30 ms; flip angle, FA=52 degrees; field of view, FOV=216x216 mm, matrix size=90x90; voxel size=2.4x2.4x2.4 mm; multiband acceleration factor=6). Only magnitude data were reconstructed for these runs. Each run was 6:00 minutes in length.
Field maps
Two sets of field maps were acquired for the multi-echo fMRI scans.
One set was a multiband, multi-echo gradient echo PEpolar-type field map (
acq-MEGE), acquired with the same parameters as the multi-echo fMRI scans (except without magnitude+phase reconstruction). For each acquisition, we have created a copy of the single-band reference image from the first echo as the primary field map.The other set was a multi-echo spin-echo PEpolar-type field map (
acq-MESE). We have also created a copy of the first echo for each direction as a standard field map.The single-echo copies of both the
acq-MEGEand theacq-MESEfield maps haveB0FieldIdentifierfields andIntendedForfields, though we used theacq-MESEfield maps for theB0FieldSourcefields of the multi-echo fMRI scans. Therefore, tools which leverage theB0*fields, such as fMRIPrep, should use the single-echoacq-MESEscans for distortion correction.Single-echo PEpolar-type EPI field maps (
acq-SESE) with parameters matching the single-echo fMRI data were also acquired for distortion correction.Dataset idiosyncrasies
Multi-echo field maps
There are two sets of PEpolar-style field maps for the multi-echo BOLD scans: one gradient echo and one spin echo. Each field map set contains five echoes, like the BOLD scans. However, because distortion shouldn't vary across echoes (at least not at 3T), there is no need for multi-echo PEpolar-style field maps, and tools like fMRIPrep can't use them. As such, we have made a copy of the spin echo field map's first echo without the echo entity for BIDS compliance, as well as a copy of the gradient echo field map's first echo's single-band reference image.
No radio frequency excitation scans
The multi-echo BOLD scans included three no-radio-frequency noise scans acquired at the end of the scan, which have been split off into files with the
_noRFsuffix. These noise scans can be used to suppress thermal noise with NORDIC denoising. BOLD runs that were stopped early or failed to fully reconstruct may be missing these noise scans.The
_noRFsuffix is not (as of 2024/03/22) supported within BIDS, but there is an open pull request adding it (https://github.com/bids-standard/bids-specification/pull/1451).NORDIC-denoised BOLD runs
We have run NORDIC on the multi-echo scans, using the
noRFfiles when available. The NORDIC-denoised data have therec-nordicentity in the filenames.We have made copies of the associated single-band reference images as well.
sub-08 ses-noHC
Subject 08's ses-noHC was accidentally acquired without the head coil plugged in. We included the session in the dataset in case anyone might find it useful, but do not recommend using the data for analyses.
sub-04 ses-2 and ses-3
Subject 04 had to stop session 2 early, so a separate session was acquired to finish acquiring the remaining scans.
Excluded data
Physio (PPG + chest belt) data were acquired for a subset of the scans, but, due to equipment issues, the data were unusable and have been excluded from the dataset.
There was also an MEGRE field map sequence in the protocol, provided by Dr. Andrew Van, but there were reconstruction errors at the scanner, so these field maps were not usable. We've chosen to exclude the remaining files from the dataset.
In some cases, we noticed reconstruction errors on final volumes in the multi-echo BOLD runs. When that happened, we dropped any trailing volumes, so that all files from a given run are the same length. For some runs, this involved entirely removing the noRF scans.
Penn Fractal N-Back events files
The events files for the fractal n-back task are not included in version 1.0.0 of the dataset. We will add them in a future patch release.
Notes about acquisition
The multi-echo BOLD scans were acquired on a 3T Siemens Prisma scanner running VE11C. The same protocol has exhibited consistent reconstruction errors on XA30.
- f
Effect size (in Pearson’s r) quantiles for analytic variations.
- plos.figshare.com
xlsUpdated Jun 9, 2023ShareFacebookTwitterEmailClick to copy linkLink copiedCiteMax M. Owens; Alexandra Potter; Courtland S. Hyatt; Matthew Albaugh; Wesley K. Thompson; Terry Jernigan; Dekang Yuan; Sage Hahn; Nicholas Allgaier; Hugh Garavan (2023). Effect size (in Pearson’s r) quantiles for analytic variations. [Dataset]. http://doi.org/10.1371/journal.pone.0257535.t001xlsAvailable download formatsUnique identifierhttps://doi.org/10.1371/journal.pone.0257535.t001Dataset updatedJun 9, 2023Dataset provided byPLOS ONEAuthorsMax M. Owens; Alexandra Potter; Courtland S. Hyatt; Matthew Albaugh; Wesley K. Thompson; Terry Jernigan; Dekang Yuan; Sage Hahn; Nicholas Allgaier; Hugh GaravanLicenseAttribution 4.0 (CC BY 4.0)https://creativecommons.org/licenses/by/4.0/
License information was derived automaticallyDescriptionEffect size (in Pearson’s r) quantiles for analytic variations.
- f
T-test results comparing those with anhedonia from controls using the ABCD...
- plos.figshare.com
xlsxUpdated Jun 2, 2023+ more versionsShareFacebookTwitterEmailClick to copy linkLink copiedCiteYi Zhou; Narun Pat; Michael C. Neale (2023). T-test results comparing those with anhedonia from controls using the ABCD 1.0 sample. [Dataset]. http://doi.org/10.1371/journal.pone.0277158.s018xlsxAvailable download formatsUnique identifierhttps://doi.org/10.1371/journal.pone.0277158.s018Dataset updatedJun 2, 2023Dataset provided byPLOS ONEAuthorsYi Zhou; Narun Pat; Michael C. NealeLicenseAttribution 4.0 (CC BY 4.0)https://creativecommons.org/licenses/by/4.0/
License information was derived automaticallyDescriptionEffect sizes (Cohen’s d) with 95% Cis, t-statistics, p-values, ln(Bayes Factor) (lnBF), group means with standard deviations (SD), Shapiro-Wilk statistics (W-statistic), and F-statistics are reported. (XLSX)
Comparison of sociodemographic measures between controls and those with...
- plos.figshare.com
xlsUpdated Jun 2, 2023+ more versionsShareFacebookTwitterEmailClick to copy linkLink copiedCiteYi Zhou; Narun Pat; Michael C. Neale (2023). Comparison of sociodemographic measures between controls and those with anhedonia in the ABCD 4.0 release, excluding ABCD 1.0 release, sub-sample. [Dataset]. http://doi.org/10.1371/journal.pone.0277158.t003xlsAvailable download formatsUnique identifierhttps://doi.org/10.1371/journal.pone.0277158.t003Dataset updatedJun 2, 2023AuthorsYi Zhou; Narun Pat; Michael C. NealeLicenseAttribution 4.0 (CC BY 4.0)https://creativecommons.org/licenses/by/4.0/
License information was derived automaticallyDescriptionComparison of sociodemographic measures between controls and those with anhedonia in the ABCD 4.0 release, excluding ABCD 1.0 release, sub-sample.
- N
Measurement Invariance: Monetary Incentive Delay Task: subs 32 effect...
- neurovault.org
niftiUpdated Oct 27, 2023+ more versionsShareFacebookTwitterEmailClick to copy linkLink copiedCite(2023). Measurement Invariance: Monetary Incentive Delay Task: subs 32 effect onesample contrast Lgain Neut stat cohensd sample ABCD type site19 [Dataset]. http://identifiers.org/neurovault.image:805365niftiAvailable download formatsUnique identifierhttps://identifiers.org/neurovault.image:805365Dataset updatedOct 27, 2023LicenseCC0 1.0 Universal Public Domain Dedicationhttps://creativecommons.org/publicdomain/zero/1.0/
License information was derived automaticallyDescriptionsubs-32_effect-onesample_contrast-Lgain-Neut_stat-cohensd_sample-ABCD_type-site19.nii.gz
Collection description
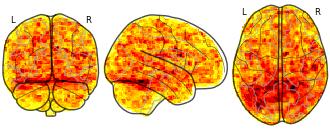
This collection includes the output files, z- and/or t-statistics (uncorrected), cohen-s D statistical maps (calculated: t-statistic / sqrt(n)) for subjects from the Adolescent Brain Cognitive Development (ABCD), Adolescent Health Risk Behavior (AHRB) and Michigan Longitudinal Sample (MLS). The analyses are for the modified monetary incentive delay task. ABCD and AHRB are multiband acquisitions (TR = 800ms, vox = 2.4mm; MB factor = 6). MLS is a spiral acquisition (TR = 2000ms; vox = 4mm). All datasets were preprocessed using fMRIprep v23.1.0 (fmap correction in AHRB/ABCD and no slice-time correction; MLS no fieldmap correction with slice-time correction).
For ABCD, AHRB and MLS, the following [six[ contrasts types are included for the anticipation phase (*_contrast-[type]*):
Lgain-Neut: Large Gain ($5) > Neutral (no money at stake)
LSgain-Neut: Large Gain ($5, .5) & Small Gain ($0.20, .5) > Neutral (no money at stake)
Lgain-Lloss: Large Gain ($5) > Large Loss (-$5)
Lloss-Neut: Large Loss (-$5) > Neutral (no money at stake)
LSloss-Neut: Large Loss (-$5, .5) & Small Loss (-$0.20, .5) > Neutral (no money at stake)
Lloss-Lgain: Large Loss (-$5) > Large Gain ($5)For the ABCD (N = 346) , AHRB (N = 97) and MLS (N = 112) there are group level contrasts for each of the two runs, e.g. *_type-run-01.nii.gz, *_type-run-02.nii.gz. For ABCD samples maps are included across different scanners and sites. Maps include site specific (e.g, *_type-site06.nii.gz) and scanner specific (e.g, *_type-SIEMENS.nii.gz) maps. Note, the N for each map is indicated in the first field, e.g subs-347 the sample size N = 347.
Subject species
homo sapiens
Map type
Other
- f
Comparison of participants removed due to missing data with participants who...
- plos.figshare.com
xlsxUpdated Jun 2, 2023ShareFacebookTwitterEmailClick to copy linkLink copiedCiteYi Zhou; Narun Pat; Michael C. Neale (2023). Comparison of participants removed due to missing data with participants who were retained for the t-test analyses. [Dataset]. http://doi.org/10.1371/journal.pone.0277158.s027xlsxAvailable download formatsUnique identifierhttps://doi.org/10.1371/journal.pone.0277158.s027Dataset updatedJun 2, 2023Dataset provided byPLOS ONEAuthorsYi Zhou; Narun Pat; Michael C. NealeLicenseAttribution 4.0 (CC BY 4.0)https://creativecommons.org/licenses/by/4.0/
License information was derived automaticallyDescriptionThe proportion (%) of participants in each group for each measure are shown. Student’s t-test was done to compare age (in months) between the “removed” and “retained” groups. Chi-square tests of independence were done for all other measures. P-values < 0.05 are bolded. (XLSX)
- f
Average Generalized Variance Inflation Factor (GVIF) values for predictors...
- plos.figshare.com
xlsxUpdated Jun 2, 2023+ more versionsShareFacebookTwitterEmailClick to copy linkLink copiedCiteYi Zhou; Narun Pat; Michael C. Neale (2023). Average Generalized Variance Inflation Factor (GVIF) values for predictors from multiple linear regressions controlling for sociodemographic covariates across the ABCD samples. [Dataset]. http://doi.org/10.1371/journal.pone.0277158.s031xlsxAvailable download formatsUnique identifierhttps://doi.org/10.1371/journal.pone.0277158.s031Dataset updatedJun 2, 2023Dataset provided byPLOS ONEAuthorsYi Zhou; Narun Pat; Michael C. NealeLicenseAttribution 4.0 (CC BY 4.0)https://creativecommons.org/licenses/by/4.0/
License information was derived automaticallyDescriptionAverage Generalized Variance Inflation Factor (GVIF) values for predictors from multiple linear regressions controlling for sociodemographic covariates across the ABCD samples.
- N
Measurement Invariance: Monetary Incentive Delay Task: subs 112 effect...
- neurovault.org
niftiUpdated Oct 27, 2023+ more versionsShareFacebookTwitterEmailClick to copy linkLink copiedCite(2023). Measurement Invariance: Monetary Incentive Delay Task: subs 112 effect onesample contrast LSgain Neut stat tstat sample MLS [Dataset]. http://identifiers.org/neurovault.image:805247niftiAvailable download formatsUnique identifierhttps://identifiers.org/neurovault.image:805247Dataset updatedOct 27, 2023LicenseCC0 1.0 Universal Public Domain Dedicationhttps://creativecommons.org/publicdomain/zero/1.0/
License information was derived automaticallyDescriptionb'stat of contrast [1.]'
Collection description
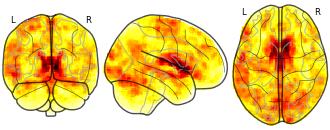
This collection includes the output files, z- and/or t-statistics (uncorrected), cohen-s D statistical maps (calculated: t-statistic / sqrt(n)) for subjects from the Adolescent Brain Cognitive Development (ABCD), Adolescent Health Risk Behavior (AHRB) and Michigan Longitudinal Sample (MLS). The analyses are for the modified monetary incentive delay task. ABCD and AHRB are multiband acquisitions (TR = 800ms, vox = 2.4mm; MB factor = 6). MLS is a spiral acquisition (TR = 2000ms; vox = 4mm). All datasets were preprocessed using fMRIprep v23.1.0 (fmap correction in AHRB/ABCD and no slice-time correction; MLS no fieldmap correction with slice-time correction).
For ABCD, AHRB and MLS, the following [six[ contrasts types are included for the anticipation phase (*_contrast-[type]*):
Lgain-Neut: Large Gain ($5) > Neutral (no money at stake)
LSgain-Neut: Large Gain ($5, .5) & Small Gain ($0.20, .5) > Neutral (no money at stake)
Lgain-Lloss: Large Gain ($5) > Large Loss (-$5)
Lloss-Neut: Large Loss (-$5) > Neutral (no money at stake)
LSloss-Neut: Large Loss (-$5, .5) & Small Loss (-$0.20, .5) > Neutral (no money at stake)
Lloss-Lgain: Large Loss (-$5) > Large Gain ($5)For the ABCD (N = 346) , AHRB (N = 97) and MLS (N = 112) there are group level contrasts for each of the two runs, e.g. *_type-run-01.nii.gz, *_type-run-02.nii.gz. For ABCD samples maps are included across different scanners and sites. Maps include site specific (e.g, *_type-site06.nii.gz) and scanner specific (e.g, *_type-SIEMENS.nii.gz) maps. Note, the N for each map is indicated in the first field, e.g subs-347 the sample size N = 347.
Subject species
homo sapiens
Map type
Other

Not seeing a result you expected?
Learn how you can add new datasets to our index.
FacebookTwitterEffects of anhedonia from multiple linear regressions controlling for sociodemographic factors and clinical comorbidities across the ABCD study samples.
Attribution 4.0 (CC BY 4.0)https://creativecommons.org/licenses/by/4.0/
License information was derived automatically
Effects of anhedonia from multiple linear regressions controlling for sociodemographic factors and clinical comorbidities across the ABCD study samples.