Area Deprivation Index (ADI)
- redivis.com
application/jsonl +7Updated Mar 2, 2021+ more versions Share
Share Facebook
 Twitter
 EmailClick to copy linkLink copiedCiteColumbia Data Platform Demo (2021). Area Deprivation Index (ADI) [Dataset]. https://redivis.com/datasets/axrk-7jx8wdwc2spss, avro, sas, parquet, stata, arrow, csv, application/jsonlAvailable download formatsDataset updatedMar 2, 2021Dataset provided byRedivis Inc.AuthorsColumbia Data Platform DemoTime period coveredJan 1, 2018 - Dec 31, 2020Description
Abstract
ADI: An index of socioeconomic status for communities. Dataset ingested directly from BigQuery.
Documentation
The Area Deprivation Index (ADI) can show where areas of deprivation and affluence exist within a community. The ADI is calculated with 17 indicators from the American Community Survey (ACS) having been well-studied in the peer-reviewed literature since 2003, and used for 20 years by the Health Resources and Services Administration (HRSA). High levels of deprivation have been linked to health outcomes such as 30-day hospital readmission rates, cardiovascular disease deaths, cervical cancer incidence, cancer deaths, and all-cause mortality. The 17 indicators from the ADI encompass income, education, employment, and housing conditions at the Census Block Group level.
The ADI is available on BigQuery for release years 2018-2020 and is reported as a percentile that is 0-100% with 50% indicating a "middle of the nation" percentile. Data is provided at the county, ZIP, and Census Block Group levels. Neighborhood and racial disparities occur when some neighborhoods have high ADI scores and others have low scores. A low ADI score indicates affluence or prosperity. A high ADI score is indicative of high levels of deprivation. Raw ADI scores and additional statistics and dataviz can be seen in this ADI story with a BroadStreet free account.
Dataset source: https://help.broadstreet.io/article/adi/
Area Deprivation Index (ADI)
- console.cloud.google.com
Updated Aug 7, 2023+ more versionsShareFacebookTwitterEmailClick to copy linkLink copiedCitehttps://console.cloud.google.com/marketplace/browse?filter=partner:BroadStreet&hl=pl&inv=1&invt=Ab2jpg (2023). Area Deprivation Index (ADI) [Dataset]. https://console.cloud.google.com/marketplace/product/broadstreet-public-data/adi?hl=plDataset updatedAug 7, 2023DescriptionThe Area Deprivation Index (ADI) can show where areas of deprivation and affluence exist within a community. The ADI is calculated with 17 indicators from the American Community Survey (ACS) having been well-studied in the peer-reviewed literature since 2003, and used for 20 years by the Health Resources and Services Administration (HRSA). High levels of deprivation have been linked to health outcomes such as 30-day hospital readmission rates, cardiovascular disease deaths, cervical cancer incidence, cancer deaths, and all-cause mortality. The 17 indicators from the ADI encompass income, education, employment, and housing conditions at the Census Block Group level.The ADI is available on BigQuery for release years 2018-2020 and is reported as a percentile that is 0-100% with 50% indicating a "middle of the nation" percentile. Data is provided at the county, ZIP, and Census Block Group levels. Neighborhood and racial disparities occur when some neighborhoods have high ADI scores and others have low scores. A low ADI score indicates affluence or prosperity. A high ADI score is indicative of high levels of deprivation. Raw ADI scores and additional statistics and dataviz can be seen in this ADI story with a BroadStreet free account.Much of the ADI research and popularity would not be possible without the excellent work of Dr. Amy Kind and colleagues at HIPxChange and at The University of Wisconsin Madison.This public dataset is hosted in Google BigQuery and is included in BigQuery's 1TB/mo of free tier processing. This means that each user receives 1TB of free BigQuery processing every month, which can be used to run queries on this public dataset. Watch this short video to learn how to get started quickly using BigQuery to access public datasets. What is BigQuery. Dowiedz się więcej
Area Deprivation Index (ADI)
- console.cloud.google.com
Updated May 27, 2023ShareFacebookTwitterEmailClick to copy linkLink copiedCitehttps://console.cloud.google.com/marketplace/browse?filter=partner:BroadStreet&hl=ko&inv=1&invt=Ab2zXw (2023). Area Deprivation Index (ADI) [Dataset]. https://console.cloud.google.com/marketplace/product/broadstreet-public-data/adi?hl=koDataset updatedMay 27, 2023DescriptionThe Area Deprivation Index (ADI) can show where areas of deprivation and affluence exist within a community. The ADI is calculated with 17 indicators from the American Community Survey (ACS) having been well-studied in the peer-reviewed literature since 2003, and used for 20 years by the Health Resources and Services Administration (HRSA). High levels of deprivation have been linked to health outcomes such as 30-day hospital readmission rates, cardiovascular disease deaths, cervical cancer incidence, cancer deaths, and all-cause mortality. The 17 indicators from the ADI encompass income, education, employment, and housing conditions at the Census Block Group level.The ADI is available on BigQuery for release years 2018-2020 and is reported as a percentile that is 0-100% with 50% indicating a "middle of the nation" percentile. Data is provided at the county, ZIP, and Census Block Group levels. Neighborhood and racial disparities occur when some neighborhoods have high ADI scores and others have low scores. A low ADI score indicates affluence or prosperity. A high ADI score is indicative of high levels of deprivation. Raw ADI scores and additional statistics and dataviz can be seen in this ADI story with a BroadStreet free account.Much of the ADI research and popularity would not be possible without the excellent work of Dr. Amy Kind and colleagues at HIPxChange and at The University of Wisconsin Madison.This public dataset is hosted in Google BigQuery and is included in BigQuery's 1TB/mo of free tier processing. This means that each user receives 1TB of free BigQuery processing every month, which can be used to run queries on this public dataset. Watch this short video to learn how to get started quickly using BigQuery to access public datasets. What is BigQuery. 자세히 알아보기
- b
Area Deprivation Index-State
- emotional.byteroad.net
ShareFacebookTwitterEmailClick to copy linkLink copiedCiteArea Deprivation Index-State [Dataset]. https://emotional.byteroad.net/collections/lansing_city_blockgroup_areadeprivationindex_statescore_2020html, json, jsonld, application/schema+json, application/geo+jsonAvailable download formatsLicenseAttribution 4.0 (CC BY 4.0)https://creativecommons.org/licenses/by/4.0/
License information was derived automaticallyArea coveredDescriptionArea Deprivation Index state score in 2020. The Area Deprivation Index (ADI) ranks neighborhoods on the basis of socioeconomic disadvantage in the areas of income, education, employment, and housing quality. Areas with greater disadvantage are ranked higher. National scores are normalized to the whole country, and state scores are normalized to a particular state. Higher Area Deprivation Index scores have been shown to correlate with worse health outcomes in measures such as life expectancy. This index was created by researchers at the University of Wisconsin-Madison based on a methodology originally developed by the Health Resources and Services Administration. Areas on this map are ranked against other areas within the state. State scores represent deciles. In other words, they are divided into 10 groups of the same size, where 1 is the lowest rate of disadvantage and 10 is the highest.
Area Deprivation Index (ADI)
- console.cloud.google.com
Updated Apr 27, 2023ShareFacebookTwitterEmailClick to copy linkLink copiedCitehttps://console.cloud.google.com/marketplace/browse?filter=partner:BroadStreet&hl=it&inv=1&invt=Ab2yUg (2023). Area Deprivation Index (ADI) [Dataset]. https://console.cloud.google.com/marketplace/product/broadstreet-public-data/adi?hl=itDataset updatedApr 27, 2023DescriptionThe Area Deprivation Index (ADI) can show where areas of deprivation and affluence exist within a community. The ADI is calculated with 17 indicators from the American Community Survey (ACS) having been well-studied in the peer-reviewed literature since 2003, and used for 20 years by the Health Resources and Services Administration (HRSA). High levels of deprivation have been linked to health outcomes such as 30-day hospital readmission rates, cardiovascular disease deaths, cervical cancer incidence, cancer deaths, and all-cause mortality. The 17 indicators from the ADI encompass income, education, employment, and housing conditions at the Census Block Group level.The ADI is available on BigQuery for release years 2018-2020 and is reported as a percentile that is 0-100% with 50% indicating a "middle of the nation" percentile. Data is provided at the county, ZIP, and Census Block Group levels. Neighborhood and racial disparities occur when some neighborhoods have high ADI scores and others have low scores. A low ADI score indicates affluence or prosperity. A high ADI score is indicative of high levels of deprivation. Raw ADI scores and additional statistics and dataviz can be seen in this ADI story with a BroadStreet free account.Much of the ADI research and popularity would not be possible without the excellent work of Dr. Amy Kind and colleagues at HIPxChange and at The University of Wisconsin Madison.This public dataset is hosted in Google BigQuery and is included in BigQuery's 1TB/mo of free tier processing. This means that each user receives 1TB of free BigQuery processing every month, which can be used to run queries on this public dataset. Watch this short video to learn how to get started quickly using BigQuery to access public datasets. What is BigQuery. Scopri di più
Area Deprivation Index (ADI)
- console.cloud.google.com
Updated Mar 22, 2024ShareFacebookTwitterEmailClick to copy linkLink copiedCitehttps://console.cloud.google.com/marketplace/browse(cameo:browse)?filter=partner:BroadStreet&hl=fr&inv=1&invt=Ab2hgQ (2024). Area Deprivation Index (ADI) [Dataset]. https://console.cloud.google.com/marketplace/product/broadstreet-public-data/adi(cameo:browse)?filter=category:covid19&hl=frDataset updatedMar 22, 2024DescriptionThe Area Deprivation Index (ADI) can show where areas of deprivation and affluence exist within a community. The ADI is calculated with 17 indicators from the American Community Survey (ACS) having been well-studied in the peer-reviewed literature since 2003, and used for 20 years by the Health Resources and Services Administration (HRSA). High levels of deprivation have been linked to health outcomes such as 30-day hospital readmission rates, cardiovascular disease deaths, cervical cancer incidence, cancer deaths, and all-cause mortality. The 17 indicators from the ADI encompass income, education, employment, and housing conditions at the Census Block Group level.The ADI is available on BigQuery for release years 2018-2020 and is reported as a percentile that is 0-100% with 50% indicating a "middle of the nation" percentile. Data is provided at the county, ZIP, and Census Block Group levels. Neighborhood and racial disparities occur when some neighborhoods have high ADI scores and others have low scores. A low ADI score indicates affluence or prosperity. A high ADI score is indicative of high levels of deprivation. Raw ADI scores and additional statistics and dataviz can be seen in this ADI story with a BroadStreet free account.Much of the ADI research and popularity would not be possible without the excellent work of Dr. Amy Kind and colleagues at HIPxChange and at The University of Wisconsin Madison.This public dataset is hosted in Google BigQuery and is included in BigQuery's 1TB/mo of free tier processing. This means that each user receives 1TB of free BigQuery processing every month, which can be used to run queries on this public dataset. Watch this short video to learn how to get started quickly using BigQuery to access public datasets. What is BigQuery. En savoir plus
Area Deprivation Index (ADI)
- console.cloud.google.com
Updated Mar 16, 2024ShareFacebookTwitterEmailClick to copy linkLink copiedCitehttps://console.cloud.google.com/marketplace/browse(cameo:product/broadstreet-public-data/adi)?filter=partner:BroadStreet&hl=de&inv=1&invt=Ab2WQw (2024). Area Deprivation Index (ADI) [Dataset]. https://console.cloud.google.com/marketplace/product/broadstreet-public-data/adi(cameo:product/broadstreet-public-data/adi)?hl=deDataset updatedMar 16, 2024DescriptionThe Area Deprivation Index (ADI) can show where areas of deprivation and affluence exist within a community. The ADI is calculated with 17 indicators from the American Community Survey (ACS) having been well-studied in the peer-reviewed literature since 2003, and used for 20 years by the Health Resources and Services Administration (HRSA). High levels of deprivation have been linked to health outcomes such as 30-day hospital readmission rates, cardiovascular disease deaths, cervical cancer incidence, cancer deaths, and all-cause mortality. The 17 indicators from the ADI encompass income, education, employment, and housing conditions at the Census Block Group level.The ADI is available on BigQuery for release years 2018-2020 and is reported as a percentile that is 0-100% with 50% indicating a "middle of the nation" percentile. Data is provided at the county, ZIP, and Census Block Group levels. Neighborhood and racial disparities occur when some neighborhoods have high ADI scores and others have low scores. A low ADI score indicates affluence or prosperity. A high ADI score is indicative of high levels of deprivation. Raw ADI scores and additional statistics and dataviz can be seen in this ADI story with a BroadStreet free account.Much of the ADI research and popularity would not be possible without the excellent work of Dr. Amy Kind and colleagues at HIPxChange and at The University of Wisconsin Madison.This public dataset is hosted in Google BigQuery and is included in BigQuery's 1TB/mo of free tier processing. This means that each user receives 1TB of free BigQuery processing every month, which can be used to run queries on this public dataset. Watch this short video to learn how to get started quickly using BigQuery to access public datasets. What is BigQuery. Weitere Informationen
- f
Data_Sheet_1_Investigating the relationships between motor skills, cognitive...
- frontiersin.figshare.com
docxUpdated Jun 25, 2024ShareFacebookTwitterEmailClick to copy linkLink copiedCiteMadeline Hooten; Marcus Ortega; Adewale Oyeyemi; Fang Yu; Edward Ofori (2024). Data_Sheet_1_Investigating the relationships between motor skills, cognitive status, and area deprivation index in Arizona: a pilot study.docx [Dataset]. http://doi.org/10.3389/fpubh.2024.1385435.s001docxAvailable download formatsUnique identifierhttps://doi.org/10.3389/fpubh.2024.1385435.s001Dataset updatedJun 25, 2024Dataset provided byFrontiersAuthorsMadeline Hooten; Marcus Ortega; Adewale Oyeyemi; Fang Yu; Edward OforiLicenseAttribution 4.0 (CC BY 4.0)https://creativecommons.org/licenses/by/4.0/
License information was derived automaticallyDescriptionIntroductionPrevious studies highlight the negative impact of adverse socioeconomic conditions throughout life on motor skills and cognitive health. Factors such as cognitive activity, physical activity, lifestyle, and socioeconomic position significantly affect general health status and brain health. This pilot study investigates the relationships among the Area Deprivation Index (ADI)—a measure of neighborhood-level socioeconomic deprivation, brain structure (cortical volume and thickness), and cognitive status in adults in Arizona. Identifying measures sensitive to ADI could elucidate mechanisms driving cognitive decline.MethodsThe study included 22 adults(mean age = 56.2 ± 15.2) in Arizona, residing in the area for over 10 years(mean = 42.7 ± 15.8). We assessed specific cognitive domains using the NeuroTrax™ cognitive screening test, which evaluates memory, executive function, visual–spatial processing, attention, information processing speed, and motor function. We also measured cortical thickness and volume in 10 cortical regions using FreeSurfer 7.2. Linear regression tests were conducted to examine the relationships between ADI metrics, cognitive status, and brain health measures.ResultsResults indicated a significant inverse relationship between ADI metrics and memory scores, explaining 25% of the variance. Both national and state ADI metrics negatively correlated with motor skills and global cognition (r’s
Area Deprivation Index (ADI)
- console.cloud.google.com
Updated May 7, 2023ShareFacebookTwitterEmailClick to copy linkLink copiedCitehttps://console.cloud.google.com/marketplace/browse?filter=partner:BroadStreet&hl=zh-cn&inv=1&invt=Ab2wfA (2023). Area Deprivation Index (ADI) [Dataset]. https://console.cloud.google.com/marketplace/product/broadstreet-public-data/adi?hl=zh-cnDataset updatedMay 7, 2023DescriptionThe Area Deprivation Index (ADI) can show where areas of deprivation and affluence exist within a community. The ADI is calculated with 17 indicators from the American Community Survey (ACS) having been well-studied in the peer-reviewed literature since 2003, and used for 20 years by the Health Resources and Services Administration (HRSA). High levels of deprivation have been linked to health outcomes such as 30-day hospital readmission rates, cardiovascular disease deaths, cervical cancer incidence, cancer deaths, and all-cause mortality. The 17 indicators from the ADI encompass income, education, employment, and housing conditions at the Census Block Group level.The ADI is available on BigQuery for release years 2018-2020 and is reported as a percentile that is 0-100% with 50% indicating a "middle of the nation" percentile. Data is provided at the county, ZIP, and Census Block Group levels. Neighborhood and racial disparities occur when some neighborhoods have high ADI scores and others have low scores. A low ADI score indicates affluence or prosperity. A high ADI score is indicative of high levels of deprivation. Raw ADI scores and additional statistics and dataviz can be seen in this ADI story with a BroadStreet free account.Much of the ADI research and popularity would not be possible without the excellent work of Dr. Amy Kind and colleagues at HIPxChange and at The University of Wisconsin Madison.This public dataset is hosted in Google BigQuery and is included in BigQuery's 1TB/mo of free tier processing. This means that each user receives 1TB of free BigQuery processing every month, which can be used to run queries on this public dataset. Watch this short video to learn how to get started quickly using BigQuery to access public datasets. What is BigQuery. 了解详情
Supplementary Material for: The association of neighborhood socioeconomic...
- karger.figshare.com
docxUpdated Apr 25, 2024ShareFacebookTwitterEmailClick to copy linkLink copiedCiteVintimilla R.; Benton A.; Morakabian R.; Hall J.R.; Johnson L.A.; O'Bryant S.E.; for the HABS-HD Study Team (2024). Supplementary Material for: The association of neighborhood socioeconomic status with executive function and processing speed in cognitively normal Mexican Americans elders from the Health and Aging Brains Study – Health Disparities cohort [Dataset]. http://doi.org/10.6084/m9.figshare.25688739.v1docxAvailable download formatsUnique identifierhttps://doi.org/10.6084/m9.figshare.25688739.v1Dataset updatedApr 25, 2024AuthorsVintimilla R.; Benton A.; Morakabian R.; Hall J.R.; Johnson L.A.; O'Bryant S.E.; for the HABS-HD Study TeamLicenseAttribution 4.0 (CC BY 4.0)https://creativecommons.org/licenses/by/4.0/
License information was derived automaticallyDescriptionIntroduction: Neighborhood socioeconomic status (NSES) has been linked with overall health, and this study will evaluate whether NSES is cross-sectionally associated with cognition in non-Hispanic Whites (NHW) and Mexican Americans (MA) from the Health and Aging Brain: Health Disparities Study (HABS-HD). Methods: The HABS-HD is a longitudinal study conducted at the University of North Texas Health Science Center. The final sample analyzed (n=1312) were 50 years or older, with unimpaired cognition, and underwent an interview, neuropsychological examination, imaging, and blood draw. NSES was measured using the national area deprivation index (ADI) percentile ranking, which considered socioeconomic variables. Executive function and processing speed were assessed by the trail making tests (A and B) and the digit-symbol substitution test, respectively. Linear regression was used to assess the association of ADI and cognitive measures. Results: MA were younger, more likely to be female, less educated, had higher ADI scores, performed worse on trails B (all p
Area Deprivation Index (ADI)
- console.cloud.google.com
Updated Apr 9, 2023ShareFacebookTwitterEmailClick to copy linkLink copiedCitehttps://console.cloud.google.com/marketplace/browse?filter=partner:BroadStreet&hl=es&inv=1&invt=Ab2wDg (2023). Area Deprivation Index (ADI) [Dataset]. https://console.cloud.google.com/marketplace/product/broadstreet-public-data/adi?hl=esDataset updatedApr 9, 2023DescriptionThe Area Deprivation Index (ADI) can show where areas of deprivation and affluence exist within a community. The ADI is calculated with 17 indicators from the American Community Survey (ACS) having been well-studied in the peer-reviewed literature since 2003, and used for 20 years by the Health Resources and Services Administration (HRSA). High levels of deprivation have been linked to health outcomes such as 30-day hospital readmission rates, cardiovascular disease deaths, cervical cancer incidence, cancer deaths, and all-cause mortality. The 17 indicators from the ADI encompass income, education, employment, and housing conditions at the Census Block Group level.The ADI is available on BigQuery for release years 2018-2020 and is reported as a percentile that is 0-100% with 50% indicating a "middle of the nation" percentile. Data is provided at the county, ZIP, and Census Block Group levels. Neighborhood and racial disparities occur when some neighborhoods have high ADI scores and others have low scores. A low ADI score indicates affluence or prosperity. A high ADI score is indicative of high levels of deprivation. Raw ADI scores and additional statistics and dataviz can be seen in this ADI story with a BroadStreet free account.Much of the ADI research and popularity would not be possible without the excellent work of Dr. Amy Kind and colleagues at HIPxChange and at The University of Wisconsin Madison.This public dataset is hosted in Google BigQuery and is included in BigQuery's 1TB/mo of free tier processing. This means that each user receives 1TB of free BigQuery processing every month, which can be used to run queries on this public dataset. Watch this short video to learn how to get started quickly using BigQuery to access public datasets. What is BigQuery. Más información
Affordability Drivers Index in Latin America and the Caribbean 2021
- statista.com
Updated Jul 11, 2025ShareFacebookTwitterEmailClick to copy linkLink copiedCiteStatista (2025). Affordability Drivers Index in Latin America and the Caribbean 2021 [Dataset]. https://www.statista.com/statistics/1053393/internet-affordability-latin-america/Dataset updatedJul 11, 2025Time period covered2021Area coveredCaribbean, Latin America, Americas, LACDescriptionIn 2021, Colombia provided the most affordable, accessible, and universal internet among the Latin American and Caribbean region, with an internet Affordability Drivers Index (ADI) of *****. Costa Rica, Peru, Argentina and Mexico followed with scores above **. In 2020, approximately ** percent of the Colombian population accessed the internet.
- d
Data from: Evaluating the Effects of Socioeconomic Status on Stroke and...
- search.dataone.org
Updated Nov 19, 2023ShareFacebookTwitterEmailClick to copy linkLink copiedCiteJahangir, A (2023). Evaluating the Effects of Socioeconomic Status on Stroke and Bleeding Risk Scores and Clinical Events in Patients on Oral Anticoagulant for New Onset Atrial Fibrillation [Dataset]. http://doi.org/10.7910/DVN/JESBOCUnique identifierhttps://doi.org/10.7910/DVN/JESBOCDataset updatedNov 19, 2023Dataset provided byHarvard DataverseAuthorsJahangir, ADescriptionThe risk of thromboembolism and bleeding before initiation of oral anticoagulant (OAC) in atrial fibrillation patients is estimated by CHA 2 DS 2 -VASc and HAS-BLED scoring system, respectively. Patients’ socioeconomic status (SES) could influence these risks, but its impact on the two risk scores' predictive performance with respect to clinical events remains unknown. Our objective was to determine if patient SES defined by area deprivation index (ADI), in conjunction with CHA 2 DS 2 -VASc and HAS-BLED scores, could guide oral anticoagulation therapy. Methods and Findings The study cohort included newly diagnosed patients with AF who were treated with warfarin. The cohort was stratified by the time in therapeutic range of INR (TTR), ADI, CHA 2 DS 2 -VASc, and HAS-BLED risk scores. TTR and ischemic and bleeding events during the first year of therapy were compared across subpopulations. Among 7274 patients, those living in the two most deprived quintiles (ADI ≥60%) had a significantly higher risk of ischemic events and those in the most deprived quintile (ADI≥80%) had a significantly increased risk of bleeding events. ADI significantly improved the predictive performance of CHA 2 DS 2 -VASc but not HAS-BLED risk scores. Conclusion ADI can predict increased risk for ischemic and bleeding events in the first year of warfarin therapy in patients with incident AF.
- f
The scoring schemas stratified by ADI.
- plos.figshare.com
xlsUpdated Jun 10, 2023ShareFacebookTwitterEmailClick to copy linkLink copiedCiteKourosh Ravvaz; John A. Weissert; Arshad Jahangir; Christian T. Ruff (2023). The scoring schemas stratified by ADI. [Dataset]. http://doi.org/10.1371/journal.pone.0248134.t002xlsAvailable download formatsUnique identifierhttps://doi.org/10.1371/journal.pone.0248134.t002Dataset updatedJun 10, 2023Dataset provided byPLOS ONEAuthorsKourosh Ravvaz; John A. Weissert; Arshad Jahangir; Christian T. RuffLicenseAttribution 4.0 (CC BY 4.0)https://creativecommons.org/licenses/by/4.0/
License information was derived automaticallyDescriptionThe scoring schemas stratified by ADI.
- f
Additional file 2 of Houston hurricane Harvey health (Houston-3H) study:...
- springernature.figshare.com
xlsxUpdated Jun 1, 2023ShareFacebookTwitterEmailClick to copy linkLink copiedCiteAbiodun O. Oluyomi; Kristen Panthagani; Jesus Sotelo; Xiangjun Gu; Georgina Armstrong; Dan Na Luo; Kristi L. Hoffman; Diana Rohlman; Lane Tidwell; Winifred J. Hamilton; Elaine Symanski; Kimberly Anderson; Joseph F. Petrosino; Cheryl Lyn Walker; Melissa Bondy (2023). Additional file 2 of Houston hurricane Harvey health (Houston-3H) study: assessment of allergic symptoms and stress after hurricane Harvey flooding [Dataset]. http://doi.org/10.6084/m9.figshare.13612583.v1xlsxAvailable download formatsUnique identifierhttps://doi.org/10.6084/m9.figshare.13612583.v1Dataset updatedJun 1, 2023Dataset provided byfigshareAuthorsAbiodun O. Oluyomi; Kristen Panthagani; Jesus Sotelo; Xiangjun Gu; Georgina Armstrong; Dan Na Luo; Kristi L. Hoffman; Diana Rohlman; Lane Tidwell; Winifred J. Hamilton; Elaine Symanski; Kimberly Anderson; Joseph F. Petrosino; Cheryl Lyn Walker; Melissa BondyLicenseAttribution 4.0 (CC BY 4.0)https://creativecommons.org/licenses/by/4.0/
License information was derived automaticallyArea coveredHoustonDescriptionAdditional file 2: Table S2.1. Characteristics of study participants at time point 1 (T1) stratified by Area Deprivation Index (ADI). Results: Summary statistics displaying variable distribution, mean, standard deviation, median, and 1st and 3rd quartiles. We tested for differences between low and high ADI groups using chi-square, T, or Wilcoxon rank-sum tests as appropriate. Analysis performed on Area Deprivation Index-stratified (ADI-stratified) T1 data (Low ADI, N = 102); High ADI, N = 104). Table S2.2. Characteristics of study participants at time point 2 (T2) stratified by Area Deprivation Index (ADI). Results: Summary statistics displaying variable distribution, mean, standard deviation, median, and 1st and 3rd quartiles. We tested for differences between low and high ADI groups using chi-square, T, or Wilcoxon rank-sum tests as appropriate. Analysis performed on Area Deprivation Index-stratified (ADI-stratified) T2 data (Low ADI, N = 143); High ADI, N = 123).
- N
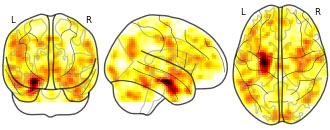
High Functioning Autism Functional Connectivity R-scored Maps: sAHA
- neurovault.org
niftiUpdated May 12, 2017+ more versionsShareFacebookTwitterEmailClick to copy linkLink copiedCite(2017). High Functioning Autism Functional Connectivity R-scored Maps: sAHA [Dataset]. http://identifiers.org/neurovault.image:47241niftiAvailable download formatsUnique identifierhttps://identifiers.org/neurovault.image:47241Dataset updatedMay 12, 2017LicenseCC0 1.0 Universal Public Domain Dedicationhttps://creativecommons.org/publicdomain/zero/1.0/
License information was derived automaticallyDescriptionsmoothed r-scored maps TempPole_Left
Collection description
22 adolescents and young adults with ASD from the local community and from the University of Campinas. A trained and qualified clinician made the diagnosis of ASD using the DSM-5 criteria after interviewing the family and examining each patient. A second investigator confirmed the diagnosis using the “Current” Scores of the Autism Diagnostic Interview-Revised (ADI-R). The ADI-R is a clinical diagnostic instrument for assessing autism in children and adults. The ADI-R provides a diagnostic algorithm for autism as described in both the ICD-10 and DSM-IV and is one of the most important validated ASD measures available in Brazil. Child testing and parent interviews should be viewed as complimentary and necessary components of the diagnostic evaluation after the clinical evaluation and DSM-5 criteria. All patients were required to have a full-scale IQ greater than 85, as measured by the Wechsler Abbreviated Scale of Intelligence.
Exclusion criteria comprised a history of major psychiatric disorders (e.g. depression, psychosis), seizure, head injury, toxic exposure and the evidence of genetic, metabolic or infectious disorders. We also excluded individuals with secondary autism related to a specific etiology such as tuberous sclerosis or Fragile X syndrome. Thirteen individuals in the ASD group were using a variety of psychoactive medications. Nine subjects were not under psychoactive drug treatment. Five subjects were taking psychostimulants, seven were taking antipsychotics and six were taking selective serotonin reuptake inhibitors (SSRIs). Six of these subjects were using more than one of the medications listed above. Participants were instructed not take any medication one day before their visit.We are including FC maps derived from 5 distinct seeds: PCC (the MNI coordinate −41 13 −29); medial frontal region (MNI 0 49 −3); left amygdala (MNI −23 −4 −20); left anterior hippocampus (MNI −24 −13 −20); left temporal pole (−41 13 −29)
Subject species
homo sapiens
Modality
fMRI-BOLD
Analysis level
single-subject
Cognitive paradigm (task)
None / Other
Map type
Other
- f
Pearson correlation coefficients and p-values for ADI-R compared against...
- plos.figshare.com
xlsUpdated May 31, 2023ShareFacebookTwitterEmailClick to copy linkLink copiedCiteOlga Dona; Geoffrey B. Hall; Michael D. Noseworthy (2023). Pearson correlation coefficients and p-values for ADI-R compared against regional rs-BOLD Z-score. [Dataset]. http://doi.org/10.1371/journal.pone.0190081.t003xlsAvailable download formatsUnique identifierhttps://doi.org/10.1371/journal.pone.0190081.t003Dataset updatedMay 31, 2023Dataset provided byPLOS ONEAuthorsOlga Dona; Geoffrey B. Hall; Michael D. NoseworthyLicenseAttribution 4.0 (CC BY 4.0)https://creativecommons.org/licenses/by/4.0/
License information was derived automaticallyDescriptionADI-R social interaction (ADI_SOC), ADI-R verbal communication (ADI_VERB) and ADI-R restricted and repetitive behaviors (ADI_RRB) and ADI total (ADI_TOT).
- f
Participants' characteristics in the ASD group (age, handedness, IQ, ADOS,...
- plos.figshare.com
- figshare.com
xlsUpdated Jun 1, 2023ShareFacebookTwitterEmailClick to copy linkLink copiedCiteHanna B. Cygan; Pawel Tacikowski; Pawel Ostaszewski; Izabela Chojnicka; Anna Nowicka (2023). Participants' characteristics in the ASD group (age, handedness, IQ, ADOS, and ADI-R scores) and in the control group (age, handedness, and IQ scores). [Dataset]. http://doi.org/10.1371/journal.pone.0086020.t001xlsAvailable download formatsUnique identifierhttps://doi.org/10.1371/journal.pone.0086020.t001Dataset updatedJun 1, 2023Dataset provided byPLOS ONEAuthorsHanna B. Cygan; Pawel Tacikowski; Pawel Ostaszewski; Izabela Chojnicka; Anna NowickaLicenseAttribution 4.0 (CC BY 4.0)https://creativecommons.org/licenses/by/4.0/
License information was derived automaticallyDescriptionAll subjects were male.

Not seeing a result you expected?
Learn how you can add new datasets to our index.
FacebookTwitterAbstract
ADI: An index of socioeconomic status for communities. Dataset ingested directly from BigQuery.
Documentation
The Area Deprivation Index (ADI) can show where areas of deprivation and affluence exist within a community. The ADI is calculated with 17 indicators from the American Community Survey (ACS) having been well-studied in the peer-reviewed literature since 2003, and used for 20 years by the Health Resources and Services Administration (HRSA). High levels of deprivation have been linked to health outcomes such as 30-day hospital readmission rates, cardiovascular disease deaths, cervical cancer incidence, cancer deaths, and all-cause mortality. The 17 indicators from the ADI encompass income, education, employment, and housing conditions at the Census Block Group level.
The ADI is available on BigQuery for release years 2018-2020 and is reported as a percentile that is 0-100% with 50% indicating a "middle of the nation" percentile. Data is provided at the county, ZIP, and Census Block Group levels. Neighborhood and racial disparities occur when some neighborhoods have high ADI scores and others have low scores. A low ADI score indicates affluence or prosperity. A high ADI score is indicative of high levels of deprivation. Raw ADI scores and additional statistics and dataviz can be seen in this ADI story with a BroadStreet free account.
Dataset source: https://help.broadstreet.io/article/adi/