- f
Result of external validation using ADNI multimodal dataset in NC vs. MCI...
- plos.figshare.com
xlsUpdated Dec 23, 2024 Share
Share Facebook
 Twitter
 EmailClick to copy linkLink copiedCiteGyu-Bin Lee; Young-Jin Jeong; Do-Young Kang; Hyun-Jin Yun; Min Yoon (2024). Result of external validation using ADNI multimodal dataset in NC vs. MCI vs. AD classification (mean ± SD). [Dataset]. http://doi.org/10.1371/journal.pone.0315809.t008xlsAvailable download formatsUnique identifierhttps://doi.org/10.1371/journal.pone.0315809.t008Dataset updatedDec 23, 2024Dataset provided byPLOS ONEAuthorsGyu-Bin Lee; Young-Jin Jeong; Do-Young Kang; Hyun-Jin Yun; Min YoonLicense
Attribution 4.0 (CC BY 4.0)https://creativecommons.org/licenses/by/4.0/
License information was derived automaticallyDescriptionResult of external validation using ADNI multimodal dataset in NC vs. MCI vs. AD classification (mean ± SD).
- N
Cortical hypometabolism reflects local atrophy and tau pathology in...
- neurovault.org
niftiUpdated Feb 23, 2024+ more versionsShareFacebookTwitterEmailClick to copy linkLink copiedCite(2024). Cortical hypometabolism reflects local atrophy and tau pathology in symptomatic Alzheimer’s disease: hypometabolism, UCSF [Dataset]. http://identifiers.org/neurovault.image:440356niftiAvailable download formatsUnique identifierhttps://identifiers.org/neurovault.image:440356Dataset updatedFeb 23, 2024LicenseCC0 1.0 Universal Public Domain Dedicationhttps://creativecommons.org/publicdomain/zero/1.0/
License information was derived automaticallyDescriptionMean gray matter hypometabolism in UCSF cohort (W-score). Gray-matter masked.
Higher W values indicate lower FDG-SUVR values in patients compared to controls.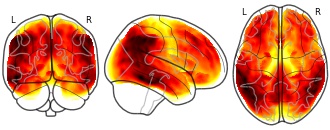
Collection description
Data from Strom et al, MedRxiv (2020), Brain (2021).
Summary mean images of FDG-PET, tau-PET, amyloid-PET, and MRI volume for UCSF and ADNI cohorts.Subject species
homo sapiens
Modality
PET FDG
Analysis level
group
Cognitive paradigm (task)
None / Other
Map type
Other
- N
Cortical hypometabolism reflects local atrophy and tau pathology in...
- neurovault.org
niftiUpdated Feb 23, 2024+ more versionsShareFacebookTwitterEmailClick to copy linkLink copiedCite(2024). Cortical hypometabolism reflects local atrophy and tau pathology in symptomatic Alzheimer’s disease: tau, ADNI [Dataset]. http://identifiers.org/neurovault.image:440357niftiAvailable download formatsUnique identifierhttps://identifiers.org/neurovault.image:440357Dataset updatedFeb 23, 2024LicenseCC0 1.0 Universal Public Domain Dedicationhttps://creativecommons.org/publicdomain/zero/1.0/
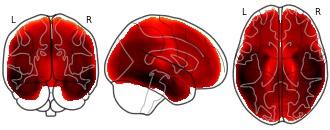
License information was derived automaticallyDescriptionMean Flortaucipir SUVR in ADNI cohort. Gray-matter masked.
Collection description
Data from Strom et al, MedRxiv (2020), Brain (2021).
Summary mean images of FDG-PET, tau-PET, amyloid-PET, and MRI volume for UCSF and ADNI cohorts.Subject species
homo sapiens
Modality
PET other
Analysis level
group
Cognitive paradigm (task)
None / Other
Map type
Other
- f
Mean (SD) of the volumes (in mm3) in the left hippocampus in the baseline...
- plos.figshare.com
xlsUpdated Jun 9, 2023ShareFacebookTwitterEmailClick to copy linkLink copiedCiteAlbert K. Hoang Duc; Marc Modat; Kelvin K. Leung; M. Jorge Cardoso; Josephine Barnes; Timor Kadir; Sébastien Ourselin (2023). Mean (SD) of the volumes (in mm3) in the left hippocampus in the baseline images of the labelled ADNI data set of 30 images for method validation. [Dataset]. http://doi.org/10.1371/journal.pone.0070059.t005xlsAvailable download formatsUnique identifierhttps://doi.org/10.1371/journal.pone.0070059.t005Dataset updatedJun 9, 2023Dataset provided byPLOS ONEAuthorsAlbert K. Hoang Duc; Marc Modat; Kelvin K. Leung; M. Jorge Cardoso; Josephine Barnes; Timor Kadir; Sébastien OurselinLicenseAttribution 4.0 (CC BY 4.0)https://creativecommons.org/licenses/by/4.0/
License information was derived automaticallyDescriptionMean (SD) of the volumes (in mm3) in the left hippocampus in the baseline images of the labelled ADNI data set of 30 images for method validation.
- f
S1 File - Gaussian Mixture Models and Model Selection for [18F]...
- plos.figshare.com
zipUpdated May 31, 2023ShareFacebookTwitterEmailClick to copy linkLink copiedCiteRui Li; Robert Perneczky; Igor Yakushev; Stefan Förster; Alexander Kurz; Alexander Drzezga; Stefan Kramer (2023). S1 File - Gaussian Mixture Models and Model Selection for [18F] Fluorodeoxyglucose Positron Emission Tomography Classification in Alzheimer’s Disease [Dataset]. http://doi.org/10.1371/journal.pone.0122731.s001zipAvailable download formatsUnique identifierhttps://doi.org/10.1371/journal.pone.0122731.s001Dataset updatedMay 31, 2023Dataset provided byPLOS ONEAuthorsRui Li; Robert Perneczky; Igor Yakushev; Stefan Förster; Alexander Kurz; Alexander Drzezga; Stefan KramerLicenseAttribution 4.0 (CC BY 4.0)https://creativecommons.org/licenses/by/4.0/
License information was derived automaticallyDescriptionTxt A, Use of prediction model. It explains the use of prediction models of TUM data. Mat B, Prediction model of NC against AD using grand mean saved in MATLAB format. Represents the saved prediction model in MATLAB file format. The model is used for NC against AD, and is trained using the grand mean intensity normalization. The brain voxels are divided into 50 bins, which shows the best predictive performance by an internal cross-validation. BIC is used as the model selection method. In short, the model can be denoted as “predictionModel_grandMean_50_NCAD”. The meaning of the following models can be inferred similarly. Mat C, Prediction model of NC against MCI using grand mean saved in MATLAB format. Represents “predictionModel_grandMean_60_NCMCI”. Mat D, Prediction model of MCI against AD using pSMC saved in MATLAB format. Represents “predictionModel_PSMC_110_MCIAD”. Mat E, Prediction model of NC against MCI using pSMC saved in MATLAB format. Represents “predictionModel_PSMC_80_NCMCI”. Mat F, Prediction model of NC against AD using pSMC saved in MATLAB format. Represents “predictionModel_PSMC_50_NCAD”. Mat G, Prediction model of MCI against AD using grand mean saved in MATLAB format. Represents “predictionModel_grandMean_90_MCIAD”. (ZIP)
- f
Descriptive statistics (mean±sd for continuous variables, percentage for...
- plos.figshare.com
xlsUpdated Oct 19, 2023ShareFacebookTwitterEmailClick to copy linkLink copiedCiteIvan Koychev; Evgeniy Marinov; Simon Young; Sophia Lazarova; Denitsa Grigorova; Dean Palejev (2023). Descriptive statistics (mean±sd for continuous variables, percentage for binary) of the variables included in the models for European Prevention of Alzheimer’s Dementia Longitudinal Cohort Study (EPAD) and Alzheimer’s Diseasing Neuroimaging Initiative (ADNI). [Dataset]. http://doi.org/10.1371/journal.pone.0288039.t001xlsAvailable download formatsUnique identifierhttps://doi.org/10.1371/journal.pone.0288039.t001Dataset updatedOct 19, 2023Dataset provided byPLOS ONEAuthorsIvan Koychev; Evgeniy Marinov; Simon Young; Sophia Lazarova; Denitsa Grigorova; Dean PalejevLicenseAttribution 4.0 (CC BY 4.0)https://creativecommons.org/licenses/by/4.0/
License information was derived automaticallyDescriptionDescriptive statistics (mean±sd for continuous variables, percentage for binary) of the variables included in the models for European Prevention of Alzheimer’s Dementia Longitudinal Cohort Study (EPAD) and Alzheimer’s Diseasing Neuroimaging Initiative (ADNI).
- f
Mean results of the incremental experiment with our system.
- plos.figshare.com
xlsUpdated Jun 1, 2023ShareFacebookTwitterEmailClick to copy linkLink copiedCiteYeshu Li; Ziming Qiu; Xingyu Fan; Xianglong Liu; Eric I-Chao Chang; Yan Xu (2023). Mean results of the incremental experiment with our system. [Dataset]. http://doi.org/10.1371/journal.pone.0270339.t007xlsAvailable download formatsUnique identifierhttps://doi.org/10.1371/journal.pone.0270339.t007Dataset updatedJun 1, 2023Dataset provided byPLOS ONEAuthorsYeshu Li; Ziming Qiu; Xingyu Fan; Xianglong Liu; Eric I-Chao Chang; Yan XuLicenseAttribution 4.0 (CC BY 4.0)https://creativecommons.org/licenses/by/4.0/
License information was derived automaticallyDescriptionMean results of the incremental experiment with our system.
Table S1 - Meta-Analysis for Genome-Wide Association Study Identifies...
- plos.figshare.com
xlsxUpdated Jun 1, 2023ShareFacebookTwitterEmailClick to copy linkLink copiedCiteXiaolan Hu; Eve Pickering; Yingxue Cathy Liu; Stephanie Hall; Helene Fournier; Elyse Katz; Bryan Dechairo; Sally John; Paul Van Eerdewegh; Holly Soares (2023). Table S1 - Meta-Analysis for Genome-Wide Association Study Identifies Multiple Variants at the BIN1 Locus Associated with Late-Onset Alzheimer's Disease [Dataset]. http://doi.org/10.1371/journal.pone.0016616.s001xlsxAvailable download formatsUnique identifierhttps://doi.org/10.1371/journal.pone.0016616.s001Dataset updatedJun 1, 2023AuthorsXiaolan Hu; Eve Pickering; Yingxue Cathy Liu; Stephanie Hall; Helene Fournier; Elyse Katz; Bryan Dechairo; Sally John; Paul Van Eerdewegh; Holly SoaresLicenseAttribution 4.0 (CC BY 4.0)https://creativecommons.org/licenses/by/4.0/
License information was derived automaticallyDescriptionSummary statistics for all markers in Pfizer sample set. Note: Large file (41MB). (XLSX)
- f
Variations in the FRA10AC1 Fragile Site and 15q21 Are Associated with...
- plos.figshare.com
docxUpdated May 31, 2023ShareFacebookTwitterEmailClick to copy linkLink copiedCiteQingqin S. Li; Antonio R. Parrado; Mahesh N. Samtani; Vaibhav A. Narayan (2023). Variations in the FRA10AC1 Fragile Site and 15q21 Are Associated with Cerebrospinal Fluid Aβ1-42 Level [Dataset]. http://doi.org/10.1371/journal.pone.0134000docxAvailable download formatsUnique identifierhttps://doi.org/10.1371/journal.pone.0134000Dataset updatedMay 31, 2023Dataset provided byPLOS ONEAuthorsQingqin S. Li; Antonio R. Parrado; Mahesh N. Samtani; Vaibhav A. NarayanLicenseAttribution 4.0 (CC BY 4.0)https://creativecommons.org/licenses/by/4.0/
License information was derived automaticallyDescriptionProteolytic fragments of amyloid and post-translational modification of tau species in Cerebrospinal fluid (CSF) as well as cerebral amyloid deposition are important biomarkers for Alzheimer’s Disease. We conducted genome-wide association study to identify genetic factors influencing CSF biomarker level, cerebral amyloid deposition, and disease progression. The genome-wide association study was performed via a meta-analysis of two non-overlapping discovery sample sets to identify genetic variants other than APOE ε4 predictive of the CSF biomarker level (Aβ1–42, t-Tau, p-Tau181P, t-Tau:Aβ1–42 ratio, and p-Tau181P:Aβ1–42 ratio) in patients enrolled in the Alzheimer’s Disease Neuroimaging Initiative (ADNI) study. Loci passing a genome-wide significance threshold of P < 5 x 10⁻⁸ were followed-up for replication in an independent sample set. We also performed joint meta-analysis of both discovery sample sets together with the replication sample set. In the discovery phase, we identified variants in FRA10AC1 associated with CSF Aβ1–42 level passing the genome-wide significance threshold (directly genotyped SNV rs10509663 PFE = 1.1 x 10⁻⁹, imputed SNV rs116953792 PFE = 3.5 x 10⁻¹⁰), rs116953792 (Pone-sided = 0.04) achieved replication. This association became stronger in the joint meta-analysis (directly genotyped SNV rs10509663 PFE = 1.7 x 10⁻⁹, imputed SNV rs116953792 PFE = 7.6 x 10⁻¹¹). Additionally, we identified locus 15q21 (imputed SNV rs1503351 PFE = 4.0 x 10⁻⁸) associated with CSF Aβ1–42 level. No other variants passed the genome-wide significance threshold for other CSF biomarkers in either the discovery sample sets or joint analysis. Gene set enrichment analyses suggested that targeted genes mediated by miR-33, miR-146, and miR-193 were enriched in various GWAS analyses. This finding is particularly important because CSF biomarkers confer disease susceptibility and may be predictive of the likelihood of disease progression in Alzheimer’s Disease.
Basic demographic information of the three ADNI CSF Sample Sets.
- plos.figshare.com
xlsUpdated Jun 6, 2023ShareFacebookTwitterEmailClick to copy linkLink copiedCiteQingqin S. Li; Antonio R. Parrado; Mahesh N. Samtani; Vaibhav A. Narayan (2023). Basic demographic information of the three ADNI CSF Sample Sets. [Dataset]. http://doi.org/10.1371/journal.pone.0134000.t001xlsAvailable download formatsUnique identifierhttps://doi.org/10.1371/journal.pone.0134000.t001Dataset updatedJun 6, 2023AuthorsQingqin S. Li; Antonio R. Parrado; Mahesh N. Samtani; Vaibhav A. NarayanLicenseAttribution 4.0 (CC BY 4.0)https://creativecommons.org/licenses/by/4.0/
License information was derived automaticallyDescriptionBasic demographic information of the three ADNI CSF Sample Sets.
- f
Two variants at the BIN1 locus are associated with Alzheimer's disease...
- plos.figshare.com
xlsUpdated Jun 3, 2023ShareFacebookTwitterEmailClick to copy linkLink copiedCiteXiaolan Hu; Eve Pickering; Yingxue Cathy Liu; Stephanie Hall; Helene Fournier; Elyse Katz; Bryan Dechairo; Sally John; Paul Van Eerdewegh; Holly Soares (2023). Two variants at the BIN1 locus are associated with Alzheimer's disease susceptibility below the genome-wide significance level with limited LD between them. [Dataset]. http://doi.org/10.1371/journal.pone.0016616.t003xlsAvailable download formatsUnique identifierhttps://doi.org/10.1371/journal.pone.0016616.t003Dataset updatedJun 3, 2023Dataset provided byPLOS ONEAuthorsXiaolan Hu; Eve Pickering; Yingxue Cathy Liu; Stephanie Hall; Helene Fournier; Elyse Katz; Bryan Dechairo; Sally John; Paul Van Eerdewegh; Holly SoaresLicenseAttribution 4.0 (CC BY 4.0)https://creativecommons.org/licenses/by/4.0/
License information was derived automaticallyDescriptionTwo variants at the BIN1 locus are associated with Alzheimer's disease susceptibility below the genome-wide significance level with limited LD between them.
- f
ADNI neuropsychological test clinical data summary showing average values...
- plos.figshare.com
xlsUpdated Apr 14, 2025ShareFacebookTwitterEmailClick to copy linkLink copiedCiteSherlyn Jemimah; Ferial Abuhantash; Aamna AlShehhi (2025). ADNI neuropsychological test clinical data summary showing average values with standard deviation. Statistical significance (95% significance level) was tested using analysis of Kruskal-Wallis test for all Neuropsychological test and other variables. [Dataset]. http://doi.org/10.1371/journal.pone.0320360.t002xlsAvailable download formatsUnique identifierhttps://doi.org/10.1371/journal.pone.0320360.t002Dataset updatedApr 14, 2025Dataset provided byPLOS ONEAuthorsSherlyn Jemimah; Ferial Abuhantash; Aamna AlShehhiLicenseAttribution 4.0 (CC BY 4.0)https://creativecommons.org/licenses/by/4.0/
License information was derived automaticallyDescriptionADNI neuropsychological test clinical data summary showing average values with standard deviation. Statistical significance (95% significance level) was tested using analysis of Kruskal-Wallis test for all Neuropsychological test and other variables.
- f
Mean volumes, standard deviations and detectability index Az of various...
- plos.figshare.com
xlsUpdated Jun 21, 2023ShareFacebookTwitterEmailClick to copy linkLink copiedCiteXiaoming Zheng; Justin Cawood; Chris Hayre; Shaoyu Wang (2023). Mean volumes, standard deviations and detectability index Az of various anatomical regions. [Dataset]. http://doi.org/10.1371/journal.pone.0279574.t002xlsAvailable download formatsUnique identifierhttps://doi.org/10.1371/journal.pone.0279574.t002Dataset updatedJun 21, 2023Dataset provided byPLOS ONEAuthorsXiaoming Zheng; Justin Cawood; Chris Hayre; Shaoyu WangLicenseAttribution 4.0 (CC BY 4.0)https://creativecommons.org/licenses/by/4.0/
License information was derived automaticallyDescriptionMean volumes, standard deviations and detectability index Az of various anatomical regions.
- f
ADNI clinical data summary showing average values with standard deviation....
- plos.figshare.com
xlsUpdated Apr 14, 2025ShareFacebookTwitterEmailClick to copy linkLink copiedCiteSherlyn Jemimah; Ferial Abuhantash; Aamna AlShehhi (2025). ADNI clinical data summary showing average values with standard deviation. Statistical significance (95% significance level) was tested using analysis of variance (ANOVA) for the age of onset and years of education, Chi-square contingency for gender proportions and APOE ϵ4 allele, and Kruskal-Wallis test for all other variables [Dataset]. http://doi.org/10.1371/journal.pone.0320360.t001xlsAvailable download formatsUnique identifierhttps://doi.org/10.1371/journal.pone.0320360.t001Dataset updatedApr 14, 2025Dataset provided byPLOS ONEAuthorsSherlyn Jemimah; Ferial Abuhantash; Aamna AlShehhiLicenseAttribution 4.0 (CC BY 4.0)https://creativecommons.org/licenses/by/4.0/
License information was derived automaticallyDescriptionADNI clinical data summary showing average values with standard deviation. Statistical significance (95% significance level) was tested using analysis of variance (ANOVA) for the age of onset and years of education, Chi-square contingency for gender proportions and APOE ϵ4 allele, and Kruskal-Wallis test for all other variables
- f
Top markers with P
- plos.figshare.com
xlsUpdated Jun 4, 2023ShareFacebookTwitterEmailClick to copy linkLink copiedCiteXiaolan Hu; Eve Pickering; Yingxue Cathy Liu; Stephanie Hall; Helene Fournier; Elyse Katz; Bryan Dechairo; Sally John; Paul Van Eerdewegh; Holly Soares (2023). Top markers with P [Dataset]. http://doi.org/10.1371/journal.pone.0016616.t001xlsAvailable download formatsUnique identifierhttps://doi.org/10.1371/journal.pone.0016616.t001Dataset updatedJun 4, 2023Dataset provided byPLOS ONEAuthorsXiaolan Hu; Eve Pickering; Yingxue Cathy Liu; Stephanie Hall; Helene Fournier; Elyse Katz; Bryan Dechairo; Sally John; Paul Van Eerdewegh; Holly SoaresLicenseAttribution 4.0 (CC BY 4.0)https://creativecommons.org/licenses/by/4.0/
License information was derived automaticallyDescriptionTop markers with P
Demographics for ADNI and BF2 cohorts. A mean and standard deviations are...
- plos.figshare.com
xlsUpdated Jul 21, 2025ShareFacebookTwitterEmailClick to copy linkLink copiedCitePavanjit Chaggar; Jacob Vogel; Alexa Pichet Binette; Travis B. Thompson; Olof Strandberg; Niklas Mattsson-Carlgren; Linda Karlsson; Erik Stomrud; Saad Jbabdi; Stefano Magon; Gregory Klein; Oskar Hansson; Alain Goriely (2025). Demographics for ADNI and BF2 cohorts. A mean and standard deviations are provided in centiloids. [Dataset]. http://doi.org/10.1371/journal.pbio.3003241.t003xlsAvailable download formatsUnique identifierhttps://doi.org/10.1371/journal.pbio.3003241.t003Dataset updatedJul 21, 2025AuthorsPavanjit Chaggar; Jacob Vogel; Alexa Pichet Binette; Travis B. Thompson; Olof Strandberg; Niklas Mattsson-Carlgren; Linda Karlsson; Erik Stomrud; Saad Jbabdi; Stefano Magon; Gregory Klein; Oskar Hansson; Alain GorielyLicenseAttribution 4.0 (CC BY 4.0)https://creativecommons.org/licenses/by/4.0/
License information was derived automaticallyDescriptionDemographics for ADNI and BF2 cohorts. A mean and standard deviations are provided in centiloids.
- f
Leave-One-Out cross-validation mean classification performance for AD versus...
- plos.figshare.com
xlsUpdated Jun 1, 2023ShareFacebookTwitterEmailClick to copy linkLink copiedCiteDuc Thanh Nguyen; Seungjun Ryu; Muhammad Naveed Iqbal Qureshi; Min Choi; Kun Ho Lee; Boreom Lee (2023). Leave-One-Out cross-validation mean classification performance for AD versus CN of multi-measure features at p-value = 0.05 with ADNI2 cohort. [Dataset]. http://doi.org/10.1371/journal.pone.0212582.t003xlsAvailable download formatsUnique identifierhttps://doi.org/10.1371/journal.pone.0212582.t003Dataset updatedJun 1, 2023Dataset provided byPLOS ONEAuthorsDuc Thanh Nguyen; Seungjun Ryu; Muhammad Naveed Iqbal Qureshi; Min Choi; Kun Ho Lee; Boreom LeeLicenseAttribution 4.0 (CC BY 4.0)https://creativecommons.org/licenses/by/4.0/
License information was derived automaticallyDescriptionLeave-One-Out cross-validation mean classification performance for AD versus CN of multi-measure features at p-value = 0.05 with ADNI2 cohort.
- f
Mean BrainAGE scores at baseline and last follow-up for all particular...
- plos.figshare.com
- figshare.com
xlsUpdated Jun 1, 2023ShareFacebookTwitterEmailClick to copy linkLink copiedCiteLuise Christine Löwe; Christian Gaser; Katja Franke (2023). Mean BrainAGE scores at baseline and last follow-up for all particular allelic isoforms within the diagnostic groups of the longitudinal sample. [Dataset]. http://doi.org/10.1371/journal.pone.0157514.t003xlsAvailable download formatsUnique identifierhttps://doi.org/10.1371/journal.pone.0157514.t003Dataset updatedJun 1, 2023Dataset provided byPLOS ONEAuthorsLuise Christine Löwe; Christian Gaser; Katja FrankeLicenseAttribution 4.0 (CC BY 4.0)https://creativecommons.org/licenses/by/4.0/
License information was derived automaticallyDescriptionMean BrainAGE scores at baseline and last follow-up for all particular allelic isoforms within the diagnostic groups of the longitudinal sample.
AD Progression Analysis for validated variants in AD susceptibilitya.
- plos.figshare.com
xlsUpdated May 31, 2023ShareFacebookTwitterEmailClick to copy linkLink copiedCiteXiaolan Hu; Eve Pickering; Yingxue Cathy Liu; Stephanie Hall; Helene Fournier; Elyse Katz; Bryan Dechairo; Sally John; Paul Van Eerdewegh; Holly Soares (2023). AD Progression Analysis for validated variants in AD susceptibilitya. [Dataset]. http://doi.org/10.1371/journal.pone.0016616.t005xlsAvailable download formatsUnique identifierhttps://doi.org/10.1371/journal.pone.0016616.t005Dataset updatedMay 31, 2023AuthorsXiaolan Hu; Eve Pickering; Yingxue Cathy Liu; Stephanie Hall; Helene Fournier; Elyse Katz; Bryan Dechairo; Sally John; Paul Van Eerdewegh; Holly SoaresLicenseAttribution 4.0 (CC BY 4.0)https://creativecommons.org/licenses/by/4.0/
License information was derived automaticallyDescriptionAD Progression Analysis for validated variants in AD susceptibilitya.
Pathway Analysis Results in Three Independent Sample setsa.
- plos.figshare.com
xlsUpdated Jun 1, 2023ShareFacebookTwitterEmailClick to copy linkLink copiedCiteXiaolan Hu; Eve Pickering; Yingxue Cathy Liu; Stephanie Hall; Helene Fournier; Elyse Katz; Bryan Dechairo; Sally John; Paul Van Eerdewegh; Holly Soares (2023). Pathway Analysis Results in Three Independent Sample setsa. [Dataset]. http://doi.org/10.1371/journal.pone.0016616.t004xlsAvailable download formatsUnique identifierhttps://doi.org/10.1371/journal.pone.0016616.t004Dataset updatedJun 1, 2023AuthorsXiaolan Hu; Eve Pickering; Yingxue Cathy Liu; Stephanie Hall; Helene Fournier; Elyse Katz; Bryan Dechairo; Sally John; Paul Van Eerdewegh; Holly SoaresLicenseAttribution 4.0 (CC BY 4.0)https://creativecommons.org/licenses/by/4.0/
License information was derived automaticallyDescriptionPathway Analysis Results in Three Independent Sample setsa.
FacebookTwitterResult of external validation using ADNI multimodal dataset in NC vs. MCI vs. AD classification (mean ± SD).
Attribution 4.0 (CC BY 4.0)https://creativecommons.org/licenses/by/4.0/
License information was derived automatically
Result of external validation using ADNI multimodal dataset in NC vs. MCI vs. AD classification (mean ± SD).