- n
AirNow Air Quality Monitoring Data (Current) - Dataset - CKAN
- nationaldataplatform.org
Updated Feb 28, 2024+ more versions Share
Share Facebook
 Twitter
 EmailClick to copy linkLink copiedCite(2024). AirNow Air Quality Monitoring Data (Current) - Dataset - CKAN [Dataset]. https://nationaldataplatform.org/catalog/dataset/airnow-air-quality-monitoring-data-currentDataset updatedFeb 28, 2024Description
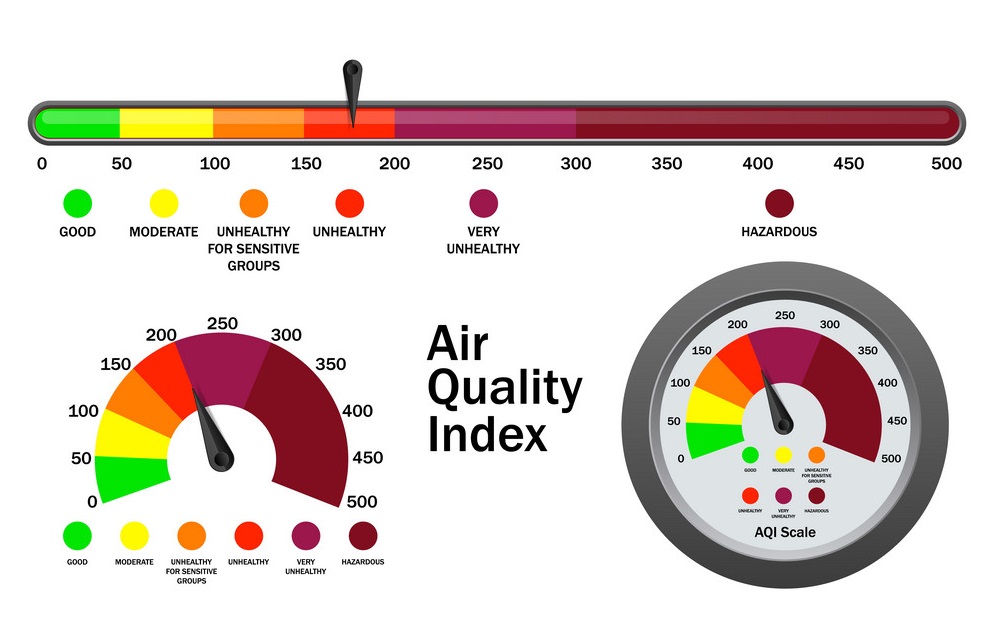
This United States Environmental Protection Agency (US EPA) feature layer represents monitoring site data, updated hourly concentrations and Air Quality Index (AQI) values for the latest hour received from monitoring sites that report to AirNow.Map and forecast data are collected using federal reference or equivalent monitoring techniques or techniques approved by the state, local or tribal monitoring agencies. To maintain "real-time" maps, the data are displayed after the end of each hour. Although preliminary data quality assessments are performed, the data in AirNow are not fully verified and validated through the quality assurance procedures monitoring organizations used to officially submit and certify data on the EPA Air Quality System (AQS).This data sharing, and centralization creates a one-stop source for real-time and forecast air quality data. The benefits include quality control, national reporting consistency, access to automated mapping methods, and data distribution to the public and other data systems. The U.S. Environmental Protection Agency, National Oceanic and Atmospheric Administration, National Park Service, tribal, state, and local agencies developed the AirNow system to provide the public with easy access to national air quality information. State and local agencies report the Air Quality Index (AQI) for cities across the US and parts of Canada and Mexico. AirNow data are used only to report the AQI, not to formulate or support regulation, guidance or any other EPA decision or position.About the AQIThe Air Quality Index (AQI) is an index for reporting daily air quality. It tells you how clean or polluted your air is, and what associated health effects might be a concern for you. The AQI focuses on health effects you may experience within a few hours or days after breathing polluted air. EPA calculates the AQI for five major air pollutants regulated by the Clean Air Act: ground-level ozone, particle pollution (also known as particulate matter), carbon monoxide, sulfur dioxide, and nitrogen dioxide. For each of these pollutants, EPA has established national air quality standards to protect public health. Ground-level ozone and airborne particles (often referred to as "particulate matter") are the two pollutants that pose the greatest threat to human health in this country.A number of factors influence ozone formation, including emissions from cars, trucks, buses, power plants, and industries, along with weather conditions. Weather is especially favorable for ozone formation when it’s hot, dry and sunny, and winds are calm and light. Federal and state regulations, including regulations for power plants, vehicles and fuels, are helping reduce ozone pollution nationwide.Fine particle pollution (or "particulate matter") can be emitted directly from cars, trucks, buses, power plants and industries, along with wildfires and woodstoves. But it also forms from chemical reactions of other pollutants in the air. Particle pollution can be high at different times of year, depending on where you live. In some areas, for example, colder winters can lead to increased particle pollution emissions from woodstove use, and stagnant weather conditions with calm and light winds can trap PM2.5 pollution near emission sources. Federal and state rules are helping reduce fine particle pollution, including clean diesel rules for vehicles and fuels, and rules to reduce pollution from power plants, industries, locomotives, and marine vessels, among others.How Does the AQI Work?Think of the AQI as a yardstick that runs from 0 to 500. The higher the AQI value, the greater the level of air pollution and the greater the health concern. For example, an AQI value of 50 represents good air quality with little potential to affect public health, while an AQI value over 300 represents hazardous air quality.An AQI value of 100 generally corresponds to the national air quality standard for the pollutant, which is the level EPA has set to protect public health. AQI values below 100 are generally thought of as satisfactory. When AQI values are above 100, air quality is considered to be unhealthy-at first for certain sensitive groups of people, then for everyone as AQI values get higher.Understanding the AQIThe purpose of the AQI is to help you understand what local air quality means to your health. To make it easier to understand, the AQI is divided into six categories:Air Quality Index(AQI) ValuesLevels of Health ConcernColorsWhen the AQI is in this range:..air quality conditions are:...as symbolized by this color:0 to 50GoodGreen51 to 100ModerateYellow101 to 150Unhealthy for Sensitive GroupsOrange151 to 200UnhealthyRed201 to 300Very UnhealthyPurple301 to 500HazardousMaroonNote: Values above 500 are considered Beyond the AQI. Follow recommendations for the Hazardous category. Additional information on reducing exposure to extremely high levels of particle pollution is available here.Each category corresponds to a different level of health concern. The six levels of health concern and what they mean are:"Good" AQI is 0 to 50. Air quality is considered satisfactory, and air pollution poses little or no risk."Moderate" AQI is 51 to 100. Air quality is acceptable; however, for some pollutants there may be a moderate health concern for a very small number of people. For example, people who are unusually sensitive to ozone may experience respiratory symptoms."Unhealthy for Sensitive Groups" AQI is 101 to 150. Although general public is not likely to be affected at this AQI range, people with lung disease, older adults and children are at a greater risk from exposure to ozone, whereas persons with heart and lung disease, older adults and children are at greater risk from the presence of particles in the air."Unhealthy" AQI is 151 to 200. Everyone may begin to experience some adverse health effects, and members of the sensitive groups may experience more serious effects."Very Unhealthy" AQI is 201 to 300. This would trigger a health alert signifying that everyone may experience more serious health effects."Hazardous" AQI greater than 300. This would trigger a health warnings of emergency conditions. The entire population is more likely to be affected.AQI colorsEPA has assigned a specific color to each AQI category to make it easier for people to understand quickly whether air pollution is reaching unhealthy levels in their communities. For example, the color orange means that conditions are "unhealthy for sensitive groups," while red means that conditions may be "unhealthy for everyone," and so on.Air Quality Index Levels of Health ConcernNumericalValueMeaningGood0 to 50Air quality is considered satisfactory, and air pollution poses little or no risk.Moderate51 to 100Air quality is acceptable; however, for some pollutants there may be a moderate health concern for a very small number of people who are unusually sensitive to air pollution.Unhealthy for Sensitive Groups101 to 150Members of sensitive groups may experience health effects. The general public is not likely to be affected.Unhealthy151 to 200Everyone may begin to experience health effects; members of sensitive groups may experience more serious health effects.Very Unhealthy201 to 300Health alert: everyone may experience more serious health effects.Hazardous301 to 500Health warnings of emergency conditions. The entire population is more likely to be affected.Note: Values above 500 are considered Beyond the AQI. Follow recommendations for the "Hazardous category." Additional information on reducing exposure to extremely high levels of particle pollution is available here.
Historical Air Quality
- kaggle.com
zipUpdated Feb 12, 2019ShareFacebookTwitterEmailClick to copy linkLink copiedCiteUS Environmental Protection Agency (2019). Historical Air Quality [Dataset]. https://www.kaggle.com/datasets/epa/epa-historical-air-qualityzip(0 bytes)Available download formatsDataset updatedFeb 12, 2019AuthorsUS Environmental Protection AgencyLicensehttps://creativecommons.org/publicdomain/zero/1.0/https://creativecommons.org/publicdomain/zero/1.0/
DescriptionThe AQS Data Mart is a database containing all of the information from AQS. It has every measured value the EPA has collected via the national ambient air monitoring program. It also includes the associated aggregate values calculated by EPA (8-hour, daily, annual, etc.). The AQS Data Mart is a copy of AQS made once per week and made accessible to the public through web-based applications. The intended users of the Data Mart are air quality data analysts in the regulatory, academic, and health research communities. It is intended for those who need to download large volumes of detailed technical data stored at EPA and does not provide any interactive analytical tools. It serves as the back-end database for several Agency interactive tools that could not fully function without it: AirData, AirCompare, The Remote Sensing Information Gateway, the Map Monitoring Sites KML page, etc.
AQS must maintain constant readiness to accept data and meet high data integrity requirements, thus is limited in the number of users and queries to which it can respond. The Data Mart, as a read only copy, can allow wider access.
The most commonly requested aggregation levels of data (and key metrics in each) are:
Sample Values (2.4 billion values back as far as 1957, national consistency begins in 1980, data for 500 substances routinely collected) The sample value converted to standard units of measure (generally 1-hour averages as reported to EPA, sometimes 24-hour averages) Local Standard Time (LST) and GMT timestamps Measurement method Measurement uncertainty, where known Any exceptional events affecting the data NAAQS Averages NAAQS average values (8-hour averages for ozone and CO, 24-hour averages for PM2.5) Daily Summary Values (each monitor has the following calculated each day) Observation count Observation per cent (of expected observations) Arithmetic mean of observations Max observation and time of max AQI (air quality index) where applicable Number of observations > Standard where applicable Annual Summary Values (each monitor has the following calculated each year) Observation count and per cent Valid days Required observation count Null observation count Exceptional values count Arithmetic Mean and Standard Deviation 1st - 4th maximum (highest) observations Percentiles (99, 98, 95, 90, 75, 50) Number of observations > Standard Site and Monitor Information FIPS State Code (the first 5 items on this list make up the AQS Monitor Identifier) FIPS County Code Site Number (unique within the county) Parameter Code (what is measured) POC (Parameter Occurrence Code) to distinguish from different samplers at the same site Latitude Longitude Measurement method information Owner / operator / data-submitter information Monitoring Network to which the monitor belongs Exemptions from regulatory requirements Operational dates City and CBSA where the monitor is located Quality Assurance Information Various data fields related to the 19 different QA assessments possible
Querying BigQuery tables
You can use the BigQuery Python client library to query tables in this dataset in Kernels. Note that methods available in Kernels are limited to querying data. Tables are at
bigquery-public-data.epa_historical_air_quality.[TABLENAME]. Fork this kernel to get started.Acknowledgements
Data provided by the US Environmental Protection Agency Air Quality System Data Mart.
- d
Air Quality Index (AQI) (historical data)
- data.gov.tw
ShareFacebookTwitterEmailClick to copy linkLink copiedCiteMinistry of Environment, Air Quality Index (AQI) (historical data) [Dataset]. https://data.gov.tw/en/datasets/151824Dataset authored and provided byMinistry of EnvironmentLicensehttps://data.gov.tw/licensehttps://data.gov.tw/license
DescriptionProvide the air quality index (AQI) for each station per hour.
AQI - Air Quality Index
- kaggle.com
zipUpdated Feb 26, 2026ShareFacebookTwitterEmailClick to copy linkLink copiedCiteAzmine Toushik Wasi (2026). AQI - Air Quality Index [Dataset]. https://www.kaggle.com/datasets/azminetoushikwasi/aqi-air-quality-index-scheduled-daily-updatezip(108409 bytes)Available download formatsDataset updatedFeb 26, 2026AuthorsAzmine Toushik WasiLicenseOpen Database License (ODbL) v1.0https://www.opendatacommons.org/licenses/odbl/1.0/
License information was derived automaticallyDescriptionContext
This dataset contains Air Quality Index of most the countries of the world.
Challenges
- Time Series Analysis and Prediction
- Seasonality finding
- Geospatial Analysis
About Air Quality Index (AQI
The Air Quality Index (AQI) is used for reporting daily air quality. It tells you how clean or polluted your air is, and what associated health effects might be a concern for you. The AQI focuses on health effects you may experience within a few hours or days after breathing polluted air.
Content
- data_date.csv - date wise organised
Related Notebooks
Download
- kaggle API Command
!kaggle datasets download -d azminetoushikwasi/aqi-air-quality-index-scheduled-daily-update
Disclaimer
- The data collected are all publicly available and it's intended for educational purposes only.
Acknowledgement
- Cover image taken from internet.
Appreciate, Support, Share
- p
U.S. Air Quality Index Data by County and Metro
- plainairdata.com
htmlUpdated Mar 23, 2026ShareFacebookTwitterEmailClick to copy linkLink copiedCitePlainAir (2026). U.S. Air Quality Index Data by County and Metro [Dataset]. https://plainairdata.comhtmlAvailable download formatsDataset updatedMar 23, 2026Dataset authored and provided byPlainAirLicenseCC0 1.0 Universal Public Domain Dedicationhttps://creativecommons.org/publicdomain/zero/1.0/
License information was derived automaticallyTime period covered2020 - 2024Area coveredUnited StatesDescriptionEPA Air Quality System annual AQI data for 995 counties, 501 metros, and 53 states covering 2020-2024.
AirNow Air Quality Monitoring Site Data (Last 24 hours)
- gis-fema.hub.arcgis.com
- hub.arcgis.com
Updated Nov 21, 2018+ more versionsShareFacebookTwitterEmailClick to copy linkLink copiedCiteU.S. EPA (2018). AirNow Air Quality Monitoring Site Data (Last 24 hours) [Dataset]. https://gis-fema.hub.arcgis.com/datasets/394b9bf591e14596bb57b9085b425f7dDataset updatedNov 21, 2018AuthorsU.S. EPAArea coveredDescriptionThis United States Environmental Protection Agency (US EPA) feature layer represents site data, updated hourly concentrations and Air Quality Index (AQI) values for the last 24 hours received from each monitoring site that reports to AirNow. NOTE: Time Animation is enabled by default on this layer.Map and forecast data are collected using federal reference or equivalent monitoring techniques or techniques approved by the state, local or tribal monitoring agencies. To maintain "real-time" maps, the data are displayed after the end of each hour. Although preliminary data quality assessments are performed, the data in AirNow are not fully verified and validated through the quality assurance procedures monitoring organizations used to officially submit and certify data on the EPA Air Quality System (AQS).This data sharing, and centralization creates a one-stop source for real-time and forecast air quality data. The benefits include quality control, national reporting consistency, access to automated mapping methods, and data distribution to the public and other data systems. The U.S. Environmental Protection Agency, National Oceanic and Atmospheric Administration, National Park Service, tribal, state, and local agencies developed the AirNow system to provide the public with easy access to national air quality information. State and local agencies report the Air Quality Index (AQI) for cities across the US and parts of Canada and Mexico. AirNow data are used only to report the AQI, not to formulate or support regulation, guidance or any other EPA decision or position.About the AQIThe Air Quality Index (AQI) is an index for reporting daily air quality. It tells you how clean or polluted your air is, and what associated health effects might be a concern for you. The AQI focuses on health effects you may experience within a few hours or days after breathing polluted air. EPA calculates the AQI for five major air pollutants regulated by the Clean Air Act: ground-level ozone, particle pollution (also known as particulate matter), carbon monoxide, sulfur dioxide, and nitrogen dioxide. For each of these pollutants, EPA has established national air quality standards to protect public health. Ground-level ozone and airborne particles (often referred to as "particulate matter") are the two pollutants that pose the greatest threat to human health in this country.A number of factors influence ozone formation, including emissions from cars, trucks, buses, power plants, and industries, along with weather conditions. Weather is especially favorable for ozone formation when it’s hot, dry and sunny, and winds are calm and light. Federal and state regulations, including regulations for power plants, vehicles and fuels, are helping reduce ozone pollution nationwide.Fine particle pollution (or "particulate matter") can be emitted directly from cars, trucks, buses, power plants and industries, along with wildfires and woodstoves. But it also forms from chemical reactions of other pollutants in the air. Particle pollution can be high at different times of year, depending on where you live. In some areas, for example, colder winters can lead to increased particle pollution emissions from woodstove use, and stagnant weather conditions with calm and light winds can trap PM2.5 pollution near emission sources. Federal and state rules are helping reduce fine particle pollution, including clean diesel rules for vehicles and fuels, and rules to reduce pollution from power plants, industries, locomotives, and marine vessels, among others.How Does the AQI Work?Think of the AQI as a yardstick that runs from 0 to 500. The higher the AQI value, the greater the level of air pollution and the greater the health concern. For example, an AQI value of 50 represents good air quality with little potential to affect public health, while an AQI value over 300 represents hazardous air quality.An AQI value of 100 generally corresponds to the national air quality standard for the pollutant, which is the level EPA has set to protect public health. AQI values below 100 are generally thought of as satisfactory. When AQI values are above 100, air quality is considered to be unhealthy-at first for certain sensitive groups of people, then for everyone as AQI values get higher.Understanding the AQIThe purpose of the AQI is to help you understand what local air quality means to your health. To make it easier to understand, the AQI is divided into six categories:Air Quality Index(AQI) ValuesLevels of Health ConcernColorsWhen the AQI is in this range:..air quality conditions are:...as symbolized by this color:0 to 50GoodGreen51 to 100ModerateYellow101 to 150Unhealthy for Sensitive GroupsOrange151 to 200UnhealthyRed201 to 300Very UnhealthyPurple301 to 500HazardousMaroonNote: Values above 500 are considered Beyond the AQI. Follow recommendations for the Hazardous category. Additional information on reducing exposure to extremely high levels of particle pollution is available here.Each category corresponds to a different level of health concern. The six levels of health concern and what they mean are:"Good" AQI is 0 to 50. Air quality is considered satisfactory, and air pollution poses little or no risk."Moderate" AQI is 51 to 100. Air quality is acceptable; however, for some pollutants there may be a moderate health concern for a very small number of people. For example, people who are unusually sensitive to ozone may experience respiratory symptoms."Unhealthy for Sensitive Groups" AQI is 101 to 150. Although general public is not likely to be affected at this AQI range, people with lung disease, older adults and children are at a greater risk from exposure to ozone, whereas persons with heart and lung disease, older adults and children are at greater risk from the presence of particles in the air."Unhealthy" AQI is 151 to 200. Everyone may begin to experience some adverse health effects, and members of the sensitive groups may experience more serious effects."Very Unhealthy" AQI is 201 to 300. This would trigger a health alert signifying that everyone may experience more serious health effects."Hazardous" AQI greater than 300. This would trigger a health warnings of emergency conditions. The entire population is more likely to be affected.AQI colorsEPA has assigned a specific color to each AQI category to make it easier for people to understand quickly whether air pollution is reaching unhealthy levels in their communities. For example, the color orange means that conditions are "unhealthy for sensitive groups," while red means that conditions may be "unhealthy for everyone," and so on.Air Quality Index Levels of Health ConcernNumericalValueMeaningGood0 to 50Air quality is considered satisfactory, and air pollution poses little or no risk.Moderate51 to 100Air quality is acceptable; however, for some pollutants there may be a moderate health concern for a very small number of people who are unusually sensitive to air pollution.Unhealthy for Sensitive Groups101 to 150Members of sensitive groups may experience health effects. The general public is not likely to be affected.Unhealthy151 to 200Everyone may begin to experience health effects; members of sensitive groups may experience more serious health effects.Very Unhealthy201 to 300Health alert: everyone may experience more serious health effects.Hazardous301 to 500Health warnings of emergency conditions. The entire population is more likely to be affected.Note: Values above 500 are considered Beyond the AQI. Follow recommendations for the "Hazardous category." Additional information on reducing exposure to extremely high levels of particle pollution is available here.
- d
Louisville Metro KY - Local Air Quality API
- catalog.data.gov
- gimi9.com
- +2more
Updated Apr 13, 2023ShareFacebookTwitterEmailClick to copy linkLink copiedCiteLouisville/Jefferson County Information Consortium (2023). Louisville Metro KY - Local Air Quality API [Dataset]. https://catalog.data.gov/dataset/louisville-metro-ky-local-air-quality-apiDataset updatedApr 13, 2023Dataset provided byLouisville/Jefferson County Information ConsortiumArea coveredLouisville, KentuckyDescriptionAPI operated by Louisville Metro that returns AQI information from local sensors operated by APCD. Shows the latest hourly data in a JSON feed. The Air Quality Index (AQI) is an easy way to tell you about air quality without having to know a lot of technical details. The “Metropolitan Air Quality Index” shows the AQI from the monitor in Kentuckiana that is currently detecting the highest level of air pollution. See: https://louisvilleky.gov/government/air-pollution-control-district/servi... See the air quality map (Louisville Air Watch) for more details: airqualitymap.louisvilleky.gov/# Read the FAQ for more information about the AQI data: https://louisvilleky.gov/government/air-pollution-control-district/louis... If you'd prefer air quality forecast data (raw data, maps, API) instead, please see AIRNow: https://www.airnow.gov/index.cfm?action=airnow.local_city&zipcode=40204&... See the Data Dictionary section below for information about what the AQI numbers mean, their corresponding colors, recommendations, and more info and links. To download daily snapshots of AQI for the last 25 years, visit the EPA website, set your year range, and choose, Louisville KY. Then download with the CSV link at the bottom of the page. IFTTT integration trigger that fires and after retrieving air quality from Louisville Metro air sensors via the API Gives a forecast instead of the current conditions, so you can take action before the air quality gets bad. The U.S. EPA AirNow program (www.AirNow.gov) protects public health by providing forecast and real-time observed air quality information across the United States, Canada, and Mexico. AirNow receives real-time air quality observations from over 2,000 monitoring stations and collects forecasts for more than 300 cities. Sign up for a free account and get started using the RSS data feed for Louisville. https://docs.airnowapi.org/feeds Air Quality Forecast via AirNow AQI Level - Value and Related Health Concerns Legend Good 0-50 Green Air quality is considered satisfactory, and air pollution poses little or no risk. Moderate 51-100 Yellow Air quality is acceptable; however, for some pollutants there may be a moderate health concern for a very small number of people who are unusually sensitive to air pollution. Unhealthy for Sensitive Groups 101-150 Orange Members of sensitive groups may experience health effects. The general public is not likely to be affected. Unhealthy 151-200 Red Everyone may begin to experience health effects; members of sensitive groups may experience more serious health effects. Very Unhealthy 201-300 Purple Health alert: everyone may experience more serious health effects. Hazardous > 300 Dark Purple Health warnings of emergency conditions. The entire population is more likely to be affected. Here are citizen actions APCD recommends on air quality alert days, that is, days when the forecast is for the air quality to reach or exceed the “unhealthy for sensitive groups” (orange) level: Don’t idle your car. (Recommended all the time; see the second link below.)Put off mowing grass with a gas mower until the alert ends.“Refuel when it’s cool” (pump gasoline only in the evening or night).Avoid driving if possible. Share rides or take TARC.Check on neighbors with breathing problems. Here are some links in relation to the recommendations: KAIRE, www.helptheair.org/ Idle Free Louisville, www.helptheair.org/idle-free TARC Ticket to Ride, tickettoride.org/ Lawn Care for Cleaner Air (rebates) Contact: Bryan Frazer Bryan.Frazar@louisvilleky.gov
- d
Data from: Air Quality Index (AQI)
- data.gov.tw
Updated Jun 13, 2024ShareFacebookTwitterEmailClick to copy linkLink copiedCiteMinistry of Environment (2024). Air Quality Index (AQI) [Dataset]. https://data.gov.tw/en/datasets/40448Dataset updatedJun 13, 2024Dataset authored and provided byMinistry of EnvironmentLicensehttps://data.gov.tw/licensehttps://data.gov.tw/license
DescriptionThe Air Quality Index (AQI) for each monitoring station is provided hourly. The original data version is announced on the Air Quality Monitoring Network website https://airtw.moenv.gov.tw
Taiwan Air Quality Index Data 2016~2024
- kaggle.com
zipUpdated Sep 14, 2024ShareFacebookTwitterEmailClick to copy linkLink copiedCiteTa-wei Lo (2024). Taiwan Air Quality Index Data 2016~2024 [Dataset]. https://www.kaggle.com/datasets/taweilo/taiwan-air-quality-data-20162024zip(180214746 bytes)Available download formatsDataset updatedSep 14, 2024AuthorsTa-wei LoLicensehttps://creativecommons.org/publicdomain/zero/1.0/https://creativecommons.org/publicdomain/zero/1.0/
Area coveredTaiwanDescription1) AQI and Pollutants
The Air Quality Index (AQI) is a standardized indicator used to measure air quality in relation to various pollutants. The AQI levels range from 0 to 500, with higher values indicating worse air quality and potential health risks. The pollutants tracked in this dataset include:
- PM2.5: Fine particulate matter with a diameter of less than 2.5 micrometers. These particles are capable of penetrating deep into the lungs and bloodstream, causing respiratory and cardiovascular issues.
- PM10: Particulate matter with a diameter less than 10 micrometers. These particles can cause respiratory irritation but are not as invasive as PM2.5.
- SO2: Sulfur Dioxide is a toxic gas produced primarily by fossil fuel combustion, which can lead to respiratory problems.
- NOx: A group of nitrogen oxides (including NO2 and NO) generated by combustion engines, contributing to smog and acid rain.
- CO: Carbon Monoxide is a colorless, odorless gas that can be harmful when inhaled in large amounts. It primarily originates from vehicle emissions and other combustion sources.
- O3: Ozone is a gas that forms in the atmosphere and is harmful at ground level. It’s a major component of smog and can cause respiratory issues.
2) Metadata
Column Description Data Type date Date and time of the reading Text sitename Station name Text county County or city Text aqi Air Quality Index Numeric pollutant Main pollutant Text status Status of air quality Text so2 Sulfur Dioxide in ppb Numeric co Carbon Monoxide in ppm Numeric o3 Ozone in ppb Numeric o3_8hr 8-hour average of Ozone Numeric pm10 Particulate matter under 10μm Numeric pm2.5 Particulate matter under 2.5μm Numeric no2 Nitrogen Dioxide in ppb Numeric nox Nitrogen Oxides in ppb Numeric no Nitric Oxide in ppb Numeric windspeed Wind speed in m/sec Numeric winddirec Wind direction in degrees Numeric unit Unit of measurement Text co_8hr 8-hour average of CO Numeric pm2.5_avg Moving average of PM2.5 Numeric pm10_avg Moving average of PM10 Numeric so2_avg Moving average of SO2 Numeric longitude Longitude of the site Numeric latitude Latitude of the site Numeric siteid Station ID Numeric 3) Data Value
This dataset analyzes air quality trends and relationships between various pollutants. Here are a few potential uses:
Regression Analysis: You can use regression techniques to predict AQI based on levels of specific pollutants like PM2.5, CO, and SO2. By treating AQI as the target variable(Remove Status column), you can build models to predict how pollutant concentrations impact air quality.
Time Series Forecasting: Using the date field, you can perform time series analysis to forecast future air quality levels based on historical pollutant concentrations, wind speed, and direction.
Spatial Analysis: Given the latitude and longitude columns (Country), you can visualize spatial trends in air quality, possibly identifying regions with consistently poor or good air quality.
Feel free to leave comments on the discussion. I'd appreciate your upvote if you find my dataset useful! 😀
- d
Data from: Air Quality Index (AQI)
- data.gov.tw
Updated Apr 8, 2024ShareFacebookTwitterEmailClick to copy linkLink copiedCiteMinistry of Environment (2024). Air Quality Index (AQI) [Dataset]. https://data.gov.tw/en/datasets/40507Dataset updatedApr 8, 2024Dataset authored and provided byMinistry of EnvironmentLicensehttps://data.gov.tw/licensehttps://data.gov.tw/license
DescriptionThe Ministry of the Environment publishes the daily AQI calculated from the hourly measurements of the air quality monitoring stations.
Air Quality Health Index Forecasts
- open.canada.ca
csv, html, jsonUpdated Oct 7, 2025+ more versionsShareFacebookTwitterEmailClick to copy linkLink copiedCiteEnvironment and Climate Change Canada (2025). Air Quality Health Index Forecasts [Dataset]. https://open.canada.ca/data/en/dataset/a563e47d-6eb9-4f7f-933c-222ae49fe57fjson, html, csvAvailable download formatsDataset updatedOct 7, 2025Dataset provided byEnvironment And Climate Change Canadahttps://www.canada.ca/en/environment-climate-change.htmlLicenseOpen Government Licence - Canada 2.0https://open.canada.ca/en/open-government-licence-canada
License information was derived automaticallyDescriptionThe Air Quality Health Index (AQHI) is a scale designed to help quantify the quality of the air in a certain region on a scale from 1 to 10. When the amount of air pollution is very high, the number is reported as 10+. It also includes a category that describes the health risk associated with the index reading (e.g. Low, Moderate, High, or Very High Health Risk). The AQHI is calculated based on the relative risks of a combination of common air pollutants that are known to harm human health, including ground-level ozone, particulate matter, and nitrogen dioxide. The AQHI formulation captures only the short term or acute health risk (exposure of hour or days at a maximum). The formulation of the AQHI may change over time to reflect new understanding associated with air pollution health effects. The AQHI is calculated from data observed in real time, without being verified (quality control).
Data from: Air Quality Data
- kaggle.com
zipUpdated Mar 25, 2025ShareFacebookTwitterEmailClick to copy linkLink copiedCiteKhushi Yadav (2025). Air Quality Data [Dataset]. https://www.kaggle.com/datasets/khushikyad001/air-quality-datazip(718396 bytes)Available download formatsDataset updatedMar 25, 2025AuthorsKhushi YadavLicenseMIT Licensehttps://opensource.org/licenses/MIT
License information was derived automaticallyDescriptionThis image visually represents air quality data, including key pollutants such as CO, NOx, NO₂, O₃, SO₂, PM2.5, and PM10. It features an Air Quality Index (AQI) gauge, indicating the pollution level from good (green) to hazardous (red). The background showcases an urban cityscape, highlighting the impact of air pollution. Additional graphical elements like bar charts, clouds, and weather indicators (temperature, humidity, and wind speed) make this an informative and data-driven visualization for environmental monitoring and analysis.
Ideal for use as a header image in reports, dashboards, or presentations related to air quality prediction, pollution control, and environmental research. 🚀🌍💨
- C
Air Quality
- data.ccrpc.org
csvUpdated Jun 13, 2025ShareFacebookTwitterEmailClick to copy linkLink copiedCiteChampaign County Regional Planning Commission (2025). Air Quality [Dataset]. https://data.ccrpc.org/dataset/air-qualitycsvAvailable download formatsDataset updatedJun 13, 2025Dataset authored and provided byChampaign County Regional Planning CommissionLicenseOpen Database License (ODbL) v1.0https://www.opendatacommons.org/licenses/odbl/1.0/
License information was derived automaticallyDescriptionThis indicator shows how many days per year were assessed to have air quality that was worse than “moderate” in Champaign County, according to the U.S. Environmental Protection Agency’s (U.S. EPA) Air Quality Index Reports. The period of analysis is 1980-2024, and the U.S. EPA’s air quality ratings analyzed here are as follows, from best to worst: “good,” “moderate,” “unhealthy for sensitive groups,” “unhealthy,” “very unhealthy,” and "hazardous."[1]
In 2024, the number of days rated to have air quality worse than moderate was 0. This is a significant decrease from the 13 days in 2023 in the same category, the highest in the 21st century. That figure is likely due to the air pollution created by the unprecedented Canadian wildfire smoke in Summer 2023.
While there has been no consistent year-to-year trend in the number of days per year rated to have air quality worse than moderate, the number of days in peak years had decreased from 2000 through 2022. Where peak years before 2000 had between one and two dozen days with air quality worse than moderate (e.g., 1983, 18 days; 1988, 23 days; 1994, 17 days; 1999, 24 days), the year with the greatest number of days with air quality worse than moderate from 2000-2022 was 2002, with 10 days. There were several years between 2006 and 2022 that had no days with air quality worse than moderate.
This data is sourced from the U.S. EPA’s Air Quality Index Reports. The reports are released annually, and our period of analysis is 1980-2024. The Air Quality Index Report websites does caution that "[a]ir pollution levels measured at a particular monitoring site are not necessarily representative of the air quality for an entire county or urban area," and recommends that data users do not compare air quality between different locations[2].
[1] Environmental Protection Agency. (1980-2024). Air Quality Index Reports. (Accessed 13 June 2025).
[2] Ibid.
Source: Environmental Protection Agency. (1980-2024). Air Quality Index Reports. https://www.epa.gov/outdoor-air-quality-data/air-quality-index-report. (Accessed 13 June 2025).
- U
United States AQI: Colorado: Denver-Aurora-Lakewood: CO
- ceicdata.com
Updated Nov 11, 2022ShareFacebookTwitterEmailClick to copy linkLink copiedCiteCEICdata.com (2022). United States AQI: Colorado: Denver-Aurora-Lakewood: CO [Dataset]. https://www.ceicdata.com/en/united-states/air-quality-index-and-air-pollutantsDataset updatedNov 11, 2022Dataset provided byCEICdata.comLicenseAttribution 4.0 (CC BY 4.0)https://creativecommons.org/licenses/by/4.0/
License information was derived automaticallyTime period coveredDec 20, 2024 - Dec 31, 2024Area coveredUnited StatesDescriptionAQI: Colorado: Denver-Aurora-Lakewood: CO data was reported at 6.000 Index in 01 Apr 2025. This records a decrease from the previous number of 7.000 Index for 31 Mar 2025. AQI: Colorado: Denver-Aurora-Lakewood: CO data is updated daily, averaging 7.000 Index from Jan 1980 (Median) to 01 Apr 2025, with 16472 observations. The data reached an all-time high of 42.000 Index in 09 Jan 2018 and a record low of 2.000 Index in 07 Apr 2024. AQI: Colorado: Denver-Aurora-Lakewood: CO data remains active status in CEIC and is reported by United States Environmental Protection Agency. The data is categorized under Global Database’s United States – Table US.ESG.E001: Air Quality Index and Air Pollutants. [COVID-19-IMPACT]
Global Urban Air Quality Index Dataset (2015-2025)
- kaggle.com
zipUpdated Feb 16, 2025ShareFacebookTwitterEmailClick to copy linkLink copiedCiteSyed M Talha Hasan (2025). Global Urban Air Quality Index Dataset (2015-2025) [Dataset]. https://www.kaggle.com/datasets/syedmtalhahasan/global-urban-air-quality-index-dataset-2015-2025zip(87160 bytes)Available download formatsDataset updatedFeb 16, 2025AuthorsSyed M Talha HasanLicenseAttribution 4.0 (CC BY 4.0)https://creativecommons.org/licenses/by/4.0/
License information was derived automaticallyDescriptionThis dataset provides air quality index (AQI) data from major cities worldwide, covering the years 2015 to 2025. It is compiled from various sources, including government monitoring stations, environmental agencies, and open APIs.
The dataset includes daily AQI values along with major pollutants such as PM2.5, PM10, NO2, SO2, CO, and O3. Additional meteorological data such as temperature, humidity, and wind speed are also included to support deeper analysis.
Dataset Features: Date: The date of AQI measurement (YYYY-MM-DD). City: Name of the city where the AQI is recorded. Country: Country of the city. AQI: The daily air quality index value. PM2.5 (µg/m³): Fine particulate matter concentration. PM10 (µg/m³): Larger particulate matter concentration. NO2 (ppb): Nitrogen dioxide concentration. SO2 (ppb): Sulfur dioxide concentration. CO (ppm): Carbon monoxide concentration. O3 (ppb): Ozone concentration. Temperature (°C): Daily average temperature. Humidity (%): Daily average humidity. Wind Speed (m/s): Daily average wind speed. Potential Use Cases: ✅ Data Science & Machine Learning: Predict air quality trends, create AQI forecasting models, and build environmental monitoring applications. ✅ Health & Epidemiology: Analyze correlations between air pollution and respiratory diseases, cardiovascular conditions, and general health. ✅ Climate & Environmental Research: Study pollution patterns, seasonal variations, and their relation to climate change. ✅ Urban Planning & Policy Making: Help city planners implement better pollution control strategies.
Why This Dataset? 📌 10-year coverage (2015-2025) for long-term trend analysis. 📌 Global scope with diverse geographical representation. 📌 Multiple pollutants & weather data for comprehensive insights. 📌 Ready-to-use for ML models, EDA, and research.
Air Quality Measures on the National Environmental Health Tracking Network
- catalog.data.gov
Updated Jun 28, 2025ShareFacebookTwitterEmailClick to copy linkLink copiedCiteCenters for Disease Control and Prevention (2025). Air Quality Measures on the National Environmental Health Tracking Network [Dataset]. https://catalog.data.gov/dataset/air-quality-measures-on-the-national-environmental-health-tracking-networkDataset updatedJun 28, 2025DescriptionThe Environmental Protection Agency (EPA) provides air pollution data about ozone and particulate matter (PM2.5) to CDC for the Tracking Network. The EPA maintains a database called the Air Quality System (AQS) which contains data from approximately 4,000 monitoring stations around the country, mainly in urban areas. Data from the AQS is considered the "gold standard" for determining outdoor air pollution. However, AQS data are limited because the monitoring stations are usually in urban areas or cities and because they only take air samples for some air pollutants every three days or during times of the year when air pollution is very high. CDC and EPA have worked together to develop a statistical model (Downscaler) to make modeled predictions available for environmental public health tracking purposes in areas of the country that do not have monitors and to fill in the time gaps when monitors may not be recording data. This data does not include "Percent of population in counties exceeding NAAQS (vs. population in counties that either meet the standard or do not monitor PM2.5)". Please visit the Tracking homepage for this information.View additional information for indicator definitions and documentation by selecting Content Area "Air Quality" and the respective indicator at the following website: http://ephtracking.cdc.gov/showIndicatorsData.action
Air Quality Index Report - City wise(Virginia) (2024)
- data.virginia.gov
- data.vi-vn.virginia.gov
- +9more
csvUpdated Oct 30, 2025ShareFacebookTwitterEmailClick to copy linkLink copiedCiteU.S. Environmental Protection Agency (2025). Air Quality Index Report - City wise(Virginia) (2024) [Dataset]. https://data.virginia.gov/dataset/air-quality-index-report-city-wise-virginia-2024csv(1302)Available download formatsDataset updatedOct 30, 2025AuthorsU.S. Environmental Protection AgencyArea coveredVirginiaDescriptionThe AirData Air Quality Index Summary Report displays an annual summary of Air Quality Index (AQI) values for counties or core based statistical areas (CBSA). Air Quality Index is an indicator of overall air quality, because it takes into account all of the criteria air pollutants measured within a geographic area. Although AQI includes all available pollutant measurements, you should be aware that many areas have monitoring stations for some, but not all, of the pollutants. Each row of the AQI Report lists summary values for one year for one county or CBSA. The summary values include both qualitative measures (days of the year having "good" air quality, for example) and descriptive statistics (median AQI value, for example).
Summary statistics for the current year are incomplete because data are still being reported and quality assured. Data for the current year are considered preliminary until May 1 of the following year. Therefore, comparing reported values for the current year with previous years may not be valid.
Air quality statistics
- gov.uk
- s3.amazonaws.com
Updated Jun 27, 2025+ more versionsShareFacebookTwitterEmailClick to copy linkLink copiedCiteDepartment for Environment, Food & Rural Affairs (2025). Air quality statistics [Dataset]. https://www.gov.uk/government/statistics/air-quality-statisticsDataset updatedJun 27, 2025AuthorsDepartment for Environment, Food & Rural AffairsDescriptionThis publication summarises the concentrations of major air pollutants as measured by the Automatic Urban and Rural Network (AURN). This release covers annual average concentrations in the UK of:
- nitrogen dioxide (NO2)
- particulates (PM2.5)
- particulates (PM10)
- ozone (O3)
The release also covers the number of days when air pollution was ‘Moderate’ or higher for any one of five pollutants listed below:
- nitrogen dioxide (NO2)
- particulates (PM2.5)
- particulates (PM10)
- ozone (O3)
- sulphur dioxide (SO2)
These statistics are used to monitor progress against the UK’s reduction targets for concentrations of air pollutants. Improvements in air quality help reduce harm to human health and the environment.
Air quality in the UK is strongly linked to anthropogenic emissions of pollutants. For more information on UK emissions data and other information please refer to the air quality and emissions statistics GOV.UK page.
The statistics in this publication are based on data from the Automatic Urban and Rural Network (AURN) of air quality monitors. The https://uk-air.defra.gov.uk/">UK-AIR website contains the latest air quality monitoring data for the UK and detailed information about the different monintoring networks that measure air quality. The website also hosts the latest data produced using Pollution Climate Mapping (PCM) which is a suite of models that uses both monitoring and emissions data to model concentrations of air pollutants across the whole of the UK. The UK-AIR website also provides air pollution episode updates and information on Local Authority Air Quality Management Areas as well as a number of useful reports.
The monitoring data is continuously reviewed and subject to change when issues are highlighted. This means that the time series for certain statistics may vary slightly from year to year. You can access editions of this publication via The National Archives or the links below.
The datasets associated with this publication can be found here ENV02 - Air quality statistics.
As part of our ongoing commitment to compliance with the https://code.statisticsauthority.gov.uk/">Code of Practice for Official Statistics we wish to strengthen our engagement with users of air quality data and better understand how the data is used and the types of decisions that they inform. We invite users to https://forms.office.com/pages/responsepage.aspx?id=UCQKdycCYkyQx044U38RAvtqaLEKUSxHhjbo5C6dq4lUMFBZMUJMNDNCS0xOOExBSDdESVlHSEdHUi4u&route=shorturl">register as a “user of Air Quality data”, so that we can retain your details, inform you of any new releases of Air Quality statistics and provide you with the opportunity to take part in user engagement activities that we may run. If you would like to register as a user of Air Quality data, please provide your details in the attached https://forms.office.com/pages/responsepage.aspx?id=UCQKdycCYkyQx044U38RAvtqaLEKUSxHhjbo5C6dq4lUMFBZMUJMNDNCS0xOOExBSDdESVlHSEdHUi4u&route=shorturl">form.
2024
https://webarchive.nationalarchives.gov.uk/ukgwa/20250609165125/https://www.gov.uk/government/statistics/air-quality-statistics">Air Quality Statistics in the UK, 1987 to 2023
2023
https://webarchive.nationalarchives.gov.uk/ukgwa/20230802031254/https://www.gov.uk/government/statistics/air-quality-statistics">Air Quality Statistics in the UK, 1987 to 2022
2022
https://webarchive.nationalarchives.gov.uk/ukgwa/20230301015627/https://www.gov.uk/government/statistics/air-quality-statistics">Air Quality Statistics in the UK, 1987 to 2021
2021
https://webarchive.nationalarchives.gov.uk/ukgwa/20211111164715/https://www.gov.uk/government/statistics/air-quality-statistics">Air Quality Statistics in the UK, 1987 to 2020
2020
https://webarchive.nationalarchives.gov.uk/20201225100256/https://www.gov.uk/government/statistics/air-quality-statistics">Air Quality Statistics in the UK, 1987 to 2019
2019
https://webarchive.nationalarchives.gov.uk/20200303040317/https://www.gov.uk/government/statistics/air-quality-statistics">Air Quality Statistics in the UK, 1987 to 2018
2018
<a rel="external" href="https://webarchive.nation
- d
Air Quality Index Days
- catalog.data.gov
Updated Mar 31, 2025ShareFacebookTwitterEmailClick to copy linkLink copiedCiteCity of Philadelphia (2025). Air Quality Index Days [Dataset]. https://catalog.data.gov/dataset/air-quality-index-daysDataset updatedMar 31, 2025Dataset provided byCity of PhiladelphiaDescriptionNumber of bad AQI (air quality index) days, dating back to 1990.
- U
United States AQI: Colorado: Denver-Aurora-Lakewood: NO2
- ceicdata.com
Updated Nov 11, 2022ShareFacebookTwitterEmailClick to copy linkLink copiedCiteCEICdata.com (2022). United States AQI: Colorado: Denver-Aurora-Lakewood: NO2 [Dataset]. https://www.ceicdata.com/en/united-states/air-quality-index-and-air-pollutantsDataset updatedNov 11, 2022Dataset provided byCEICdata.comLicenseAttribution 4.0 (CC BY 4.0)https://creativecommons.org/licenses/by/4.0/
License information was derived automaticallyTime period coveredDec 20, 2024 - Dec 31, 2024Area coveredUnited StatesDescriptionAQI: Colorado: Denver-Aurora-Lakewood: NO2 data was reported at 28.000 Index in 31 Mar 2025. This records an increase from the previous number of 18.000 Index for 30 Mar 2025. AQI: Colorado: Denver-Aurora-Lakewood: NO2 data is updated daily, averaging 42.000 Index from Jan 1980 (Median) to 31 Mar 2025, with 15838 observations. The data reached an all-time high of 101.000 Index in 14 Feb 2018 and a record low of 12.000 Index in 02 May 2020. AQI: Colorado: Denver-Aurora-Lakewood: NO2 data remains active status in CEIC and is reported by United States Environmental Protection Agency. The data is categorized under Global Database’s United States – Table US.ESG.E001: Air Quality Index and Air Pollutants. [COVID-19-IMPACT]
FacebookTwitterThis United States Environmental Protection Agency (US EPA) feature layer represents monitoring site data, updated hourly concentrations and Air Quality Index (AQI) values for the latest hour received from monitoring sites that report to AirNow.Map and forecast data are collected using federal reference or equivalent monitoring techniques or techniques approved by the state, local or tribal monitoring agencies. To maintain "real-time" maps, the data are displayed after the end of each hour. Although preliminary data quality assessments are performed, the data in AirNow are not fully verified and validated through the quality assurance procedures monitoring organizations used to officially submit and certify data on the EPA Air Quality System (AQS).This data sharing, and centralization creates a one-stop source for real-time and forecast air quality data. The benefits include quality control, national reporting consistency, access to automated mapping methods, and data distribution to the public and other data systems. The U.S. Environmental Protection Agency, National Oceanic and Atmospheric Administration, National Park Service, tribal, state, and local agencies developed the AirNow system to provide the public with easy access to national air quality information. State and local agencies report the Air Quality Index (AQI) for cities across the US and parts of Canada and Mexico. AirNow data are used only to report the AQI, not to formulate or support regulation, guidance or any other EPA decision or position.About the AQIThe Air Quality Index (AQI) is an index for reporting daily air quality. It tells you how clean or polluted your air is, and what associated health effects might be a concern for you. The AQI focuses on health effects you may experience within a few hours or days after breathing polluted air. EPA calculates the AQI for five major air pollutants regulated by the Clean Air Act: ground-level ozone, particle pollution (also known as particulate matter), carbon monoxide, sulfur dioxide, and nitrogen dioxide. For each of these pollutants, EPA has established national air quality standards to protect public health. Ground-level ozone and airborne particles (often referred to as "particulate matter") are the two pollutants that pose the greatest threat to human health in this country.A number of factors influence ozone formation, including emissions from cars, trucks, buses, power plants, and industries, along with weather conditions. Weather is especially favorable for ozone formation when it’s hot, dry and sunny, and winds are calm and light. Federal and state regulations, including regulations for power plants, vehicles and fuels, are helping reduce ozone pollution nationwide.Fine particle pollution (or "particulate matter") can be emitted directly from cars, trucks, buses, power plants and industries, along with wildfires and woodstoves. But it also forms from chemical reactions of other pollutants in the air. Particle pollution can be high at different times of year, depending on where you live. In some areas, for example, colder winters can lead to increased particle pollution emissions from woodstove use, and stagnant weather conditions with calm and light winds can trap PM2.5 pollution near emission sources. Federal and state rules are helping reduce fine particle pollution, including clean diesel rules for vehicles and fuels, and rules to reduce pollution from power plants, industries, locomotives, and marine vessels, among others.How Does the AQI Work?Think of the AQI as a yardstick that runs from 0 to 500. The higher the AQI value, the greater the level of air pollution and the greater the health concern. For example, an AQI value of 50 represents good air quality with little potential to affect public health, while an AQI value over 300 represents hazardous air quality.An AQI value of 100 generally corresponds to the national air quality standard for the pollutant, which is the level EPA has set to protect public health. AQI values below 100 are generally thought of as satisfactory. When AQI values are above 100, air quality is considered to be unhealthy-at first for certain sensitive groups of people, then for everyone as AQI values get higher.Understanding the AQIThe purpose of the AQI is to help you understand what local air quality means to your health. To make it easier to understand, the AQI is divided into six categories:Air Quality Index(AQI) ValuesLevels of Health ConcernColorsWhen the AQI is in this range:..air quality conditions are:...as symbolized by this color:0 to 50GoodGreen51 to 100ModerateYellow101 to 150Unhealthy for Sensitive GroupsOrange151 to 200UnhealthyRed201 to 300Very UnhealthyPurple301 to 500HazardousMaroonNote: Values above 500 are considered Beyond the AQI. Follow recommendations for the Hazardous category. Additional information on reducing exposure to extremely high levels of particle pollution is available here.Each category corresponds to a different level of health concern. The six levels of health concern and what they mean are:"Good" AQI is 0 to 50. Air quality is considered satisfactory, and air pollution poses little or no risk."Moderate" AQI is 51 to 100. Air quality is acceptable; however, for some pollutants there may be a moderate health concern for a very small number of people. For example, people who are unusually sensitive to ozone may experience respiratory symptoms."Unhealthy for Sensitive Groups" AQI is 101 to 150. Although general public is not likely to be affected at this AQI range, people with lung disease, older adults and children are at a greater risk from exposure to ozone, whereas persons with heart and lung disease, older adults and children are at greater risk from the presence of particles in the air."Unhealthy" AQI is 151 to 200. Everyone may begin to experience some adverse health effects, and members of the sensitive groups may experience more serious effects."Very Unhealthy" AQI is 201 to 300. This would trigger a health alert signifying that everyone may experience more serious health effects."Hazardous" AQI greater than 300. This would trigger a health warnings of emergency conditions. The entire population is more likely to be affected.AQI colorsEPA has assigned a specific color to each AQI category to make it easier for people to understand quickly whether air pollution is reaching unhealthy levels in their communities. For example, the color orange means that conditions are "unhealthy for sensitive groups," while red means that conditions may be "unhealthy for everyone," and so on.Air Quality Index Levels of Health ConcernNumericalValueMeaningGood0 to 50Air quality is considered satisfactory, and air pollution poses little or no risk.Moderate51 to 100Air quality is acceptable; however, for some pollutants there may be a moderate health concern for a very small number of people who are unusually sensitive to air pollution.Unhealthy for Sensitive Groups101 to 150Members of sensitive groups may experience health effects. The general public is not likely to be affected.Unhealthy151 to 200Everyone may begin to experience health effects; members of sensitive groups may experience more serious health effects.Very Unhealthy201 to 300Health alert: everyone may experience more serious health effects.Hazardous301 to 500Health warnings of emergency conditions. The entire population is more likely to be affected.Note: Values above 500 are considered Beyond the AQI. Follow recommendations for the "Hazardous category." Additional information on reducing exposure to extremely high levels of particle pollution is available here.