Alcohol Consumption: Adults Who Binge Drink - CDPHE Community Level...
- trac-cdphe.opendata.arcgis.com
- hub.arcgis.com
- +1more
Updated May 12, 2016 Share
Share Facebook
 Twitter
 EmailClick to copy linkLink copiedCiteColorado Department of Public Health and Environment (2016). Alcohol Consumption: Adults Who Binge Drink - CDPHE Community Level Estimates (Census Tracts) [Dataset]. https://trac-cdphe.opendata.arcgis.com/items/b3e3108f65634da5a931a75793f65ab1Dataset updatedMay 12, 2016Dataset authored and provided byColorado Department of Public Health and Environmenthttps://cdphe.colorado.gov/Area coveredDescription
These data represent the predicted (modeled) prevalence of Binge Drinking among adults (Age 18+) for each census tract in Colorado. Binge Drinking is defined for males as having five or more drinks on one occasion and for females as having four or more drinks on one occasion within the past 30 days. Binge Drinking is calculated from the number of days alcohol was consumed in the past 30 days, and the average number of drinks consumed on those days.The estimate for each census tract represents an average that was derived from multiple years of Colorado Behavioral Risk Factor Surveillance System data (2014-2017).CDPHE used a model-based approach to measure the relationship between age, race, gender, poverty, education, location and health conditions or risk behavior indicators and applied this relationship to predict the number of persons' who have the health conditions or risk behavior for each census tract in Colorado. We then applied these probabilities, based on demographic stratification, to the 2013-2017 American Community Survey population estimates and determined the percentage of adults with the health conditions or risk behavior for each census tract in Colorado.The estimates are based on statistical models and are not direct survey estimates. Using the best available data, CDPHE was able to model census tract estimates based on demographic data and background knowledge about the distribution of specific health conditions and risk behaviors.The estimates are displayed in both the map and data table using point estimate values for each census tract and displayed using a Quintile range. The high and low value for each color on the map is calculated based on dividing the total number of census tracts in Colorado (1249) into five groups based on the total range of estimates for all Colorado census tracts. Each Quintile range represents roughly 20% of the census tracts in Colorado. No estimates are provided for census tracts with a known population of less than 50. These census tracts are displayed in the map as "No Est, Pop < 50."No estimates are provided for 7 census tracts with a known population of less than 50 or for the 2 census tracts that exclusively contain a federal correctional institution as 100% of their population. These 9 census tracts are displayed in the map as "No Estimate."
Liters of alcohol consumed per capita in selected European countries 2022
- statista.com
- ai-chatbox.pro
Updated May 30, 2025ShareFacebookTwitterEmailClick to copy linkLink copiedCiteStatista (2025). Liters of alcohol consumed per capita in selected European countries 2022 [Dataset]. https://www.statista.com/statistics/755502/alcohol-consumption-in-liters-per-capita-ineu/Dataset updatedMay 30, 2025Time period covered2022Area coveredEurope, EUDescriptionIn 2022, Latvia consumed 11.9 liters of alcohol per capita, which was the highest among European countries. Spain had the second-highest alcohol consumption per capita, at 11.8 liters, with Turkey having the lowest at 1.6 liters.
- E
World Alcohol Consumption Trends 2005
- find.data.gov.scot
- dtechtive.com
xml, zipUpdated Feb 21, 2017ShareFacebookTwitterEmailClick to copy linkLink copiedCiteUniversity of Edinburgh (2017). World Alcohol Consumption Trends 2005 [Dataset]. http://doi.org/10.7488/ds/1809xml(0.0044 MB), zip(5.117 MB)Available download formatsUnique identifierhttps://doi.org/10.7488/ds/1809Dataset updatedFeb 21, 2017Dataset provided byUniversity of EdinburghLicenseODC Public Domain Dedication and Licence (PDDL) v1.0http://www.opendatacommons.org/licenses/pddl/1.0/
License information was derived automaticallyArea coveredWorldDescriptionThis data represents the trends in alcohol consumption around the World in 2010/11. The data was sourced from a WHO report 'Global status report of health and alcohol' (http://www.who.int/substance_abuse/publications/global_alcohol_report/msbgsruprofiles.pdf). Several points should be noted , consumption is measured as the 'per capita consumption for adults (+15 years) and is measured as litres of pure alcohol'. Most data is for 2005, but the recorded consumption is an average figure for 2003-2005. A map is included in the download for easy of use. This dataset was created from a WHO report 'Global status report of health and alcohol' (http://www.who.int/substance_abuse/publications/global_alcohol_report/msbgsruprofiles.pdf). The data was extracted and converted into a GIS friendly format. It was then combined with a World Boundary File (http://hdl.handle.net/10672/124) so the data could be represented as a map. Any use of this data should acknowledge the World Health Organisation (WHO) as the data source. GIS vector data. This dataset was first accessioned in the EDINA ShareGeo Open repository on 2011-03-01 and migrated to Edinburgh DataShare on 2017-02-21.
- a
PLACES: Binge drinking
- hub.arcgis.com
Updated Sep 11, 2020ShareFacebookTwitterEmailClick to copy linkLink copiedCiteCenters for Disease Control and Prevention (2020). PLACES: Binge drinking [Dataset]. https://hub.arcgis.com/maps/999dba34ae94402682e4ed0c55fb2bceDataset updatedSep 11, 2020Dataset authored and provided byCenters for Disease Control and PreventionArea coveredDescriptionThis web map is part of the Centers for Disease Control and Prevention (CDC) PLACES. It provides model-based estimates of binge drinking prevalence among adults aged 18 years and old at county, place, census tract and ZCTA levels in the United States. PLACES is an expansion of the original 500 Cities Project and a collaboration between the CDC, the Robert Wood Johnson Foundation, and the CDC Foundation. Data sources used to generate these estimates include the Behavioral Risk Factor Surveillance System (BRFSS), Census 2020 population counts or Census annual county-level population estimates, and the American Community Survey (ACS) estimates. For detailed methodology see www.cdc.gov/places. For questions or feedback send an email to places@cdc.gov.Measure name used for binge drinking is BINGE.
- f
Table_2_Epidemiology, Hot Spots, and Sociodemographic Risk Factors of...
- frontiersin.figshare.com
xlsxUpdated Jun 10, 2023+ more versionsShareFacebookTwitterEmailClick to copy linkLink copiedCiteKaruppusamy Balasubramani; Winnie Paulson; Savitha Chellappan; Ramakrishnan Ramachandran; Sujit Kumar Behera; Praveen Balabaskaran Nina (2023). Table_2_Epidemiology, Hot Spots, and Sociodemographic Risk Factors of Alcohol Consumption in Indian Men and Women: Analysis of National Family Health Survey-4 (2015-16), a Nationally Representative Cross-Sectional Study.XLSX [Dataset]. http://doi.org/10.3389/fpubh.2021.617311.s002xlsxAvailable download formatsUnique identifierhttps://doi.org/10.3389/fpubh.2021.617311.s002Dataset updatedJun 10, 2023Dataset provided byFrontiersAuthorsKaruppusamy Balasubramani; Winnie Paulson; Savitha Chellappan; Ramakrishnan Ramachandran; Sujit Kumar Behera; Praveen Balabaskaran NinaLicenseAttribution 4.0 (CC BY 4.0)https://creativecommons.org/licenses/by/4.0/
License information was derived automaticallyArea coveredIndiaDescriptionObjectives: To map the alcohol hot spots and understand the Sociodemographic Indices (SDI) affecting alcohol consumption in Indian men and women.Methods: Data from National Family Health Survey-4 carried out from 2015 to 2016 with a sample size of 103,411 men and 699,686 women were used for Geographic Information System mapping, and hot spot identification by spatial statistics (Getis-Ord Gi*). Bivariate analyses and multiple logistic regressions were used to analyze SDI.Results: India has three major alcohol hot spots: (1) North-East (NE) states, (2) Eastern Peninsular states formed by Chhattisgarh, Odisha, Jharkhand, and Telangana, and (3) Southern states of Tamil Nadu and Kerala. Hot spot analysis strongly correlated with region-wise analysis of SDI. Respondents who consumed tobacco have higher odds (men adjusted odds ratio [aOR]: 5.42; women aOR: 4.30) of consuming alcohol. Except for religion and social category, other socioeconomic factors have a low to moderate effect on alcohol consumption.Conclusions: Hot spots and high-risk districts of alcohol consumption identified in this study can guide public health policies for targeted intervention. Alcohol use is at the discretion of individual states and union territories, and stringent anti-alcohol policies strictly enforced across India are the keys to control alcohol use.
- d
Data used to model and map lithium concentrations in groundwater used as...
- catalog.data.gov
- data.usgs.gov
- +1more
Updated Jul 6, 2024+ more versionsShareFacebookTwitterEmailClick to copy linkLink copiedCiteU.S. Geological Survey (2024). Data used to model and map lithium concentrations in groundwater used as drinking water for the conterminous United States [Dataset]. https://catalog.data.gov/dataset/data-used-to-model-and-map-lithium-concentrations-in-groundwater-used-as-drinking-water-foDataset updatedJul 6, 2024Area coveredContiguous United States, United StatesDescriptionThis data release contains data used to develop models and maps that estimate the occurrence of lithium in groundwater used as drinking water throughout the conterminous United States. An extreme gradient boosting model was developed to estimate the most probable lithium concentration category (≤4, >4 to ≤10, >10 to ≤30 or >30 µg/L). The model uses lithium concentration data from wells located throughout the conterminous United States and predictor variables that are available as geospatial data. The model is included in this data release in the zipped folder named Model_Archive and was used to produce maps that are also included in this data release. The model input data (predictor variables) that were used to make the maps are within a zipped folder (Map_Input_Data.zip) that contains 20 tif-raster files, one for each model predictor variable. The map probability estimates that are outputs from the model are in a zipped folder (Map_Output_Data.zip) that contains 10 tif-raster files, two model estimate maps for each of the lithium concentration categories and the category with the highest probability for public supply well depths and domestic supply well depths.
- w
map Alcohol and Drug Abuse Prevention Services
- data.wu.ac.at
Updated Jul 26, 2018+ more versionsShareFacebookTwitterEmailClick to copy linkLink copiedCiteOIMT Open Data Coordinator (2018). map Alcohol and Drug Abuse Prevention Services [Dataset]. https://data.wu.ac.at/schema/data_hawaii_gov/bjk5OC1hd2VyDataset updatedJul 26, 2018Dataset provided byOIMT Open Data CoordinatorDescriptionLocation of facilities participating in Alocohol and Drug Abuse Prevention and Awareness Services
- N
Acute alcohol administration dampens central extended amygdala reactivity:...
- neurovault.org
niftiUpdated Nov 20, 2018+ more versionsShareFacebookTwitterEmailClick to copy linkLink copiedCite(2018). Acute alcohol administration dampens central extended amygdala reactivity: Alcohol Effects: Placebo>Alcohol [Dataset]. http://identifiers.org/neurovault.image:100439niftiAvailable download formatsUnique identifierhttps://identifiers.org/neurovault.image:100439Dataset updatedNov 20, 2018LicenseCC0 1.0 Universal Public Domain Dedicationhttps://creativecommons.org/publicdomain/zero/1.0/
License information was derived automaticallyDescription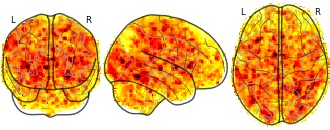
Collection description
Citation: Hur, J., Kaplan, C. M., Smith, J. F., Bradford, D. E., Fox, A. S., Curtin, J. J., & Shackman, A. J. (in press). Acute alcohol administration dampens central extended amygdala reactivity. Scientific Reports.
Alcohol use is common, imposes a staggering burden on public health, and often resists treatment, underscoring the need to develop a deeper understanding of the underlying neurobiology. The central extended amygdala (EAc)—including the bed nucleus of the stria terminalis (BST) and the central nucleus of the amygdala (Ce)—plays a key role in prominent neuroscientific models of alcohol drinking, but the relevance of these regions to acute alcohol consumption in humans remains unknown. Using a single-blind, randomized-groups design, multiband fMRI data were acquired from 49 social drinkers while they performed a well-established emotional faces paradigm after consuming alcohol or placebo. Relative to placebo, alcohol significantly dampened reactivity to emotional faces in the BST. To rigorously assess potential regional differences in activation, data were extracted from unbiased, anatomically predefined regions-of-interest. Analyses revealed similar levels of dampening in the BST and Ce. In short, alcohol transiently reduces reactivity to emotional faces and it does so similarly across the two major divisions of the human EAc. These observations reinforce the translational relevance of addiction models derived from preclinical work in rodents and provide insights into the neural systems most relevant to the consumption of alcohol and the initial development of alcohol abuse in humans.Subject species
homo sapiens
Modality
fMRI-BOLD
Analysis level
group
Cognitive paradigm (task)
emotion processing fMRI task paradigm
Map type
T
- a
Colorado HSR BRFSS Binge Drinking Prevalence (Retail Alcohol Density Map)
- hub.arcgis.com
- data-cdphe.opendata.arcgis.com
Updated Aug 8, 2024ShareFacebookTwitterEmailClick to copy linkLink copiedCiteColorado Department of Public Health and Environment (2024). Colorado HSR BRFSS Binge Drinking Prevalence (Retail Alcohol Density Map) [Dataset]. https://hub.arcgis.com/maps/CDPHE::colorado-hsr-brfss-binge-drinking-prevalence-retail-alcohol-density-mapDataset updatedAug 8, 2024Dataset authored and provided byColorado Department of Public Health and EnvironmentArea coveredDescriptionColorado HSR BRFSS Binge Drinking Prevalence represents the Percent of Adults who Binge Drink calculated from the 2018-2022 Colorado Behavioral Risk Factor Surveillance System (Health Statistics Region Estimates) data set. These data represent the estimated prevalence of Binge Drinking among adults (Age 18+) for each Health Statistics Region (HSR) in Colorado. Binge Drinking is defined for males as having five or more drinks on one occasion and for females as having four or more drinks on one occasion within the past 30 days. Binge Drinking is calculated from the number of days alcohol was consumed in the past 30 days, and the average number of drinks consumed on those days. Data is suppressed if there was not enough data to calculate a reliable estimate. The estimate for each HSR was derived from multiple years of Colorado Behavioral Risk Factor Surveillance System data (2018-2022). This file was developed for use in activities and exercises within the Colorado Department of Public Health and Environment (CDPHE), including the Alcohol Outlet Density StoryMap.COUNTIES (County Names that are included in each Health Statistic Region)Health Statistics Region (Colorado Health Statistics Region ID)Binge Percent (Region estimate for prevalence of Binge Drinking among adults Age 18+)Lower Confidence Limit (Lower 95% Confidence Interval for Binge Percent Value)Upper Confidence Limit (Upper 95% Confidence Interval for Binge Percent Value)Years (2018-2022)
- a
MassDEP Estimated Public Drinking Water System Service Area Boundaries...
- geo-massdot.opendata.arcgis.com
Updated Aug 19, 2024+ more versionsShareFacebookTwitterEmailClick to copy linkLink copiedCiteMassGIS - Bureau of Geographic Information (2024). MassDEP Estimated Public Drinking Water System Service Area Boundaries (Feature Service) [Dataset]. https://geo-massdot.opendata.arcgis.com/datasets/massgis::massdep-estimated-public-drinking-water-system-service-area-boundaries-feature-serviceDataset updatedAug 19, 2024Dataset authored and provided byMassGIS - Bureau of Geographic InformationArea coveredDescriptionTerms of UseData Limitations and DisclaimerThe user’s use of and/or reliance on the information contained in the Document shall be at the user’s own risk and expense. MassDEP disclaims any responsibility for any loss or harm that may result to the user of this data or to any other person due to the user’s use of the Document.This is an ongoing data development project. Attempts have been made to contact all PWS systems, but not all have responded with information on their service area. MassDEP will continue to collect and verify this information. Some PWS service areas included in this datalayer have not been verified by the PWS or the municipality involved, but since many of those areas are based on information published online by the municipality, the PWS, or in a publicly available report, they are included in the estimated PWS service area datalayer.Please note: All PWS service area delineations are estimates for broad planning purposes and should only be used as a guide. The data is not appropriate for site-specific or parcel-specific analysis. Not all properties within a PWS service area are necessarily served by the system, and some properties outside the mapped service areas could be served by the PWS – please contact the relevant PWS. Not all service areas have been confirmed by the systems.Please use the following citation to reference these data:MassDEP, Water Utility Resilience Program. 2025. Community and Non-Transient Non-Community Public Water System Service Area (PubV2025_3).IMPORTANT NOTICE: This MassDEP Estimated Water Service datalayer may not be complete, may contain errors, omissions, and other inaccuracies and the data are subject to change. This version is published through MassGIS. We want to learn about the data uses. If you use this dataset, please notify staff in the Water Utility Resilience Program (WURP@mass.gov).
This GIS datalayer represents approximate service areas for Public Water Systems (PWS) in Massachusetts. In 2017, as part of its “Enhancing Resilience and Emergency Preparedness of Water Utilities through Improved Mapping” (Critical Infrastructure Mapping Project ), the MassDEP Water Utility Resilience Program (WURP) began to uniformly map drinking water service areas throughout Massachusetts using information collected from various sources. Along with confirming existing public water system (PWS) service area information, the project collected and verified estimated service area delineations for PWSs not previously delineated and will continue to update the information contained in the datalayers. As of the date of publication, WURP has delineated Community (COM) and Non-Transient Non-Community (NTNC) service areas. Transient non-community (TNCs) are not part of this mapping project.
Layers and Tables:
The MassDEP Estimated Public Water System Service Area data comprises two polygon feature classes and a supporting table. Some data fields are populated from the MassDEP Drinking Water Program’s Water Quality Testing System (WQTS) and Annual Statistical Reports (ASR).
The Community Water Service Areas feature class (PWS_WATER_SERVICE_AREA_COMM_POLY) includes polygon features that represent the approximate service areas for PWS classified as Community systems.The NTNC Water Service Areas feature class (PWS_WATER_SERVICE_AREA_NTNC_POLY) includes polygon features that represent the approximate service areas for PWS classified as Non-Transient Non-Community systems.The Unlocated Sites List table (PWS_WATER_SERVICE_AREA_USL) contains a list of known, unmapped active Community and NTNC PWS services areas at the time of publication.
Production
Data Universe
Public Water Systems in Massachusetts are permitted and regulated through the MassDEP Drinking Water Program. The WURP has mapped service areas for all active and inactive municipal and non-municipal Community PWSs in MassDEP’s Water Quality Testing Database (WQTS). Community PWS refers to a public water system that serves at least 15 service connections used by year-round residents or regularly serves at least 25 year-round residents.
All active and inactive NTNC PWS were also mapped using information contained in WQTS. An NTNC or Non-transient Non-community Water System refers to a public water system that is not a community water system and that has at least 15 service connections or regularly serves at least 25 of the same persons or more approximately four or more hours per day, four or more days per week, more than six months or 180 days per year, such as a workplace providing water to its employees.
These data may include declassified PWSs. Staff will work to rectify the status/water services to properties previously served by declassified PWSs and remove or incorporate these service areas as needed.
Maps of service areas for these systems were collected from various online and MassDEP sources to create service areas digitally in GIS. Every PWS is assigned a unique PWSID by MassDEP that incorporates the municipal ID of the municipality it serves (or the largest municipality it serves if it serves multiple municipalities). Some municipalities contain more than one PWS, but each PWS has a unique PWSID. The Estimated PWS Service Area datalayer, therefore, contains polygons with a unique PWSID for each PWS service area.
A service area for a community PWS may serve all of one municipality (e.g. Watertown Water Department), multiple municipalities (e.g. Abington-Rockland Joint Water Works), all or portions of two or more municipalities (e.g. Provincetown Water Dept which serves all of Provincetown and a portion of Truro), or a portion of a municipality (e.g. Hyannis Water System, which is one of four PWSs in the town of Barnstable).
Some service areas have not been mapped but their general location is represented by a small circle which serves as a placeholder. The location of these circles are estimates based on the general location of the source wells or the general estimated location of the service area - these do not represent the actual service area.
Service areas were mapped initially from 2017 to 2022 and reflect varying years for which service is implemented for that service area boundary. WURP maintains the dataset quarterly with annual data updates; however, the dataset may not include all current active PWSs. A list of unmapped PWS systems is included in the USL table PWS_WATER_SERVICE_AREA_USL available for download with the dataset. Some PWSs that are not mapped may have come online after this iteration of the mapping project; these will be reconciled and mapped during the next phase of the WURP project. PWS IDs that represent regional or joint boards with (e.g. Tri Town Water Board, Randolph/Holbrook Water Board, Upper Cape Regional Water Cooperative) will not be mapped because their individual municipal service areas are included in this datalayer.
Some PWSs that are not mapped may have come online after this iteration of the mapping project; these will be reconciled and mapped during the next phase of the WURP project. Those highlighted (e.g. Tri Town Water Board, Randolph/Holbrook Water Board, Upper Cape Regional Water Cooperative) represent regional or joint boards that will not be mapped, because their individual municipal service areas are included in this datalayer.
PWSs that do not have corresponding sources, may be part of consecutive systems, may have been incorporated into another PWSs, reclassified as a different type of PWS, or otherwise taken offline. PWSs that have been incorporated, reclassified, or taken offline will be reconciled during the next data update.
Methodologies and Data Sources
Several methodologies were used to create service area boundaries using various sources, including data received from the systems in response to requests for information from the MassDEP WURP project, information on file at MassDEP, and service area maps found online at municipal and PWS websites. When provided with water line data rather than generalized areas, 300-foot buffers were created around the water lines to denote service areas and then edited to incorporate generalizations. Some municipalities submitted parcel data or address information to be used in delineating service areas.
Verification Process
Small-scale PDF file maps with roads and other infrastructure were sent to every PWS for corrections or verifications. For small systems, such as a condominium complex or residential school, the relevant parcels were often used as the basis for the delineated service area. In towns where 97% or more of their population is served by the PWS and no other service area delineation was available, the town boundary was used as the service area boundary. Some towns responded to the request for information or verification of service areas by stating that the town boundary should be used since all or nearly all of the municipality is served by the PWS.
Sources of information for estimated drinking water service areas
The following information was used to develop estimated drinking water service areas:
EOEEA Water Assets Project (2005) water lines (these were buffered to create service areas)Horsely Witten Report 2008Municipal Master Plans, Open Space Plans, Facilities Plans, Water Supply System Webpages, reports and online interactive mapsGIS data received from PWSDetailed infrastructure mapping completed through the MassDEP WURP Critical Infrastructure InitiativeIn the absence of other service area information, for municipalities served by a town-wide water system serving at least 97% of the population, the municipality’s boundary was used. Determinations of which municipalities are 97% or more served by the PWS were made based on the Percent Water Service Map created in 2018 by MassDEP based on various sources of information including but not limited to:The Winter population served submitted by the PWS in the ASR submittalThe number of services from WQTS as a percent of
- a
Indicator 3.5.2: Alcohol consumption per capita (aged 15 years and older)...
- data-isdh.opendata.arcgis.com
- sdgs.amerigeoss.org
Updated Sep 9, 2021+ more versionsShareFacebookTwitterEmailClick to copy linkLink copiedCiteUN DESA Statistics Division (2021). Indicator 3.5.2: Alcohol consumption per capita (aged 15 years and older) within a calendar year (litres of pure alcohol) [Dataset]. https://data-isdh.opendata.arcgis.com/maps/undesa::indicator-3-5-2-alcohol-consumption-per-capita-aged-15-years-and-older-within-a-calendar-year-litres-of-pure-alcoholDataset updatedSep 9, 2021Dataset authored and provided byUN DESA Statistics DivisionArea coveredDescriptionSeries Name: Alcohol consumption per capita (aged 15 years and older) within a calendar year (litres of pure alcohol)Series Code: SH_ALC_CONSPTRelease Version: 2021.Q2.G.03 This dataset is the part of the Global SDG Indicator Database compiled through the UN System in preparation for the Secretary-General's annual report on Progress towards the Sustainable Development Goals.Indicator 3.5.2: Alcohol per capita consumption (aged 15 years and older) within a calendar year in litres of pure alcoholTarget 3.5: Strengthen the prevention and treatment of substance abuse, including narcotic drug abuse and harmful use of alcoholGoal 3: Ensure healthy lives and promote well-being for all at all agesFor more information on the compilation methodology of this dataset, see https://unstats.un.org/sdgs/metadata/
- f
Data_Sheet_3_Jacobian Maps Reveal Under-reported Brain Regions Sensitive to...
- frontiersin.figshare.com
pdfUpdated Jun 7, 2023+ more versionsShareFacebookTwitterEmailClick to copy linkLink copiedCiteQingyu Zhao; Michael Fritz; Adolf Pfefferbaum; Edith V. Sullivan; Kilian M. Pohl; Natalie M. Zahr (2023). Data_Sheet_3_Jacobian Maps Reveal Under-reported Brain Regions Sensitive to Extreme Binge Ethanol Intoxication in the Rat.PDF [Dataset]. http://doi.org/10.3389/fnana.2018.00108.s003pdfAvailable download formatsUnique identifierhttps://doi.org/10.3389/fnana.2018.00108.s003Dataset updatedJun 7, 2023Dataset provided byFrontiersAuthorsQingyu Zhao; Michael Fritz; Adolf Pfefferbaum; Edith V. Sullivan; Kilian M. Pohl; Natalie M. ZahrLicenseAttribution 4.0 (CC BY 4.0)https://creativecommons.org/licenses/by/4.0/
License information was derived automaticallyDescriptionIndividuals aged 12–20 years drink 11% of all alcohol consumed in the United States with more than 90% consumed in the form of binge drinking. Early onset alcohol use is a strong predictor of future alcohol dependence. The study of the effects of excessive alcohol use on the human brain is hampered by limited information regarding the quantity and frequency of exposure to alcohol. Animal models can control for age at alcohol exposure onset and enable isolation of neural substrates of exposure to different patterns and quantities of ethanol (EtOH). As with humans, a frequently used binge exposure model is thought to produce dependence and affect predominantly corticolimbic brain regions. in vivo neuroimaging enables animals models to be examined longitudinally, allowing for each animal to serve as its own control. Accordingly, we conducted 3 magnetic resonance imaging (MRI) sessions (baseline, binge, recovery) to track structure throughout the brains of wild type Wistar rats to test the hypothesis that binge EtOH exposure affects specific brain regions in addition to corticolimbic circuitry. Voxel-based comparisons of 13 EtOH- vs. 12 water- exposed animals identified significant thalamic shrinkage and lateral ventricular enlargement as occurring with EtOH exposure, but recovering with a week of abstinence. By contrast, pretectal nuclei and superior and inferior colliculi shrank in response to binge EtOH treatment but did not recover with abstinence. These results identify brainstem structures that have been relatively underreported but are relevant for localizing neurocircuitry relevant to the dynamic course of alcoholism.
- a
Geodatabase Templates - Drinking Water Map Package
- hub.arcgis.com
- data.geospatialhub.org
Updated Jun 3, 2019ShareFacebookTwitterEmailClick to copy linkLink copiedCitewrds_wdo (2019). Geodatabase Templates - Drinking Water Map Package [Dataset]. https://hub.arcgis.com/documents/c60c197db523490dade12a192b677a2cDataset updatedJun 3, 2019Dataset authored and provided bywrds_wdoDescriptionThis package contains a project specific geodatabase and map (.mxd) for Drinking Water projects. For directions on using this file, see the GIS Standards Technical Memorandum on the Standards Page.
- N
Data from: Nucleus accumbens connectivity at rest is associated with alcohol...
- neurovault.org
zipUpdated May 28, 2025ShareFacebookTwitterEmailClick to copy linkLink copiedCite(2025). Nucleus accumbens connectivity at rest is associated with alcohol consumption in young male adults [Dataset]. http://identifiers.org/neurovault.collection:3020zipAvailable download formatsUnique identifierhttps://identifiers.org/neurovault.collection:3020Dataset updatedMay 28, 2025LicenseCC0 1.0 Universal Public Domain Dedicationhttps://creativecommons.org/publicdomain/zero/1.0/
License information was derived automaticallyDescriptionA collection of 13 brain maps. Each brain map is a 3D array of values representing properties of the brain at different locations.
Collection description
Alcohol is the most used psychoactive substance worldwide. Although its negative effects are widely acknowledged, alcohol use is socially accepted across many cultures, even during adolescence. Prior research revealed that regions involved in reward processing and incentive motivation, such as the nucleus accumbens (NAcc), play an important role in the positive valuation of alcohol and the development of alcohol use disorder. Here we tested whether NAcc resting-state functional connectivity is associated with previous drinking behavior in young adults, and whether it can predict alcohol consumption during a one-year follow (FU) up period. 184 healthy 18 y/o male adults underwent resting-state fMRI to examine functional connectivity (FC) of the NAcc. Furthermore, a lifetime drinking score and a one year follow up drinking score were calculated to test whether NAcc FC is correlated with lifetime drinking behavior and whether it can predict future drinking. Reduced left NAcc connectivity with the bilateral dorsolateral prefrontal cortex (dlPFC) and inferior frontal gyrus (IFG) was associated with higher lifetime alcohol consumption. In addition, weaker connectivity between the left NAcc and dlPFC was associated with higher alcohol consumption during the one-year FU period. Our results are in line with previous studies, reporting altered NAcc connectivity with prefrontal regions in teens with familial risk for AUD, and in AUD itself. This underscores the relevance of Nacc connectivity to the field of alcohol research, not only suggesting a neural mechanism of drinking behavior, but also offering a potential marker for future alcohol (ab)use.
Colorado County BRFSS Binge Drinking Prevalence (Retail Alcohol Density Map)...
- data-cdphe.opendata.arcgis.com
- hub.arcgis.com
Updated Aug 8, 2024+ more versionsShareFacebookTwitterEmailClick to copy linkLink copiedCiteColorado Department of Public Health and Environment (2024). Colorado County BRFSS Binge Drinking Prevalence (Retail Alcohol Density Map) [Dataset]. https://data-cdphe.opendata.arcgis.com/datasets/colorado-county-brfss-binge-drinking-prevalence-retail-alcohol-density-map/aboutDataset updatedAug 8, 2024Dataset authored and provided byColorado Department of Public Health and Environmenthttps://cdphe.colorado.gov/Area coveredDescriptionColorado County BRFSS Binge Drinking Prevalence represents the Percent of Adults who Binge Drink calculated from the 2018-2022 Colorado Behavioral Risk Factor Surveillance System (County Estimates) data set. These data represent the estimated prevalence of Binge Drinking among adults (Age 18+) for each county in Colorado. Binge Drinking is defined for males as having five or more drinks on one occasion and for females as having four or more drinks on one occasion within the past 30 days. Binge Drinking is calculated from the number of days alcohol was consumed in the past 30 days, and the average number of drinks consumed on those days. Data is suppressed if there was not enough data to calculate a reliable estimate. The estimate for each county was derived from multiple years of Colorado Behavioral Risk Factor Surveillance System data (2018-2022). This file was developed for use in activities and exercises within the Colorado Department of Public Health and Environment (CDPHE), including the Alcohol Outlet Density StoryMap. COUNTY (County Name)FULL (Full County Name)LABEL (Proper County Name)County FIPS (County FIPS Code as String)NUM FIPS (County FIPS Code as Number)CENT LAT (County Centroid Latitude)CENT LONG (County Centroid Longitude)US FIPS (Full FIPS Code)Binge Percent (County estimate for prevalence of Binge Drinking among adults Age 18+)Lower Confidence Limit (Lower 95% Confidence Interval for Binge Percent Value)Upper Confidence Limit (Upper 95% Confidence Interval for Binge Percent Value)Years (2018-2022)
- d
National Drinking Water Source Water Quality Protection Area Map
- data.gov.tw
ShareFacebookTwitterEmailClick to copy linkLink copiedCiteMinistry of Environment, National Drinking Water Source Water Quality Protection Area Map [Dataset]. https://data.gov.tw/en/datasets/6377Dataset authored and provided byMinistry of EnvironmentLicensehttps://data.gov.tw/licensehttps://data.gov.tw/license
DescriptionDisplay the range of national drinking water sources and the designated distance of drinking water intakes as announced in accordance with the Drinking Water Management Regulations.
- N
Acute alcohol administration dampens central extended amygdala reactivity:...
- neurovault.org
niftiUpdated Nov 20, 2018+ more versionsShareFacebookTwitterEmailClick to copy linkLink copiedCite(2018). Acute alcohol administration dampens central extended amygdala reactivity: Houses>Faces [Dataset]. http://identifiers.org/neurovault.image:100438niftiAvailable download formatsUnique identifierhttps://identifiers.org/neurovault.image:100438Dataset updatedNov 20, 2018LicenseCC0 1.0 Universal Public Domain Dedicationhttps://creativecommons.org/publicdomain/zero/1.0/
License information was derived automaticallyDescription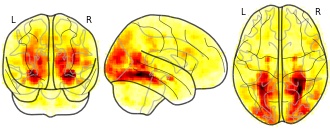
Collection description
Citation: Hur, J., Kaplan, C. M., Smith, J. F., Bradford, D. E., Fox, A. S., Curtin, J. J., & Shackman, A. J. (in press). Acute alcohol administration dampens central extended amygdala reactivity. Scientific Reports.
Alcohol use is common, imposes a staggering burden on public health, and often resists treatment, underscoring the need to develop a deeper understanding of the underlying neurobiology. The central extended amygdala (EAc)—including the bed nucleus of the stria terminalis (BST) and the central nucleus of the amygdala (Ce)—plays a key role in prominent neuroscientific models of alcohol drinking, but the relevance of these regions to acute alcohol consumption in humans remains unknown. Using a single-blind, randomized-groups design, multiband fMRI data were acquired from 49 social drinkers while they performed a well-established emotional faces paradigm after consuming alcohol or placebo. Relative to placebo, alcohol significantly dampened reactivity to emotional faces in the BST. To rigorously assess potential regional differences in activation, data were extracted from unbiased, anatomically predefined regions-of-interest. Analyses revealed similar levels of dampening in the BST and Ce. In short, alcohol transiently reduces reactivity to emotional faces and it does so similarly across the two major divisions of the human EAc. These observations reinforce the translational relevance of addiction models derived from preclinical work in rodents and provide insights into the neural systems most relevant to the consumption of alcohol and the initial development of alcohol abuse in humans.Subject species
homo sapiens
Modality
fMRI-BOLD
Analysis level
group
Cognitive paradigm (task)
emotion processing fMRI task paradigm
Map type
T
- C
Planning reference map heat and drinking fountain Cologne
- ckan.mobidatalab.eu
Updated Jun 1, 2023ShareFacebookTwitterEmailClick to copy linkLink copiedCiteRedaktion offenedaten-koeln (2023). Planning reference map heat and drinking fountain Cologne [Dataset]. https://ckan.mobidatalab.eu/dataset/planningreferencecard-heat-and-drinkingfountain-colognewfs, http://publications.europa.eu/resource/authority/file-type/json, wmsAvailable download formatsDataset updatedJun 1, 2023Dataset provided byRedaktion offenedaten-koelnLicenseData licence Germany - Zero - Version 2.0https://www.govdata.de/dl-de/zero-2-0
License information was derived automaticallyDescriptionThe heat planning information map is a climate analysis map that shows the urban climatic conditions to be expected in Cologne in the future as an extensive overview.
The identification of the climatically active areas is not specific to the parcel and is required for large-scale planning (e.g. development plans) an additional evaluation of the basic data on a detailed level.
The map is based on the calculations of the number of hot days for the period 2021 to 2050, which the German Weather Service simulated with the urban climate model MUKLIMO_3. The MUKLIMO-3 simulation based on the regional model CLM with the emission scenario A1B was selected to create the map. For the period from 2021 to 2050, there is a significant increase in heat stress compared to the reference period (1971 to 2000). For the city of Cologne, this means that longer periods of heat with temperatures over 25°C (summer days) and over 30°C (hot days) are occurring more frequently. The drinking fountains are shown as dot markers on the map that can be clicked on interactively or viewed in detail below.
- g
Map layer Fixed drinking water protection areas NRW | gimi9.com
- gimi9.com
+ more versionsShareFacebookTwitterEmailClick to copy linkLink copiedCiteMap layer Fixed drinking water protection areas NRW | gimi9.com [Dataset]. https://gimi9.com/dataset/eu_04296ddc-f524-4a03-8cc5-abb726f6d9a0/Area coveredNorth Rhine-WestphaliaDescriptionWater protected areas are established to ensure long-term public water supply. For the water produced in NRW mostly underground, groundwater protection areas, otherwise drinking water barrier protection areas are delineated. Water protected areas are divided into zones. This map layer shows the defined drinking water protection areas. In North Rhine-Westphalia, the district governments are responsible for the establishment of water protection areas according to their territorial competence.
PWS boundary and reg agency map
- gis.data.ca.gov
- calepa-dtsc.opendata.arcgis.com
Updated Apr 5, 2021ShareFacebookTwitterEmailClick to copy linkLink copiedCiteCalifornia Water Boards (2021). PWS boundary and reg agency map [Dataset]. https://gis.data.ca.gov/maps/8b525fb3a3604e45ba9ffffaabebb777Dataset updatedApr 5, 2021Dataset provided byCalifornia State Water Resources Control BoardAuthorsCalifornia Water BoardsArea coveredDescriptionUse Constraints:This mapping tool is for reference and guidance purposes only and is not a binding legal document to be used for legal determinations. The data provided may contain errors, inconsistencies, or may not in all cases appropriately represent the current boundaries of PWSs in California. The data in this map are subject to change at any time and should not be used as the sole source for decision making. By using this data, the user acknowledges all limitations of the data and agrees to accept all errors stemming from its use.Description:This mapping tool provides a representation of the general PWS boundaries for water service, wholesaler and jurisdictional areas. The boundaries were created originally by collection via crowd sourcing by CDPH through the Boundary Layer Tool, this tool was retired as of June 30, 2020. State Water Resources Control Board – Division of Drinking Water is currently in the process of verifying the accuracy of these boundaries and working on a tool for maintaining the current boundaries and collecting boundaries for PWS that were not in the original dataset. Currently, the boundaries are in most cases have not been verified. Map Layers· Drinking Water System Areas – representation of the general water system boundaries maintained by the State Water Board. This layer contains polygons with associated data on the water system and boundary the shape represents.· LPA office locations – represents the locations of the Local Primacy Agency overseeing the water system in that county. Address and contact information are attributes of this dataset.· LPA office locations – represents the locations of the Local Primacy Agency overseeing the water system in that county. Address and contact information are attributes of this dataset· California Senate Districts – represents the boundaries of the senate districts in California included as a reference layer in order to perform analysis with the Drinking Water System Boundaries layers.· California Senate Districts – represents the boundaries of the assembly districts in California included as a reference layer in order to perform analysis with the Drinking Water System Boundaries layers.· California County – represents the boundaries of the counties in California included as a reference layer in order to perform analysis with the Drinking Water System Boundaries layers.Informational Pop-up Box for Boundary layer· Water System No. – unique identifier for each water system· Water System Name – name of water system· Regulating Agency – agency overseeing the water system· System Type – classification of water system.· Population the approximate population served by the water system· Boundary Type – the type of water system boundary being displayed· Address Line 1 – the street or mailing address on file for the water system· Address Line 2 – additional line for street or mailing address on file for the water system, if applicable· City – city where water system located or receives mail· County – county where water system is located· Verification Status – the verification status of the water system boundary· Verified by – if the boundary is verified, the person responsible for the verification Date Created and Sources:This web app was most recently updated on July, 21, 2021. Each layer has a data created date and data source is indicated in the overview/metadata page and is valid up to the date provided.
FacebookTwitterAlcohol Consumption: Adults Who Binge Drink - CDPHE Community Level Estimates (Census Tracts)
These data represent the predicted (modeled) prevalence of Binge Drinking among adults (Age 18+) for each census tract in Colorado. Binge Drinking is defined for males as having five or more drinks on one occasion and for females as having four or more drinks on one occasion within the past 30 days. Binge Drinking is calculated from the number of days alcohol was consumed in the past 30 days, and the average number of drinks consumed on those days.The estimate for each census tract represents an average that was derived from multiple years of Colorado Behavioral Risk Factor Surveillance System data (2014-2017).CDPHE used a model-based approach to measure the relationship between age, race, gender, poverty, education, location and health conditions or risk behavior indicators and applied this relationship to predict the number of persons' who have the health conditions or risk behavior for each census tract in Colorado. We then applied these probabilities, based on demographic stratification, to the 2013-2017 American Community Survey population estimates and determined the percentage of adults with the health conditions or risk behavior for each census tract in Colorado.The estimates are based on statistical models and are not direct survey estimates. Using the best available data, CDPHE was able to model census tract estimates based on demographic data and background knowledge about the distribution of specific health conditions and risk behaviors.The estimates are displayed in both the map and data table using point estimate values for each census tract and displayed using a Quintile range. The high and low value for each color on the map is calculated based on dividing the total number of census tracts in Colorado (1249) into five groups based on the total range of estimates for all Colorado census tracts. Each Quintile range represents roughly 20% of the census tracts in Colorado. No estimates are provided for census tracts with a known population of less than 50. These census tracts are displayed in the map as "No Est, Pop < 50."No estimates are provided for 7 census tracts with a known population of less than 50 or for the 2 census tracts that exclusively contain a federal correctional institution as 100% of their population. These 9 census tracts are displayed in the map as "No Estimate."