Share of people with Alzheimer's disease in the U.S. by age group 2025
- statista.com
 Share
Share Facebook
 Twitter
 EmailClick to copy linkLink copiedCiteStatista, Share of people with Alzheimer's disease in the U.S. by age group 2025 [Dataset]. https://www.statista.com/statistics/452911/share-of-alzheimers-disease-patients-by-age-group-in-the-us/Time period covered2025Area coveredUnited StatesDescription
In the United States, around 39 percent of people with Alzheimer’s are 75 to 84 years old. Additionally, around 26 percent of those with Alzheimer’s are aged 65 to 74 years. Alzheimer’s disease is a form of dementia which impacts memory, behavior, and thinking and can lead to symptoms becoming so severe that those with the disease require support with basic daily tasks. Alzheimer’s remains a relevant problem around the world. Alzheimer’s disease deaths Alzheimer’s is currently the sixth leading cause of death in the United States, causing more deaths than diabetes and kidney disease. While advances in medicine and increased access to treatment and care have caused decreases in many major causes of death, deaths from Alzheimer’s have risen over the past couple of decades. For example, from 2000 to 2022, deaths from stroke in the U.S. declined by 1.4 percent, while deaths from Alzheimer’s increased 142 percent. Alzheimer’s disease worldwide Alzheimer’s is not only a problem in the United States but impacts every country around the globe. In 2018, there were an estimated 50 million people living with dementia worldwide. This figure is predicted to increase to some 152 million by the year 2050. Alzheimer’s does not only cause a significant amount of death but also has a significant economic impact. In 2018, cost estimates for Alzheimer’s care worldwide totaled around one trillion U.S. dollars, with this figure predicted to double by the year 2030.
Data_Sheet_1_Individualized network analysis: A novel approach to...
- frontiersin.figshare.com
pdfUpdated Jun 2, 2023ShareFacebookTwitterEmailClick to copy linkLink copiedCiteHillary Protas; Valentina Ghisays; Dhruman D. Goradia; Robert Bauer; Vivek Devadas; Kewei Chen; Eric M. Reiman; Yi Su (2023). Data_Sheet_1_Individualized network analysis: A novel approach to investigate tau PET using graph theory in the Alzheimer’s disease continuum.pdf [Dataset]. http://doi.org/10.3389/fnins.2023.1089134.s001pdfAvailable download formatsUnique identifierhttps://doi.org/10.3389/fnins.2023.1089134.s001Dataset updatedJun 2, 2023AuthorsHillary Protas; Valentina Ghisays; Dhruman D. Goradia; Robert Bauer; Vivek Devadas; Kewei Chen; Eric M. Reiman; Yi SuLicenseAttribution 4.0 (CC BY 4.0)https://creativecommons.org/licenses/by/4.0/
License information was derived automaticallyDescriptionIntroductionTau PET imaging has emerged as an important tool to detect and monitor tangle burden in vivo in the study of Alzheimer’s disease (AD). Previous studies demonstrated the association of tau burden with cognitive decline in probable AD cohorts. This study introduces a novel approach to analyze tau PET data by constructing individualized tau network structure and deriving its graph theory-based measures. We hypothesize that the network- based measures are a measure of the total tau load and the stage through disease.MethodsUsing tau PET data from the AD Neuroimaging Initiative from 369 participants, we determine the network measures, global efficiency, global strength, and limbic strength, and compare with two regional measures entorhinal and tau composite SUVR, in the ability to differentiate, cognitively unimpaired (CU), MCI and AD. We also investigate the correlation of these network and regional measures and a measure of memory performance, auditory verbal learning test for long-term recall memory (AVLT-LTM). Finally, we determine the stages based on global efficiency and limbic strength using conditional inference trees and compare with Braak staging.ResultsWe demonstrate that the derived network measures are able to differentiate three clinical stages of AD, CU, MCI, and AD. We also demonstrate that these network measures are strongly correlated with memory performance overall. Unlike regional tau measurements, the tau network measures were significantly associated with AVLT-LTM even in cognitively unimpaired individuals. Stages determined from global efficiency and limbic strength, visually resembled Braak staging.DiscussionThe strong correlations with memory particularly in CU suggest the proposed technique may be used to characterize subtle early tau accumulation. Further investigation is ongoing to examine this technique in a longitudinal setting.
Death rate due to Alzheimer's Disease in the U.S. 2000-2022
- statista.com
ShareFacebookTwitterEmailClick to copy linkLink copiedCiteStatista, Death rate due to Alzheimer's Disease in the U.S. 2000-2022 [Dataset]. https://www.statista.com/statistics/452945/mortality-rate-of-alzheimers-patients-in-the-us/Area coveredUnited StatesDescriptionIn 2022, the mortality rate due to Alzheimer's disease was 36 deaths per 100,000 people. This statistic displays the annual Alzheimer's disease mortality rate in the United States from 2000 to 2022. Scientists believe that early detection of Alzheimer's can be the best way to prevent or slow the course of the disease. Alzheimer’s disease Alzheimer’s disease, a progressive and incurable brain disease, is among the top ten leading causes of death in the U.S. as well as worldwide. Furthermore, over the past two decades, the number of deaths due to Alzheimer’s and other dementias in the United States increased by over 140 percent. As with other dementias, Alzheimer’s commonly affects older individuals, although it can be diagnosed earlier on in life. In the United States, the majority of people with Alzheimer’s disease are over 75 years of age. Initial symptoms include difficulties in memory and mood changes, but the disease gradually progresses to impair communication and judgment, behavioral changes, and deficits in movement and motor skills, such as difficulties with swallowing, which often becomes a contributing cause of death. Care and treatment The cost of care for individuals with Alzheimer’s is expected to increase over the next couple of decades, with costs to Medicare and Medicaid expected to reach 637 billion U.S. dollars by 2050. Due to the increasing burden of Alzheimer’s and other dementias on healthcare and social systems, research into treatment and prevention is a major focus. Several major pharmaceutical companies currently have multiple drugs for Alzheimer’s treatment in various stages of development; other research is focused on identifying early brain changes associated with the disease in order to provide early diagnosis and intervention. Furthermore, personal health strategies include reducing modifiable risk factors commonly associated with cardiovascular health, such as quitting smoking, maintaining a healthy diet, and staying socially, mentally, and physically active.
Table_2_Spatio-Semantic Graphs From Picture Description: Applications to...
- frontiersin.figshare.com
xlsxUpdated Jun 1, 2023ShareFacebookTwitterEmailClick to copy linkLink copiedCitePranav S. Ambadi; Kristin Basche; Rebecca L. Koscik; Visar Berisha; Julie M. Liss; Kimberly D. Mueller (2023). Table_2_Spatio-Semantic Graphs From Picture Description: Applications to Detection of Cognitive Impairment.XLSX [Dataset]. http://doi.org/10.3389/fneur.2021.795374.s002xlsxAvailable download formatsUnique identifierhttps://doi.org/10.3389/fneur.2021.795374.s002Dataset updatedJun 1, 2023AuthorsPranav S. Ambadi; Kristin Basche; Rebecca L. Koscik; Visar Berisha; Julie M. Liss; Kimberly D. MuellerLicenseAttribution 4.0 (CC BY 4.0)https://creativecommons.org/licenses/by/4.0/
License information was derived automaticallyDescriptionClinical assessments often use complex picture description tasks to elicit natural speech patterns and magnify changes occurring in brain regions implicated in Alzheimer's disease and dementia. As The Cookie Theft picture description task is used in the largest Alzheimer's disease and dementia cohort studies available, we aimed to create algorithms that could characterize the visual narrative path a participant takes in describing what is happening in this image. We proposed spatio-semantic graphs, models based on graph theory that transform the participants' narratives into graphs that retain semantic order and encode the visuospatial information between content units in the image. The resulting graphs differ between Cognitively Impaired and Unimpaired participants in several important ways. Cognitively Impaired participants consistently scored higher on features that are heavily associated with symptoms of cognitive decline, including repetition, evidence of short-term memory lapses, and generally disorganized narrative descriptions, while Cognitively Unimpaired participants produced more efficient narrative paths. These results provide evidence that spatio-semantic graph analysis of these tasks can generate important insights into a participant's cognitive performance that cannot be generated from semantic analysis alone.
- M
Alzheimer Disease Statistics 2025 By Employment, Diseases, Deaths
- media.market.us
Updated Jan 13, 2025+ more versionsShareFacebookTwitterEmailClick to copy linkLink copiedCiteMarket.us Media (2025). Alzheimer Disease Statistics 2025 By Employment, Diseases, Deaths [Dataset]. https://media.market.us/alzheimers-disease-statistics/Dataset updatedJan 13, 2025Dataset authored and provided byMarket.us MediaLicensehttps://media.market.us/privacy-policyhttps://media.market.us/privacy-policy
Time period covered2022 - 2032DescriptionIntroduction
Alzheimer Disease Statistics: Alzheimer's disease is a progressive neurodegenerative disorder that primarily affects the brain, leading to memory loss, cognitive decline, and behavioral changes.
It is the most common cause of dementia, accounting for approximately 60-80% of all dementia cases. Alzheimer's disease typically occurs in older adults, although it can also affect individuals in their 40s or 50s, known as early-onset Alzheimer's.
https://media.market.us/wp-content/uploads/2023/07/alzheimers-disease-statistics.jpg" alt="Alzheimers Disease Statistics" class="wp-image-17126">
Death Alzheimer's
- kaggle.com
zipUpdated May 16, 2024ShareFacebookTwitterEmailClick to copy linkLink copiedCitewillian oliveira (2024). Death Alzheimer's [Dataset]. https://www.kaggle.com/datasets/willianoliveiragibin/death-alzheimerszip(39631 bytes)Available download formatsDataset updatedMay 16, 2024Authorswillian oliveiraLicensehttps://creativecommons.org/publicdomain/zero/1.0/https://creativecommons.org/publicdomain/zero/1.0/
Descriptionhttps://www.googleapis.com/download/storage/v1/b/kaggle-user-content/o/inbox%2F16731800%2Fb75a86186a0014480c981c5182acc9ff%2Fgraph3.png?generation=1715898880551749&alt=media" alt="">this graph was created in Loocker studio,PowerBi,Tableau:
https://www.googleapis.com/download/storage/v1/b/kaggle-user-content/o/inbox%2F16731800%2Ff695c5f66d6851cf80797b7057ade08b%2Fgraph1.jpg?generation=1715898858448928&alt=media" alt="">
https://www.googleapis.com/download/storage/v1/b/kaggle-user-content/o/inbox%2F16731800%2F906461bf5b2ebc0f6bc6c806c9a1654e%2Fgraph2.jpg?generation=1715898864457964&alt=media" alt="">
Dementia patients show worsening cognitive function over time, beyond what might be expected from typical aging.
Dementia affects memory, thinking, orientation, comprehension, calculation, learning capacity, language, and judgment. This is commonly accompanied by changes in mood, emotional control, behavior, or motivation.
Deaths - Alzheimer's disease and other dementias - Sex: Both - Age: Age-standardized (Rate) Source Institute for Health Metrics and Evaluation, Global Burden of Disease (2019) – processed by Our World in Data Date range 1990–2019 Unit deaths per 100,000 people Links http://ghdx.healthdata.org/gbd-results-tool The data of this indicator is based on the following sources: Institute for Health Metrics and Evaluation, Global Burden of Disease (2019) Data published by Global Burden of Disease Collaborative Network. Global Burden of Disease Study 2019 (GBD 2019) Results. Seattle, United States: Institute for Health Metrics and Evaluation (IHME), 2021.
Retrieved on September 22, 2021 Retrieved from http://ghdx.healthdata.org/gbd-results-tool How we process data at Our World in Data: All data and visualizations on Our World in Data rely on data sourced from one or several original data providers. Preparing this original data involves several processing steps. Depending on the data, this can include standardizing country names and world region definitions, converting units, calculating derived indicators such as per capita measures, as well as adding or adapting metadata such as the name or the description given to an indicator.
At the link below you can find a detailed description of the structure of our data pipeline, including links to all the code used to prepare data across Our World in Data.
Read about our data pipeline How to cite this data: In-line citation If you have limited space (e.g. in data visualizations), you can use this abbreviated in-line citation:
Institute for Health Metrics and Evaluation, Global Burden of Disease (2019) – processed by Our World in Data
Full citation
Institute for Health Metrics and Evaluation, Global Burden of Disease (2019) – processed by Our World in Data. “Deaths - Alzheimer's disease and other dementias - Sex: Both - Age: Age-standardized (Rate)” [dataset]. Institute for Health Metrics and Evaluation, Global Burden of Disease (2019) [original data].
Total Alzheimer's disease funding by National Institutes for Health...
- statista.com
Updated May 17, 2024ShareFacebookTwitterEmailClick to copy linkLink copiedCiteStatista (2024). Total Alzheimer's disease funding by National Institutes for Health 2013-2025 [Dataset]. https://www.statista.com/statistics/716573/alzheimer-s-disease-funding-by-the-national-institutes-for-health/Dataset updatedMay 17, 2024Area coveredUnited StatesDescriptionAlzheimer's disease funding by the NIH was around 3.5 billion U.S. dollars in fiscal year 2023. This graph shows the actual Alzheimer's disease funding by the National Institutes for Health (NIH) from FY 2013 to FY 2023 and estimates for FY 2024 and FY 2025.
Data_Sheet_1_Identifying discriminative features of brain network for...
- frontiersin.figshare.com
docxUpdated Jun 18, 2024ShareFacebookTwitterEmailClick to copy linkLink copiedCiteS. M. Shayez Karim; Md Shah Fahad; R. S. Rathore (2024). Data_Sheet_1_Identifying discriminative features of brain network for prediction of Alzheimer’s disease using graph theory and machine learning.docx [Dataset]. http://doi.org/10.3389/fninf.2024.1384720.s001docxAvailable download formatsUnique identifierhttps://doi.org/10.3389/fninf.2024.1384720.s001Dataset updatedJun 18, 2024AuthorsS. M. Shayez Karim; Md Shah Fahad; R. S. RathoreLicenseAttribution 4.0 (CC BY 4.0)https://creativecommons.org/licenses/by/4.0/
License information was derived automaticallyDescriptionAlzheimer’s disease (AD) is a challenging neurodegenerative condition, necessitating early diagnosis and intervention. This research leverages machine learning (ML) and graph theory metrics, derived from resting-state functional magnetic resonance imaging (rs-fMRI) data to predict AD. Using Southwest University Adult Lifespan Dataset (SALD, age 21–76 years) and the Open Access Series of Imaging Studies (OASIS, age 64–95 years) dataset, containing 112 participants, various ML models were developed for the purpose of AD prediction. The study identifies key features for a comprehensive understanding of brain network topology and functional connectivity in AD. Through a 5-fold cross-validation, all models demonstrate substantial predictive capabilities (accuracy in 82–92% range), with the support vector machine model standing out as the best having an accuracy of 92%. Present study suggests that top 13 regions, identified based on most important discriminating features, have lost significant connections with thalamus. The functional connection strengths were consistently declined for substantia nigra, pars reticulata, substantia nigra, pars compacta, and nucleus accumbens among AD subjects as compared to healthy adults and aging individuals. The present finding corroborate with the earlier studies, employing various neuroimagining techniques. This research signifies the translational potential of a comprehensive approach integrating ML, graph theory and rs-fMRI analysis in AD prediction, offering potential biomarker for more accurate diagnostics and early prediction of AD.
Medicare and Medicaid costs from individuals with Alzheimer's in the U.S....
- statista.com
Updated Nov 29, 2025ShareFacebookTwitterEmailClick to copy linkLink copiedCiteStatista (2025). Medicare and Medicaid costs from individuals with Alzheimer's in the U.S. 2024-2050 [Dataset]. https://www.statista.com/statistics/643072/alzheimers-medicare-medicaid-care-costs-us/Dataset updatedNov 29, 2025Area coveredUnited StatesDescriptionIn 2024, Alzheimer's disease was estimated to cost Medicare and Medicaid around 231 billion dollars in care costs. This number is expected to grow to 637 billion dollars by 2050. This graph presents the costs of care for individuals with Alzheimer's disease to Medicare and Medicaid in the U.S. from 2024 to 2050.
PharmKG: A Dedicated Knowledge Graph Benchmark for Biomedical Data Mining
- zenodo.org
- data.niaid.nih.gov
- +1more
zipUpdated Feb 9, 2021ShareFacebookTwitterEmailClick to copy linkLink copiedCiteShuangjia Zheng; Jiahua Rao; Ying Song; Jixian Zhang; Xianglu Xiao; Evandro Fei Fang; Yuedong Yang; Zhangming Niu; Shuangjia Zheng; Jiahua Rao; Ying Song; Jixian Zhang; Xianglu Xiao; Evandro Fei Fang; Yuedong Yang; Zhangming Niu (2021). PharmKG: A Dedicated Knowledge Graph Benchmark for Biomedical Data Mining [Dataset]. http://doi.org/10.5281/zenodo.4077338zipAvailable download formatsUnique identifierhttps://doi.org/10.5281/zenodo.4077338Dataset updatedFeb 9, 2021AuthorsShuangjia Zheng; Jiahua Rao; Ying Song; Jixian Zhang; Xianglu Xiao; Evandro Fei Fang; Yuedong Yang; Zhangming Niu; Shuangjia Zheng; Jiahua Rao; Ying Song; Jixian Zhang; Xianglu Xiao; Evandro Fei Fang; Yuedong Yang; Zhangming NiuLicenseAttribution 4.0 (CC BY 4.0)https://creativecommons.org/licenses/by/4.0/
License information was derived automaticallyDescriptionBiomedical knowledge graphs, which can help with the understanding of complex biological systems and pathologies, have begun to play a critical role in medical practice and research. However, challenges remain in their embedding and use due to their complex nature and the specific demands of their construction. Existing studies often suffer from problems such as sparse and noisy datasets, insufficient modeling methods, and non-uniform evaluation metrics.
In this work, we established a comprehensive knowledge graph (KG) system for the biomedical field in an attempt to bridge the gap. Here we introduced PharmKG, a multi-relational, attributed biomedical knowledge graph, composed of more than 500,000 individual interconnections between genes, drugs, and diseases, with 29 relation types over a vocabulary of ~8,000 disambiguated entities. Each entity in PharmKG is attached with heterogeneous, domain-specific information obtained from multi-omics data, i.e. gene expression, chemical structure, and disease word embedding, while preserving the semantic and biomedical features. For baselines, we offered 9 state-of-the-art knowledge graph embedding (KGE) approaches and a new biological, intuitive, graph neural network-based KGE method that uses a combination of both global network structure and heterogeneous domain features. Based on the proposed benchmark, we conducted extensive experiments to assess these KGE models using multiple evaluation metrics. Finally, we discussed our observations across various downstream biological tasks and provide insights and guidelines for how to use a knowledge graph in biomedicine. We hope that the unprecedented quality and diversity of PharmKG will lead to advances in biomedical knowledge graph construction, embedding and application.
- h
alzheimerdiseasedb
- huggingface.co
Updated Sep 29, 2025ShareFacebookTwitterEmailClick to copy linkLink copiedCiteAna Bossler (2025). alzheimerdiseasedb [Dataset]. https://huggingface.co/datasets/annabossler/alzheimerdiseasedbDataset updatedSep 29, 2025AuthorsAna BosslerLicenseAttribution 4.0 (CC BY 4.0)https://creativecommons.org/licenses/by/4.0/
License information was derived automaticallyDescriptionOpenAlex API data on Alzheimer Disease. Nodes and Edges stored in Neo4j.
- e
Journal of Alzheimer's Disease - if-computation
- exaly.com
csv, jsonUpdated Nov 1, 2025+ more versionsShareFacebookTwitterEmailClick to copy linkLink copiedCite(2025). Journal of Alzheimer's Disease - if-computation [Dataset]. https://exaly.com/journal/13782/journal-of-alzheimers-disease/impact-factorcsv, jsonAvailable download formatsDataset updatedNov 1, 2025LicenseAttribution-ShareAlike 4.0 (CC BY-SA 4.0)https://creativecommons.org/licenses/by-sa/4.0/
License information was derived automaticallyDescriptionThis graph shows how the impact factor of ^ is computed. The left axis depicts the number of papers published in years X-1 and X-2, and the right axis displays their citations in year X.
- f
Data_Sheet_1_A Graph Theory Approach to Clarifying Aging and Disease Related...
- figshare.com
pdfUpdated Jun 9, 2023ShareFacebookTwitterEmailClick to copy linkLink copiedCiteLaura M. Wright; Matteo De Marco; Annalena Venneri (2023). Data_Sheet_1_A Graph Theory Approach to Clarifying Aging and Disease Related Changes in Cognitive Networks.pdf [Dataset]. http://doi.org/10.3389/fnagi.2021.676618.s001pdfAvailable download formatsUnique identifierhttps://doi.org/10.3389/fnagi.2021.676618.s001Dataset updatedJun 9, 2023Dataset provided byFrontiersAuthorsLaura M. Wright; Matteo De Marco; Annalena VenneriLicenseAttribution 4.0 (CC BY 4.0)https://creativecommons.org/licenses/by/4.0/
License information was derived automaticallyDescriptionIn accordance with the physiological networks that underlie it, human cognition is characterized by both the segregation and interdependence of a number of cognitive domains. Cognition itself, therefore, can be conceptualized as a network of functions. A network approach to cognition has previously revealed topological differences in cognitive profiles between healthy and disease populations. The present study, therefore, used graph theory to determine variation in cognitive profiles across healthy aging and cognitive impairment. A comprehensive neuropsychological test battery was administered to 415 participants. This included three groups of healthy adults aged 18–39 (n = 75), 40–64 (n = 75), and 65 and over (n = 70) and three patient groups with either amnestic (n = 75) or non-amnestic (n = 60) mild cognitive impairment or Alzheimer’s type dementia (n = 60). For each group, cognitive networks were created reflective of test-to-test covariance, in which nodes represented cognitive tests and edges reflected statistical inter-nodal significance (p < 0.05). Network metrics were derived using the Brain Connectivity Toolbox. Network-wide clustering, local efficiency and global efficiency of nodes showed linear differences across the stages of aging, being significantly higher among older adults when compared with younger groups. Among patients, these metrics were significantly higher again when compared with healthy older controls. Conversely, average betweenness centralities were highest in middle-aged participants and lower among older adults and patients. In particular, compared with controls, patients demonstrated a distinct lack of centrality in the domains of semantic processing and abstract reasoning. Network composition in the amnestic mild cognitive impairment group was similar to the network of Alzheimer’s dementia patients. Using graph theoretical methods, this study demonstrates that the composition of cognitive networks may be measurably altered by the aging process and differentially impacted by pathological cognitive impairment. Network alterations characteristic of Alzheimer’s disease in particular may occur early and be distinct from alterations associated with differing types of cognitive impairment. A shift in centrality between domains may be particularly relevant in identifying cognitive profiles indicative of underlying disease. Such techniques may contribute to the future development of more sophisticated diagnostic tools for neurodegenerative disease.
Age-specific mortality rate of alzheimer's disease at all ages in Canada...
- statista.com
ShareFacebookTwitterEmailClick to copy linkLink copiedCiteStatista, Age-specific mortality rate of alzheimer's disease at all ages in Canada 2000-2023 [Dataset]. https://www.statista.com/statistics/434435/death-rate-for-alzheimer-s-disease-in-canada/Area coveredCanadaDescriptionIn 2023, the age-specific mortality rate of alzheimer's disease at all ages in Canada stood at 13.1. Between 2000 and 2023, the figure dropped by 3.2, though the decline followed an uneven course rather than a steady trajectory.
- N
Specific and disease stage-dependent episodic memory-related brain...
- neurovault.org
niftiUpdated Jun 30, 2018+ more versionsShareFacebookTwitterEmailClick to copy linkLink copiedCite(2018). Specific and disease stage-dependent episodic memory-related brain activation patterns in Alzheimer’s disease: a coordinate-based meta-analysis: Figure 2 - MCIniftiAvailable download formatsUnique identifierhttps://identifiers.org/neurovault.image:12157Dataset updatedJun 30, 2018LicenseCC0 1.0 Universal Public Domain Dedicationhttps://creativecommons.org/publicdomain/zero/1.0/
License information was derived automaticallyDescriptionDecreased right insula and inferior frontal gyrus activation in MCI patients compared to age-matched control subjects during verbal episodic-memory retrieval tasks.
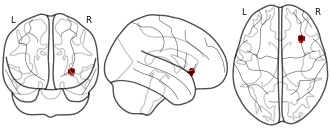
Collection description
This is a coordinate-based whole-brain meta-analysis of 28 functional magnetic resonance imaging (fMRI) studies with episodic memory tasks. Brain activation patterns represent commonalities of between-group differences of mild cognitive impairment (MCI) or Alzheimer's-type dementia (AD) patients, respectively, contrasted to age-matched control subjects. This dataset was automatically imported from the ANIMA <http://anima.modelgui.org/> database. Version: 1
Subject species
homo sapiens
Modality
fMRI-BOLD
Analysis level
meta-analysis
Cognitive paradigm (task)
None / Other
Map type
T
- e
Advances in Alzheimer's Disease - impact-factor
- exaly.com
csv, jsonUpdated Nov 1, 2025ShareFacebookTwitterEmailClick to copy linkLink copiedCite(2025). Advances in Alzheimer's Disease - impact-factor [Dataset]. https://exaly.com/journal/45263/advances-in-alzheimers-diseasejson, csvAvailable download formatsDataset updatedNov 1, 2025LicenseAttribution-ShareAlike 4.0 (CC BY-SA 4.0)https://creativecommons.org/licenses/by-sa/4.0/
License information was derived automaticallyDescriptionThe graph shows the changes in the impact factor of ^ and its corresponding percentile for the sake of comparison with the entire literature. Impact Factor is the most common scientometric index, which is defined by the number of citations of papers in two preceding years divided by the number of papers published in those years.
Data_Sheet_1_Explaining graph convolutional network predictions for...
- frontiersin.figshare.com
pdfUpdated Jan 8, 2024ShareFacebookTwitterEmailClick to copy linkLink copiedCiteSule Tekkesinoglu; Sara Pudas (2024). Data_Sheet_1_Explaining graph convolutional network predictions for clinicians—An explainable AI approach to Alzheimer's disease classification.PDF [Dataset]. http://doi.org/10.3389/frai.2023.1334613.s001pdfAvailable download formatsUnique identifierhttps://doi.org/10.3389/frai.2023.1334613.s001Dataset updatedJan 8, 2024AuthorsSule Tekkesinoglu; Sara PudasLicenseAttribution 4.0 (CC BY 4.0)https://creativecommons.org/licenses/by/4.0/
License information was derived automaticallyDescriptionIntroductionGraph-based representations are becoming more common in the medical domain, where each node defines a patient, and the edges signify associations between patients, relating individuals with disease and symptoms in a node classification task. In this study, a Graph Convolutional Networks (GCN) model was utilized to capture differences in neurocognitive, genetic, and brain atrophy patterns that can predict cognitive status, ranging from Normal Cognition (NC) to Mild Cognitive Impairment (MCI) and Alzheimer's Disease (AD), on the Alzheimer's Disease Neuroimaging Initiative (ADNI) database. Elucidating model predictions is vital in medical applications to promote clinical adoption and establish physician trust. Therefore, we introduce a decomposition-based explanation method for individual patient classification.MethodsOur method involves analyzing the output variations resulting from decomposing input values, which allows us to determine the degree of impact on the prediction. Through this process, we gain insight into how each feature from various modalities, both at the individual and group levels, contributes to the diagnostic result. Given that graph data contains critical information in edges, we studied relational data by silencing all the edges of a particular class, thereby obtaining explanations at the neighborhood level.ResultsOur functional evaluation showed that the explanations remain stable with minor changes in input values, specifically for edge weights exceeding 0.80. Additionally, our comparative analysis against SHAP values yielded comparable results with significantly reduced computational time. To further validate the model's explanations, we conducted a survey study with 11 domain experts. The majority (71%) of the responses confirmed the correctness of the explanations, with a rating of above six on a 10-point scale for the understandability of the explanations.DiscussionStrategies to overcome perceived limitations, such as the GCN's overreliance on demographic information, were discussed to facilitate future adoption into clinical practice and gain clinicians' trust as a diagnostic decision support system.
- Y
Citation Network Graph
- shibatadb.com
Updated Dec 6, 2018ShareFacebookTwitterEmailClick to copy linkLink copiedCiteYubetsu (2018). Citation Network Graph [Dataset]. https://www.shibatadb.com/article/Pz9dJT69Dataset updatedDec 6, 2018Dataset authored and provided byYubetsuLicensehttps://www.shibatadb.com/license/data/proprietary/v1.0/license.txthttps://www.shibatadb.com/license/data/proprietary/v1.0/license.txt
DescriptionNetwork of 45 papers and 62 citation links related to "N-Acetylcysteine Prevents the Spatial Memory Deficits and the Redox-Dependent RyR2 Decrease Displayed by an Alzheimer’s Disease Rat Model".
- f
Table_1_Structural Network Efficiency Predicts Resilience to Cognitive...
- datasetcatalog.nlm.nih.gov
- frontiersin.figshare.com
Updated Feb 22, 2021ShareFacebookTwitterEmailClick to copy linkLink copiedCiteFellgiebel, Andreas; Fischer, Florian U.; Initiative, on behalf of Alzheimer’s Disease Neuroimaging; Tüscher, Oliver; Wolf, Dominik (2021). Table_1_Structural Network Efficiency Predicts Resilience to Cognitive Decline in Elderly at Risk for Alzheimer’s Disease.DOCX [Dataset]. https://datasetcatalog.nlm.nih.gov/dataset?q=0000786620Dataset updatedFeb 22, 2021AuthorsFellgiebel, Andreas; Fischer, Florian U.; Initiative, on behalf of Alzheimer’s Disease Neuroimaging; Tüscher, Oliver; Wolf, DominikDescriptionIntroduction: Functional imaging studies have demonstrated the recruitment of additional neural resources as a possible mechanism to compensate for age and Alzheimer’s disease (AD)-related cerebral pathology, the efficacy of which is potentially modulated by underlying structural network connectivity. Additionally, structural network efficiency (SNE) is associated with intelligence across the lifespan, which is a known factor for resilience to cognitive decline. We hypothesized that SNE may be a surrogate of the physiological basis of resilience to cognitive decline in elderly persons without dementia and with age- and AD-related cerebral pathology.Methods: We included 85 cognitively normal elderly subjects or mild cognitive impairment (MCI) patients submitted to baseline diffusion imaging, liquor specimens, amyloid-PET and longitudinal cognitive assessments. SNE was calculated from baseline MRI scans using fiber tractography and graph theory. Mixed linear effects models were estimated to investigate the association of higher resilience to cognitive decline with higher SNE and the modulation of this association by increased cerebral amyloid, liquor tau or WMHV. Results: For the majority of cognitive outcome measures, higher SNE was associated with higher resilience to cognitive decline (p-values: 0.011–0.039). Additionally, subjects with higher SNE showed more resilience to cognitive decline at higher cerebral amyloid burden (p-values: <0.001–0.036) and lower tau levels (p-values: 0.002–0.015).Conclusion: These results suggest that SNE to some extent may quantify the physiological basis of resilience to cognitive decline most effective at the earliest stages of AD, namely at increased amyloid burden and before increased tauopathy.
- f
Table_1_Cognitive Reserve Relates to Functional Network Efficiency in...
- datasetcatalog.nlm.nih.gov
- frontiersin.figshare.com
Updated Aug 21, 2018ShareFacebookTwitterEmailClick to copy linkLink copiedCitede Ligo Teixeira, Camila Vieira; de Campos, Brunno Machado; Mac Knight Carletti-Cassani, Ana Flávia; Weiler, Marina; Forlenza, Orestes Vicente; Vicentini, Jéssica Elias; Casseb, Raphael Fernandes; Castellano, Gabriela; Magalhães, Thamires Naela Cardoso; Balthazar, Marcio Luiz Figueredo; de Almeira, Débora Queiroz; Talib, Leda Leme (2018). Table_1_Cognitive Reserve Relates to Functional Network Efficiency in Alzheimer’s Disease.docx [Dataset]. https://datasetcatalog.nlm.nih.gov/dataset?q=0000642597Dataset updatedAug 21, 2018Authorsde Ligo Teixeira, Camila Vieira; de Campos, Brunno Machado; Mac Knight Carletti-Cassani, Ana Flávia; Weiler, Marina; Forlenza, Orestes Vicente; Vicentini, Jéssica Elias; Casseb, Raphael Fernandes; Castellano, Gabriela; Magalhães, Thamires Naela Cardoso; Balthazar, Marcio Luiz Figueredo; de Almeira, Débora Queiroz; Talib, Leda LemeDescriptionAlzheimer’s disease (AD) is the most common form of dementia, with no means of cure or prevention. The presence of abnormal disease-related proteins in the population is, in turn, much more common than the incidence of dementia. In this context, the cognitive reserve (CR) hypothesis has been proposed to explain the discontinuity between pathophysiological and clinical expression of AD, suggesting that CR mitigates the effects of pathology on clinical expression and cognition. fMRI studies of the human connectome have recently reported that AD patients present diminished functional efficiency in resting-state networks, leading to a loss in information flow and cognitive processing. No study has investigated, however, whether CR modifies the effects of the pathology in functional network efficiency in AD patients. We analyzed the relationship between CR, pathophysiology and network efficiency, and whether CR modifies the relationship between them. Fourteen mild AD, 28 amnestic mild cognitive impairment (aMCI) due to AD, and 28 controls were enrolled. We used education to measure CR, cerebrospinal fluid (CSF) biomarkers to evaluate pathophysiology, and graph metrics to measure network efficiency. We found no relationship between CR and CSF biomarkers; CR was related to higher network efficiency in all groups; and abnormal levels of CSF protein biomarkers were related to more efficient networks in the AD group. Education modified the effects of tau-related pathology in the aMCI and mild AD groups. Although higher CR might not protect individuals from developing AD pathophysiology, AD patients with higher CR are better able to cope with the effects of pathology—presenting more efficient networks despite pathology burden. The present study highlights that interventions focusing on cognitive stimulation might be useful to slow age-related cognitive decline or dementia and lengthen healthy aging.
FacebookTwitterIn the United States, around 39 percent of people with Alzheimer’s are 75 to 84 years old. Additionally, around 26 percent of those with Alzheimer’s are aged 65 to 74 years. Alzheimer’s disease is a form of dementia which impacts memory, behavior, and thinking and can lead to symptoms becoming so severe that those with the disease require support with basic daily tasks. Alzheimer’s remains a relevant problem around the world. Alzheimer’s disease deaths Alzheimer’s is currently the sixth leading cause of death in the United States, causing more deaths than diabetes and kidney disease. While advances in medicine and increased access to treatment and care have caused decreases in many major causes of death, deaths from Alzheimer’s have risen over the past couple of decades. For example, from 2000 to 2022, deaths from stroke in the U.S. declined by 1.4 percent, while deaths from Alzheimer’s increased 142 percent. Alzheimer’s disease worldwide Alzheimer’s is not only a problem in the United States but impacts every country around the globe. In 2018, there were an estimated 50 million people living with dementia worldwide. This figure is predicted to increase to some 152 million by the year 2050. Alzheimer’s does not only cause a significant amount of death but also has a significant economic impact. In 2018, cost estimates for Alzheimer’s care worldwide totaled around one trillion U.S. dollars, with this figure predicted to double by the year 2030.