Percentage of obese U.S. adults by state 2023
- statista.com
Updated Oct 28, 2024 Share
Share Facebook
 Twitter
 EmailClick to copy linkLink copiedCiteStatista (2024). Percentage of obese U.S. adults by state 2023 [Dataset]. https://www.statista.com/statistics/378988/us-obesity-rate-by-state/Dataset updatedOct 28, 2024Time period covered2023Area coveredUnited StatesDescription
West Virginia, Mississippi, and Arkansas are the U.S. states with the highest percentage of their population who are obese. The states with the lowest percentage of their population who are obese include Colorado, Hawaii, and Massachusetts. Obesity in the United States Obesity is a growing problem in many countries around the world, but the United States has the highest rate of obesity among all OECD countries. The prevalence of obesity in the United States has risen steadily over the previous two decades, with no signs of declining. Obesity in the U.S. is more common among women than men, and overweight and obesity rates are higher among African Americans than any other race or ethnicity. Causes and health impacts Obesity is most commonly the result of a combination of poor diet, overeating, physical inactivity, and a genetic susceptibility. Obesity is associated with various negative health impacts, including an increased risk of cardiovascular diseases, certain types of cancer, and diabetes type 2. As of 2022, around 8.4 percent of the U.S. population had been diagnosed with diabetes. Diabetes is currently the eighth leading cause of death in the United States.
Overweight and obesity in the U.S. by leading states 2018
- statista.com
Updated Feb 17, 2022ShareFacebookTwitterEmailClick to copy linkLink copiedCiteStatista (2022). Overweight and obesity in the U.S. by leading states 2018 [Dataset]. https://www.statista.com/statistics/266152/people-who-are-overweight-or-obese-in-selected-us-states/Dataset updatedFeb 17, 2022Time period covered2018Area coveredUnited StatesDescriptionIn Mississippi, over seven out of ten adults were reported to be either overweight or obese in 2018, making it the leading U.S. state that year. Other prominent states, in terms of overweight and obesity, included Arkansas in fourth, Oklahoma in seventh, and Louisiana in tenth place.
Corpulence per state
When it comes to obesity, specifically, percentages were still very high for certain states. Almost forty percent of West Virginia’s population was obese in 2018. Colorado, Hawaii, and California were some of the healthier states that year, with obesity rates between 22 and 25 percent. The average for the country itself stood at just over 31 percent.
Obesity-related health problems
Being obese can lead to various health-related complications, such as diabetes and diseases of the heart. In 2017, almost 22 people per 100,000 died of diabetes mellitus in the United States. In the same year, roughly 165 per 100,000 Americans died of heart disease. While the number of deaths caused by heart disease has decreased significantly over the past sixty to seventy years, it is still one of the leading causes of death in the country.
Normal weight, overweight, and obesity among adults aged 20 and over, by...
- healthdata.gov
- data.virginia.gov
- +3more
application/rdfxml +5Updated Jun 16, 2021+ more versionsShareFacebookTwitterEmailClick to copy linkLink copiedCitedata.cdc.gov (2021). Normal weight, overweight, and obesity among adults aged 20 and over, by selected characteristics: United States [Dataset]. https://healthdata.gov/dataset/Normal-weight-overweight-and-obesity-among-adults-/c8wy-f8arjson, csv, application/rssxml, xml, application/rdfxml, tsvAvailable download formatsDataset updatedJun 16, 2021Dataset provided bydata.cdc.govArea coveredUnited StatesDescriptionData on normal weight, overweight, and obesity among adults aged 20 and over by selected population characteristics. Please refer to the PDF or Excel version of this table in the HUS 2019 Data Finder (https://www.cdc.gov/nchs/hus/contents2019.htm) for critical information about measures, definitions, and changes over time.
SOURCE: NCHS, National Health and Nutrition Examination Survey. For more information on the National Health and Nutrition Examination Survey, see the corresponding Appendix entry at https://www.cdc.gov/nchs/data/hus/hus19-appendix-508.pdf.
U.S. states with highest rates of obesity among women 2022
- statista.com
Updated May 21, 2024ShareFacebookTwitterEmailClick to copy linkLink copiedCiteStatista (2024). U.S. states with highest rates of obesity among women 2022 [Dataset]. https://www.statista.com/statistics/665383/states-with-highest-rate-of-obese-females-in-us/Dataset updatedMay 21, 2024Time period covered2022Area coveredUnited StatesDescriptionIn 2022, the U.S. states with the highest rates of obesity among women were Tennessee, Louisiana, and Mississippi. At that time, almost 43 percent of women in Tennessee were considered obese. The states with the highest rates of obesity among men are West Virginia, Kentucky, and Oklahoma. Obesity: Women vs. men As of 2022, women in the United States had slightly higher rates of obesity than men. At that time, around 34.1 percent of women were considered obese, compared to 32.6 percent of men. Rates of obesity among both men and women are higher in the United States than any other OECD country, with high-calorie diets, often from fast food and sugary drinks, and large food portion sizes being partly to blame. In 2023, the mean self-reported weight among men in the United States was 199 pounds, while women reported weighing an average of 164 pounds. Which state is the most obese? As of 2022, West Virginia had the highest prevalence of adult obesity in the United States, with around 41 percent of the population considered obese. Following West Virginia, Louisiana, Oklahoma, and Mississippi, had some of the highest rates of obesity in the country. Colorado had the lowest share of adults who were obese at that time, but still, a quarter of adults in the state were obese. West Virginia is also the state with the highest prevalence of obesity among high school students, with 27 percent of high schoolers considered obese in 2021. Obesity in childhood is associated with obesity as adults, as well as mental health problems such as anxiety and depression.
Adult obesity rates in the U.S. by race/ethnicity 2023
- statista.com
Updated Nov 28, 2024ShareFacebookTwitterEmailClick to copy linkLink copiedCiteStatista (2024). Adult obesity rates in the U.S. by race/ethnicity 2023 [Dataset]. https://www.statista.com/statistics/207436/overweight-and-obesity-rates-for-adults-by-ethnicity/Dataset updatedNov 28, 2024Time period covered2023Area coveredUnited StatesDescriptionIn 2023, Black adults had the highest obesity rates of any race or ethnicity in the United States, followed by American Indians/Alaska Natives and Hispanics. As of that time, around 42 percent of all Black adults were obese. Asians/Pacific Islanders had by far the lowest obesity rates. Obesity in the United States Obesity is a present and growing problem in the United States. An astonishing 33 percent of the adult population in the U.S. is now considered obese. Obesity rates can vary substantially by state, with around 41 percent of the adult population in West Virginia reportedly obese, compared to 25 percent of adults in Colorado. The states with the highest rates of obesity include West Virginia, Mississippi, and Arkansas. Diabetes Being overweight and obese can lead to a number of health problems, including heart disease, cancer, and diabetes. Being overweight or obese is one of the most common causes of type 2 diabetes, a condition in which the body does not use insulin properly, causing blood sugar levels to rise. It is estimated that just over eight percent of adults in the U.S. have been diagnosed with diabetes. Diabetes is now the eighth leading cause of death in the United States, accounting for three percent of all deaths.
U.S. adult obesity prevalence in 2023, by annual income
- statista.com
Updated Nov 28, 2024ShareFacebookTwitterEmailClick to copy linkLink copiedCiteStatista (2024). U.S. adult obesity prevalence in 2023, by annual income [Dataset]. https://www.statista.com/statistics/237141/us-obesity-by-annual-income/Dataset updatedNov 28, 2024Time period covered2023Area coveredUnited StatesDescriptionIn 2023, it was estimated that around 37 percent of adults with an annual income of less than 15,000 U.S. dollars were obese, compared to 29 percent of those with an annual income of 75,000 dollars or more. This statistic shows the percentage of U.S. adults who were obese in 2023, by income.
- U
United States US: Prevalence of Overweight: Weight for Height: Female: % of...
- ceicdata.com
Updated Feb 15, 2025ShareFacebookTwitterEmailClick to copy linkLink copiedCiteUnited States US: Prevalence of Overweight: Weight for Height: Female: % of Children Under 5 [Dataset]. https://www.ceicdata.com/en/united-states/health-statistics/us-prevalence-of-overweight-weight-for-height-female--of-children-under-5Dataset updatedFeb 15, 2025Dataset provided byCEICdata.comLicenseAttribution 4.0 (CC BY 4.0)https://creativecommons.org/licenses/by/4.0/
License information was derived automaticallyTime period coveredDec 1, 1991 - Dec 1, 2012Area coveredUnited StatesDescriptionUnited States US: Prevalence of Overweight: Weight for Height: Female: % of Children Under 5 data was reported at 6.900 % in 2012. This records an increase from the previous number of 6.400 % for 2009. United States US: Prevalence of Overweight: Weight for Height: Female: % of Children Under 5 data is updated yearly, averaging 6.900 % from Dec 1991 (Median) to 2012, with 6 observations. The data reached an all-time high of 8.700 % in 2005 and a record low of 5.100 % in 1991. United States US: Prevalence of Overweight: Weight for Height: Female: % of Children Under 5 data remains active status in CEIC and is reported by World Bank. The data is categorized under Global Database’s USA – Table US.World Bank: Health Statistics. Prevalence of overweight, female, is the percentage of girls under age 5 whose weight for height is more than two standard deviations above the median for the international reference population of the corresponding age as established by the WHO's new child growth standards released in 2006.; ; World Health Organization, Global Database on Child Growth and Malnutrition. Country-level data are unadjusted data from national surveys, and thus may not be comparable across countries.; Linear mixed-effect model estimates; Estimates of overweight children are also from national survey data. Once considered only a high-income economy problem, overweight children have become a growing concern in developing countries. Research shows an association between childhood obesity and a high prevalence of diabetes, respiratory disease, high blood pressure, and psychosocial and orthopedic disorders (de Onis and Blössner 2003). Childhood obesity is associated with a higher chance of obesity, premature death, and disability in adulthood. In addition to increased future risks, obese children experience breathing difficulties and increased risk of fractures, hypertension, early markers of cardiovascular disease, insulin resistance, and psychological effects. Children in low- and middle-income countries are more vulnerable to inadequate nutrition before birth and in infancy and early childhood. Many of these children are exposed to high-fat, high-sugar, high-salt, calorie-dense, micronutrient-poor foods, which tend be lower in cost than more nutritious foods. These dietary patterns, in conjunction with low levels of physical activity, result in sharp increases in childhood obesity, while under-nutrition continues
U.S. adults average self-reported weight from 1990 to 2024
- statista.com
Updated Mar 10, 2025ShareFacebookTwitterEmailClick to copy linkLink copiedCiteStatista (2025). U.S. adults average self-reported weight from 1990 to 2024 [Dataset]. https://www.statista.com/statistics/1305115/us-adults-average-self-reported-weight-by-gender/Dataset updatedMar 10, 2025Area coveredUnited StatesDescriptionSurveys in which U.S. adults report their current weight have shown that the share of those reporting they weigh 200 pounds or more has increased over the past few decades. In 2024, around 28 percent of respondents reported their weight as 200 pounds or more, compared to 15 percent in 1990. However, the same surveys show the share of respondents who report they are overweight has decreased compared to figures from 1990. What percentage of the U.S. population is obese? Obesity is an increasing problem in the United States that is expected to become worse in the coming decades. As of 2023, around one third of adults in the United States were considered obese. Obesity is slightly more prevalent among women in the United States, and rates of obesity differ greatly by region and state. For example, in West Virginia, around 41 percent of adults are obese, compared to 25 percent in Colorado. However, although Colorado is the state with the lowest prevalence of obesity among adults, a quarter of the adult population being obese is still shockingly high. The health impacts of being obese Obesity increases the risk of developing a number of health conditions including high blood pressure, heart disease, type 2 diabetes, and certain types of cancer. It is no coincidence that the states with the highest rates of hypertension are also among the states with the highest prevalence of obesity. West Virginia currently has the third highest rate of hypertension in the U.S. with 45 percent of adults with the condition. It is also no coincidence that as rates of obesity in the United States have increased so have rates of diabetes. As of 2022, around 8.4 percent of adults in the United States had been diagnosed with diabetes, compared to six percent in the year 2000. Obesity can be prevented through a healthy diet and regular exercise, which also increases overall health and longevity.
- S
Allegany County percent overweight or obese
- health.data.ny.gov
- data.ny.gov
application/rdfxml +5Updated Dec 9, 2022ShareFacebookTwitterEmailClick to copy linkLink copiedCiteNew York State Department of Health (2022). Allegany County percent overweight or obese [Dataset]. https://health.data.ny.gov/w/rpu8-apkw/fbc6-cypp?cur=WulXbNaIIMm&from=YdE1LqdI8pkcsv, application/rdfxml, json, xml, tsv, application/rssxmlAvailable download formatsDataset updatedDec 9, 2022AuthorsNew York State Department of HealthArea coveredAllegany CountyDescriptionThe Student Weight Status Category Reporting System (SWSCR) collects weight status category data (underweight, healthy weight, overweight or obese, based on BMI-for-age percentile) at school entry (pre-kindergarten or kindergarten) and in grades 2, 4, 7 and 10 for students attending all public schools outside of the five boroughs of New York City.The dataset includes separate estimates of the percent of students overweight, obese and overweight or obese for all reportable grades within the county and/or region and by grade groups (elementary and middle/high). Variables representing the number of students on which the percentages are based are also included.
For more information check out http://www.health.ny.gov/prevention/obesity/, or go to the "About" tab.
- d
Statistics on Obesity, Physical Activity and Diet (replaced by Statistics on...
- digital.nhs.uk
Updated May 5, 2020+ more versionsShareFacebookTwitterEmailClick to copy linkLink copiedCite(2020). Statistics on Obesity, Physical Activity and Diet (replaced by Statistics on Public Health) [Dataset]. https://digital.nhs.uk/data-and-information/publications/statistical/statistics-on-obesity-physical-activity-and-dietDataset updatedMay 5, 2020Licensehttps://digital.nhs.uk/about-nhs-digital/terms-and-conditionshttps://digital.nhs.uk/about-nhs-digital/terms-and-conditions
Time period coveredApr 1, 2018 - Dec 31, 2019DescriptionThis report presents information on obesity, physical activity and diet drawn together from a variety of sources for England. More information can be found in the source publications which contain a wider range of data and analysis. Each section provides an overview of key findings, as well as providing links to relevant documents and sources. Some of the data have been published previously by NHS Digital. A data visualisation tool (link provided within the key facts) allows users to select obesity related hospital admissions data for any Local Authority (as contained in the data tables), along with time series data from 2013/14. Regional and national comparisons are also provided. The report includes information on: Obesity related hospital admissions, including obesity related bariatric surgery. Obesity prevalence. Physical activity levels. Walking and cycling rates. Prescriptions items for the treatment of obesity. Perception of weight and weight management. Food and drink purchases and expenditure. Fruit and vegetable consumption. Key facts cover the latest year of data available: Hospital admissions: 2018/19 Adult obesity: 2018 Childhood obesity: 2018/19 Adult physical activity: 12 months to November 2019 Children and young people's physical activity: 2018/19 academic year
Share of obese high school students in the U.S. by state 2021
- statista.com
Updated Sep 26, 2024ShareFacebookTwitterEmailClick to copy linkLink copiedCiteStatista (2024). Share of obese high school students in the U.S. by state 2021 [Dataset]. https://www.statista.com/statistics/506006/share-of-obese-high-school-students-in-the-us/Dataset updatedSep 26, 2024Time period covered2021Area coveredUnited StatesDescriptionIn 2021, around 27 percent of high school students in the state of West Virginia were obese, making it the state with the highest share of obese high school students that year. Colorado and Utah had the lowest obesity rates among students that year. The state with the highest share of obese adults West Virginia not only has the highest rate of obese high school students, it is also the U.S. state with the highest percentage of obese adults, which was about 41 percent as of 2023. Obesity remains a growing problem in the United States, especially in the southern states. Body image among college students In the fall of 2023, just over half of U.S. college students (18 years and older) described their weight as “about the right weight”. Almost a third of the respondents stated that they were slightly overweight, while 6.5 percent said they were very overweight. Furthermore, roughly 37 percent of college students rated their health as very good, while just two percent of this group rated their general health as poor.
Obesity in California, 2012 and 2013
- data.chhs.ca.gov
- data.ca.gov
- +1more
csv, xlsx, zipUpdated Aug 29, 2024ShareFacebookTwitterEmailClick to copy linkLink copiedCiteCalifornia Department of Public Health (2024). Obesity in California, 2012 and 2013 [Dataset]. https://data.chhs.ca.gov/dataset/obesity-in-california-2012-and-2013xlsx, csv, zipAvailable download formatsDataset updatedAug 29, 2024Area coveredCaliforniaDescriptionThese data are from the 2013 California Dietary Practices Surveys (CDPS), 2012 California Teen Eating, Exercise and Nutrition Survey (CalTEENS), and 2013 California Children’s Healthy Eating and Exercise Practices Surveys (CalCHEEPS). These surveys have been discontinued. Adults, adolescents, and children (with parental assistance) were asked for their current height and weight, from which, body mass index (BMI) was calculated. For adults, a BMI of 30.0 and above is considered obese. For adolescents and children, obesity is defined as having a BMI at or above the 95th percentile, according to CDC growth charts.
The California Dietary Practices Surveys (CDPS), the California Teen Eating, Exercise and Nutrition Survey (CalTEENS), and the California Children’s Healthy Eating and Exercise Practices Surveys (CalCHEEPS) (now discontinued) were the most extensive dietary and physical activity assessments of adults 18 years and older, adolescents 12 to 17, and children 6 to 11, respectively, in the state of California. CDPS and CalCHEEPS were administered biennially in odd years up through 2013 and CalTEENS was administered biennially in even years through 2014. The surveys were designed to monitor dietary trends, especially fruit and vegetable consumption, among Californias for evaluating their progress toward meeting the Dietary Guidelines for Americans and the Healthy People 2020 Objectives. All three surveys were conducted via telephone. Adult and adolescent data were collected using a list of participating CalFresh households and random digit dial, and child data were collected using only the list of CalFresh households. Older children (9-11) were the primary respondents with some parental assistance. For younger children (6-8), the primary respondent was parents. Data were oversampled for low-income and African American to provide greater sensitivity for analyzing trends among the target population. Wording of the question used for these analyses varied by survey (age group). The questions were worded are as follows: Adult:1) How tall are you without shoes?2) How much do you weigh?Adolescent:1) About how much do you weigh without shoes?2) About how tall are you without shoes? Child:1) How tall is [child's name] now without shoes on?2) How much does [child's name] weigh now without shoes on?
- U
United States US: Prevalence of Overweight: Weight for Height: % of Children...
- ceicdata.com
Updated Nov 27, 2021ShareFacebookTwitterEmailClick to copy linkLink copiedCiteCEICdata.com (2021). United States US: Prevalence of Overweight: Weight for Height: % of Children Under 5 [Dataset]. https://www.ceicdata.com/en/united-states/health-statistics/us-prevalence-of-overweight-weight-for-height--of-children-under-5Dataset updatedNov 27, 2021Dataset provided byCEICdata.comLicenseAttribution 4.0 (CC BY 4.0)https://creativecommons.org/licenses/by/4.0/
License information was derived automaticallyTime period coveredDec 1, 1969 - Dec 1, 2012Area coveredUnited StatesDescriptionUnited States US: Prevalence of Overweight: Weight for Height: % of Children Under 5 data was reported at 6.000 % in 2012. This records a decrease from the previous number of 7.800 % for 2009. United States US: Prevalence of Overweight: Weight for Height: % of Children Under 5 data is updated yearly, averaging 7.000 % from Dec 1991 (Median) to 2012, with 5 observations. The data reached an all-time high of 8.100 % in 2005 and a record low of 5.400 % in 1991. United States US: Prevalence of Overweight: Weight for Height: % of Children Under 5 data remains active status in CEIC and is reported by World Bank. The data is categorized under Global Database’s USA – Table US.World Bank: Health Statistics. Prevalence of overweight children is the percentage of children under age 5 whose weight for height is more than two standard deviations above the median for the international reference population of the corresponding age as established by the WHO's new child growth standards released in 2006.; ; UNICEF, WHO, World Bank: Joint child malnutrition estimates (JME). Aggregation is based on UNICEF, WHO, and the World Bank harmonized dataset (adjusted, comparable data) and methodology.; Linear mixed-effect model estimates; Estimates of overweight children are also from national survey data. Once considered only a high-income economy problem, overweight children have become a growing concern in developing countries. Research shows an association between childhood obesity and a high prevalence of diabetes, respiratory disease, high blood pressure, and psychosocial and orthopedic disorders (de Onis and Blössner 2003). Childhood obesity is associated with a higher chance of obesity, premature death, and disability in adulthood. In addition to increased future risks, obese children experience breathing difficulties and increased risk of fractures, hypertension, early markers of cardiovascular disease, insulin resistance, and psychological effects. Children in low- and middle-income countries are more vulnerable to inadequate nutrition before birth and in infancy and early childhood. Many of these children are exposed to high-fat, high-sugar, high-salt, calorie-dense, micronutrient-poor foods, which tend be lower in cost than more nutritious foods. These dietary patterns, in conjunction with low levels of physical activity, result in sharp increases in childhood obesity, while under-nutrition continues
- S
kkk
- health.data.ny.gov
application/rdfxml +5Updated Dec 9, 2022+ more versionsShareFacebookTwitterEmailClick to copy linkLink copiedCiteNew York State Department of Health (2022). kkk [Dataset]. https://health.data.ny.gov/Health/kkk/n7ms-m7nsjson, application/rssxml, csv, tsv, xml, application/rdfxmlAvailable download formatsDataset updatedDec 9, 2022AuthorsNew York State Department of HealthDescriptionThe Student Weight Status Category Reporting System (SWSCR) collects weight status category data (underweight, healthy weight, overweight or obese, based on BMI-for-age percentile). The dataset includes separate estimates of the percent of students overweight, obese and overweight or obese for all reportable grades within the county and/or region and by grade groups (elementary and middle/high). The rates of overweight and obesity reported are percentages based on counts of students in selected grades (Pre-K, K, 2, 4, 7, 10) reported to the NYSDOH. Because these rates reflect a broad range of factors that vary by school district, to make comparisons about observed differences in the rates of obesity and overweight between school districts requires the use of multivariate statistics. County, regional and statewide estimates will only be provided biennially, District estimates will be updated annually. For more information check out http://www.health.ny.gov/prevention/obesity/, see our Instruction Guide on How to Create Visualizations https://health.data.ny.gov/api/assets/6490BDA9-AE4D-406F-BA5A-703793526B9F. The "About" tab contains additional details concerning this dataset.
U.S. adult obesity prevalence in 2023, by gender
- statista.com
Updated Nov 22, 2024ShareFacebookTwitterEmailClick to copy linkLink copiedCiteStatista (2024). U.S. adult obesity prevalence in 2023, by gender [Dataset]. https://www.statista.com/statistics/237133/us-obesity-by-gender/Dataset updatedNov 22, 2024Time period covered2023Area coveredUnited StatesDescriptionIn 2023, it was estimated that around 32 percent of men and 34 percent of women in the U.S. were obese. This statistic shows the percentage of adults in the United States who were obese in 2023, by gender.
- N
Effects of bariatric surgery on resting state functional connectivity of the...
- neurovault.org
niftiUpdated Mar 22, 2021+ more versionsShareFacebookTwitterEmailClick to copy linkLink copiedCite(2021). Effects of bariatric surgery on resting state functional connectivity of the NAcc (reward network) and PCC (default mode network): Effect of average BMI (negative) on PCC connectivity [Dataset]. http://identifiers.org/neurovault.image:441773niftiAvailable download formatsUnique identifierhttps://identifiers.org/neurovault.image:441773Dataset updatedMar 22, 2021LicenseCC0 1.0 Universal Public Domain Dedicationhttps://creativecommons.org/publicdomain/zero/1.0/
License information was derived automaticallyDescriptionModel EA3: FC ~ average BMI + change BMI + average logmFD + change logmFD + age + sex
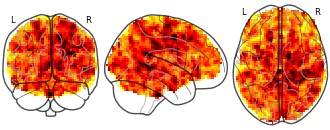
Collection description
Obesity imposes serious health risks and involves alterations in resting-state functional connectivity of brain networks involved in eating behavior. Bariatric surgery is an effective treatment, but its effects on functional connectivity are still under debate. In this pre-registered study, we investigated the effects of bariatric surgery on major resting-state brain networks (reward and default mode network) in a longitudinal controlled design.
33 bariatric surgery patients and 15 obese waiting-list control patients (37 females; aged 44.15 ± 11.86 SD years (range 21-68)) underwent magnetic resonance imaging at baseline, after 6 and 12 months. We conducted a pre-registered whole-brain time-by-group interaction analysis, and a time-by-group interaction analysis on within-network connectivity (https://osf.io/f8tpn/, https://osf.io/59bh7/). In exploratory analyses, we investigated the effects of weight loss and head motion.
Bariatric surgery compared to waiting did not significantly affect functional connectivity (FWE-corrected p > .05), neither whole-brain nor within-network. In exploratory analyses, surgery-related BMI decrease (FWE-corrected p = .041) and higher average head motion (FWE-corrected p = .021) resulted in significantly stronger connectivity of the reward network with medial posterior frontal regions.
This pre-registered well-controlled study did not support a strong effect of bariatric surgery, compared to waiting, on major resting-state brain networks after 6 months. Exploratory analyses indicated that head motion might have confounded the effects. Data pooling and more rigorous control of within-scanner head motion during data acquisition are needed to substantiate effects of bariatric surgery on brain organization.Subject species
homo sapiens
Modality
fMRI-BOLD
Analysis level
group
Cognitive paradigm (task)
rest eyes closed
Map type
Z
- b
Percent Obese in year 6 - WMCA
- cityobservatory.birmingham.gov.uk
csv, excel, geojson +1Updated Mar 3, 2025ShareFacebookTwitterEmailClick to copy linkLink copiedCite(2025). Percent Obese in year 6 - WMCA [Dataset]. https://cityobservatory.birmingham.gov.uk/explore/dataset/percent-obese-in-year-6-wmca/csv, geojson, json, excelAvailable download formatsDataset updatedMar 3, 2025LicenseOpen Government Licence 3.0http://www.nationalarchives.gov.uk/doc/open-government-licence/version/3/
License information was derived automaticallyDescriptionThis is the percentage of year 6 children who are living with obesity and includes children who are living with severe obesity.
The BMI classification of each child is derived by calculating the child's BMI centile and assigning the BMI classification. Obese is defined as a BMI centile greater than or equal to the 95th centile. Severely obese is defined as a BMI centile greater than or equal to 99.6 (This BMI classification is a subset of the "Obese" classification).
The results are derived from the postcode of the school. Measurement of children's heights and weights, without shoes and coats and in normal, light, indoor clothing, was overseen by healthcare professionals and undertaken in school by trained staff. Measurements could be taken at any time during the academic year. Some children could be over one year older than others in the same school year at the point of measurement. This does not impact upon a child's BMI classification since BMI centile results are adjusted for age.
The National Child Measurement Programme (NCMP) collects height and weight measurements of children in reception (aged 4-5 years) and year 6 (aged 10-11 years) primarily in mainstream state-maintained schools in England. Local authorities are mandated to collect data from mainstream state-maintained schools but collection of data from special schools (schools for pupils with special educational needs and pupil referral units) and independent schools is encouraged.
Data is Powered by LG Inform Plus and automatically checked for new data on the 3rd of each month.
- P
Palestinian Territory PS: Prevalence of Overweight: Weight for Height: % of...
- ceicdata.com
Updated Jan 15, 2025+ more versionsShareFacebookTwitterEmailClick to copy linkLink copiedCiteCEICdata.com (2025). Palestinian Territory PS: Prevalence of Overweight: Weight for Height: % of Children Under 5 [Dataset]. https://www.ceicdata.com/en/palestinian-territory-occupied/health-statistics/ps-prevalence-of-overweight-weight-for-height--of-children-under-5Dataset updatedJan 15, 2025Dataset provided byCEICdata.comLicenseAttribution 4.0 (CC BY 4.0)https://creativecommons.org/licenses/by/4.0/
License information was derived automaticallyTime period coveredDec 1, 1996 - Dec 1, 2014Area coveredPalestine, Occupied Palestinian territoriesDescriptionState of Palestine (West Bank and Gaza) PS: Prevalence of Overweight: Weight for Height: % of Children Under 5 data was reported at 8.200 % in 2014. This records an increase from the previous number of 5.300 % for 2010. State of Palestine (West Bank and Gaza) PS: Prevalence of Overweight: Weight for Height: % of Children Under 5 data is updated yearly, averaging 6.750 % from Dec 1996 (Median) to 2014, with 4 observations. The data reached an all-time high of 11.400 % in 2007 and a record low of 4.000 % in 1996. State of Palestine (West Bank and Gaza) PS: Prevalence of Overweight: Weight for Height: % of Children Under 5 data remains active status in CEIC and is reported by World Bank. The data is categorized under Global Database’s State of Palestine (West Bank and Gaza) – Table PS.World Bank.WDI: Health Statistics. Prevalence of overweight children is the percentage of children under age 5 whose weight for height is more than two standard deviations above the median for the international reference population of the corresponding age as established by the WHO's new child growth standards released in 2006.; ; UNICEF, WHO, World Bank: Joint child malnutrition estimates (JME). Aggregation is based on UNICEF, WHO, and the World Bank harmonized dataset (adjusted, comparable data) and methodology.; Linear mixed-effect model estimates; Estimates of overweight children are also from national survey data. Once considered only a high-income economy problem, overweight children have become a growing concern in developing countries. Research shows an association between childhood obesity and a high prevalence of diabetes, respiratory disease, high blood pressure, and psychosocial and orthopedic disorders (de Onis and Blössner 2003). Childhood obesity is associated with a higher chance of obesity, premature death, and disability in adulthood. In addition to increased future risks, obese children experience breathing difficulties and increased risk of fractures, hypertension, early markers of cardiovascular disease, insulin resistance, and psychological effects. Children in low- and middle-income countries are more vulnerable to inadequate nutrition before birth and in infancy and early childhood. Many of these children are exposed to high-fat, high-sugar, high-salt, calorie-dense, micronutrient-poor foods, which tend be lower in cost than more nutritious foods. These dietary patterns, in conjunction with low levels of physical activity, result in sharp increases in childhood obesity, while under-nutrition continues
Percentage of U.S. children and adolescents who were obese 1988-2018
- statista.com
Updated May 24, 2024ShareFacebookTwitterEmailClick to copy linkLink copiedCiteStatista (2024). Percentage of U.S. children and adolescents who were obese 1988-2018 [Dataset]. https://www.statista.com/statistics/285035/percentage-of-us-children-and-adolescents-who-were-obese/Dataset updatedMay 24, 2024Area coveredUnited StatesDescriptionBetween 2015 and 2018, obesity rates in U.S. children and adolescents stood at 19.3 and 20.9 percent, respectively. This is a noteworthy increase compared to the percentages seen between 1988 and 1994.
U.S. high school obesity rates
Roughly 18 percent of black, as well as Hispanic students in the United States, were obese between 2016 and 2017. Male obesity rates were noticeably higher than those of female students for each of the ethnicities during the measured period. For example, about 22 percent of male Hispanic high school students were obese, compared to 14 percent of female students. The American states with the highest number of obese high school students in 2019 included Mississippi, West Virginia, and Arkansas, respectively. Mississippi had a high school student obesity rate of over 23 percent that year.
Physically inactive Americans
Adults from Mississippi and Arkansas were also reported to be some of the least physically active people in the United States in 2018. When surveyed, over 30 percent of adults from Kentucky and Arkansas had not exercised within the preceding 30 days. The national physical inactivity average stood at approximately 26 percent that year.
- f
Description of the modules used in the study.
- plos.figshare.com
xlsUpdated Dec 16, 2024ShareFacebookTwitterEmailClick to copy linkLink copiedCiteFrancisca Romo-Muñoz; Rodrigo Romo-Muñoz; Sebastián Niklitschek-Soto; Cristhian Aguilera-Carrasco; José M. Gil (2024). Description of the modules used in the study. [Dataset]. http://doi.org/10.1371/journal.pone.0309351.t001xlsAvailable download formatsUnique identifierhttps://doi.org/10.1371/journal.pone.0309351.t001Dataset updatedDec 16, 2024Dataset provided byPLOS ONEAuthorsFrancisca Romo-Muñoz; Rodrigo Romo-Muñoz; Sebastián Niklitschek-Soto; Cristhian Aguilera-Carrasco; José M. GilLicenseAttribution 4.0 (CC BY 4.0)https://creativecommons.org/licenses/by/4.0/
License information was derived automaticallyDescriptionOverweight and obesity are considered the greatest public health problem in this emerging country, which worldwide has the second-highest percentage of overweight people among its population. The objective of this work was to analyse to what extent factors traditionally used in the study of overweight and obesity (such as sociodemographic and behavioural) and new variables proposed in the literature (such as stress, financial stress and emotional support) explain this disease in the adult population of Chile. Data were obtained from the III National Health Survey (ENS) administered by the Ministry of Health of Chile in 2017. The ENS collected a large amount of data with extensive geographic coverage. The survey comprised 4 questionnaires with a total of 576 questions, which were applied to a representative sample of the population in Chile. A double complementary methodological approach was adopted. A random forest (RF) classification model was used, and based on the results obtained, an econometric model of the censored dependent variable, specifically the Heckman sample selection model, was specified and estimated. The RF results allowed, for each of the factors considered in the research, the selection of variables with the greatest power to classify the individuals in the sample on the basis of nutritional state (normal weight, overweight or obese). Subsequently, the estimation of the parameters of the Heckman model made it possible to quantify the variables that most affected overweight and obesity. Most of the variables that make up the factors were found to be significant. Interestingly, psychosocial variables effectively influence overweight and obesity. In addition, the results for reviewing nutritional information and reviewing food warnings allow us to reflect on the impact that recent food policies have had on the Chilean population. The combination of RF and an econometric model allowed us to capitalize on the strength of both models to better explain the complex phenomenon of overweight and obesity. This approach allowed us to more accurately confirm the impact of traditional factors on overweight and obesity but to show also that other psychosocial factors are relevant and should be consider in future studies.
FacebookTwitterWest Virginia, Mississippi, and Arkansas are the U.S. states with the highest percentage of their population who are obese. The states with the lowest percentage of their population who are obese include Colorado, Hawaii, and Massachusetts. Obesity in the United States Obesity is a growing problem in many countries around the world, but the United States has the highest rate of obesity among all OECD countries. The prevalence of obesity in the United States has risen steadily over the previous two decades, with no signs of declining. Obesity in the U.S. is more common among women than men, and overweight and obesity rates are higher among African Americans than any other race or ethnicity. Causes and health impacts Obesity is most commonly the result of a combination of poor diet, overeating, physical inactivity, and a genetic susceptibility. Obesity is associated with various negative health impacts, including an increased risk of cardiovascular diseases, certain types of cancer, and diabetes type 2. As of 2022, around 8.4 percent of the U.S. population had been diagnosed with diabetes. Diabetes is currently the eighth leading cause of death in the United States.