Monthly average daily temperatures in the United Kingdom 2015-2024
- statista.com
Updated Dec 15, 2024 Share
Share Facebook
 Twitter
 EmailClick to copy linkLink copiedCiteStatista (2024). Monthly average daily temperatures in the United Kingdom 2015-2024 [Dataset]. https://www.statista.com/statistics/322658/monthly-average-daily-temperatures-in-the-united-kingdom-uk/Dataset updatedDec 15, 2024Time period coveredJan 2015 - Nov 2024Area coveredUnited KingdomDescription
The highest average temperature recorded in 2024 until November was in August, at 16.8 degrees Celsius. Since 2015, the highest average daily temperature in the UK was registered in July 2018, at 18.7 degrees Celsius. The summer of 2018 was the joint hottest since institutions began recording temperatures in 1910. One noticeable anomaly during this period was in December 2015, when the average daily temperature reached 9.5 degrees Celsius. This month also experienced the highest monthly rainfall in the UK since before 2014, with England, Wales, and Scotland suffering widespread flooding. Daily hours of sunshine Unsurprisingly, the heat wave that spread across the British Isles in 2018 was the result of particularly sunny weather. July 2018 saw an average of 8.7 daily sun hours in the United Kingdom. This was more hours of sun than was recorded in July 2024, which only saw 5.8 hours of sun. Temperatures are on the rise Since the 1960s, there has been an increase in regional temperatures across the UK. Between 1961 and 1990, temperatures in England averaged nine degrees Celsius, and from 2013 to 2022, average temperatures in the country had increased to 10.3 degrees Celsius. Due to its relatively southern location, England continues to rank as the warmest country in the UK.
Monthly mean temperature in England 2015-2025
- statista.com
Updated Oct 15, 2025ShareFacebookTwitterEmailClick to copy linkLink copiedCiteStatista (2025). Monthly mean temperature in England 2015-2025 [Dataset]. https://www.statista.com/statistics/585133/monthly-mean-temperature-in-england-uk/Dataset updatedOct 15, 2025Time period coveredJan 2015 - Sep 2025Area coveredEngland, United KingdomDescriptionEngland's highest monthly mean air temperatures are typically recorded in July and August of each year. Since 2015, the warmest mean temperature was measured in July 2018 at 18.8 degrees Celsius. On the other hand, February of that same year registered the coolest temperature, at 2.6 degrees Celsius. In September 2025, the mean air temperature was 13.8 degrees Celsius, matching the figure recorded the same month the previous year. The English weather England is the warmest region in the United Kingdom and the driest. In 2024, the average annual temperature in England amounted to 10.73 degrees Celsius – around 1.1 degrees above the national mean. That same year, precipitation in England stood at about 1,020 millimeters. By contrast, Scotland – the wettest region in the UK – recorded over 1,500 millimeters of rainfall in 2024. Temperatures on the rise Throughout the last decades, the average temperature in the United Kingdom has seen an upward trend, reaching a record high in 2022. Global temperatures have experienced a similar pattern over the same period. This gradual increase in the Earth's average temperature is primarily due to various human activities, such as burning fossil fuels and deforestation, which lead to the emission of greenhouse gases. This phenomenon has severe consequences, including more frequent and intense weather events, rising sea levels, and adverse effects on human health and the environment.
Average temperature of summers in the United Kingdom (UK) 1990-2024
- statista.com
ShareFacebookTwitterEmailClick to copy linkLink copiedCiteStatista, Average temperature of summers in the United Kingdom (UK) 1990-2024 [Dataset]. https://www.statista.com/statistics/912027/hottest-summers-in-united-kingdom/Area coveredUnited KingdomDescriptionIn 2024, the average summer temperature in the United Kingdom was ***** degrees Celsius. Over the time period from 1990 through 2024, the average summer temperature in the UK fluctuated from a low of ***** degrees in 1993 to a high of ***** degrees in 2018.
Summer Average Temperature Change - Projections (Local Authority) v1
- climatedataportal.metoffice.gov.uk
Updated Jul 9, 2024+ more versionsShareFacebookTwitterEmailClick to copy linkLink copiedCiteMet Office (2024). Summer Average Temperature Change - Projections (Local Authority) v1 [Dataset]. https://climatedataportal.metoffice.gov.uk/datasets/summer-average-temperature-change-projections-local-authority-v1Dataset updatedJul 9, 2024Area coveredDescriptionThis data-set contains 3 fields for each fixed period (1981-2000, 2001-2020) and Global Warming Level (1.5°C, 2°C, 2.5°C, 3°C, 3.5°C, 4°C) combination: the median, 2nd lowest and 2nd highest among the 12 ensemble members. The fields are named accordingly; e.g. the 2nd lowest at 2.5°C is tas_summer_25_lowerTo understand the data, refer to the LACS Scientific Detail.To understand how to explore the data, see the User Guides available on the Climate Data Portal.
Mean annual temperature in United Kingdom (UK) 1910-2024
- statista.com
ShareFacebookTwitterEmailClick to copy linkLink copiedCiteStatista, Mean annual temperature in United Kingdom (UK) 1910-2024 [Dataset]. https://www.statista.com/statistics/610124/annual-mean-temperature-in-uk/Area coveredUnited KingdomDescriptionThe annual mean temperature in the United Kingdom has fluctuated greatly since 1990. Temperatures during this period were at their highest in 2022, surpassing ** degrees Celsius. In 2010, the mean annual temperature stood at **** degrees, the lowest recorded during this time. Daily temperatures Average daily temperatures have remained stable since the turn of the century, rarely dropping below ** degrees Celsius. In 2010, they dropped to a low of **** degrees Celsius. The peak average daily temperature was recorded in 2022 when it reached **** degrees. This was an increase of *** degree Celsius compared to the long-term mean, and the most positive deviation during the period of consideration. Highs and lows The maximum average temperature recorded across the UK since 2015 was in July 2018. This month saw a maximum temperature of **** degrees Celsius. In comparison, the lowest monthly minimum temperature was in February of the same year, at just minus *** degrees. This was an especially cold February, as the previous year the minimum temperature for this month was *** degrees.
Average daily temperatures in the United Kingdom 2001-2024
- statista.com
ShareFacebookTwitterEmailClick to copy linkLink copiedCiteStatista, Average daily temperatures in the United Kingdom 2001-2024 [Dataset]. https://www.statista.com/statistics/322616/daily-average-temperatures-in-the-united-kingdom-uk/Area coveredUnited KingdomDescriptionThe daily average temperature in the United Kingdom (UK) has remained relatively stable since 2001, with temperatures rarely straying below 10 degrees Celsius. In 2024, the UK had an average daily temperature of 11.9 degrees Celsius. This was the highest average daily temperature recorded since the turn of the century. British summertime Britain is not known for its blisteringly hot summer months, with the average temperatures in this season varying greatly since 1990. In 1993, the average summer temperature was as low as 13.39 degrees Celsius, whilst 2018 saw a peak of 15.8 degrees Celsius. In that same year, the highest mean temperature occurred in July at 17.2 degrees Celsius. Variable weather Due to its location and the fact that it is an island, the United Kingdom experiences a diverse range of weather, sometimes in the same day. It is in an area where five air masses meet, creating a weather front. Each brings different weather conditions, such as hot, dry air from North Africa and wet and cold air from the Arctic. Temperatures across the UK tend to be warmest in England.
Energy Trends: UK weather
- gov.uk
Updated Nov 27, 2025ShareFacebookTwitterEmailClick to copy linkLink copiedCiteDepartment for Energy Security and Net Zero (2025). Energy Trends: UK weather [Dataset]. https://www.gov.uk/government/statistics/energy-trends-section-7-weatherDataset updatedNov 27, 2025AuthorsDepartment for Energy Security and Net ZeroArea coveredUnited KingdomDescriptionThese statistics show quarterly and monthly weather trends for:
- temperatures
- heating degree days
- wind speed
- sun hours
- rainfall
They provide contextual information for consumption patterns in energy, referenced in the Energy Trends chapters for each energy type.
Trends in wind speeds, sun hours and rainfall provide contextual information for trends in renewable electricity generation.
All these tables are published monthly, on the last Thursday of each month. The data is 1 month in arrears.
Contact us
If you have questions about this content, please email: energy.stats@energysecurity.gov.uk.
Summer Average Temperature Change - Projections (12km)
- climatedataportal.metoffice.gov.uk
Updated Jun 1, 2023+ more versionsShareFacebookTwitterEmailClick to copy linkLink copiedCiteMet Office (2023). Summer Average Temperature Change - Projections (12km) [Dataset]. https://climatedataportal.metoffice.gov.uk/datasets/7714ab0b35bd43a6a7ffcfe548687ea8Dataset updatedJun 1, 2023Area coveredDescription[Updated 28/01/25 to fix an issue in the ‘Lower’ values, which were not fully representing the range of uncertainty. ‘Median’ and ‘Higher’ values remain unchanged. The size of the change varies by grid cell and fixed period/global warming levels but the average difference between the 'lower' values before and after this update is 0.09°C.]What does the data show? This dataset shows the change in summer average temperature for a range of global warming levels, including the recent past (2001-2020), compared to the 1981-2000 baseline period. Here, summer is defined as June-July-August. Note, as the values in this dataset are averaged over a season they do not represent possible extreme conditions.The dataset uses projections of daily average air temperature from UKCP18 which are averaged over the summer period to give values for the 1981-2000 baseline, the recent past (2001-2020) and global warming levels. The warming levels available are 1.5°C, 2.0°C, 2.5°C, 3.0°C and 4.0°C above the pre-industrial (1850-1900) period. The recent past value and global warming level values are stated as a change (in °C) relative to the 1981-2000 value. This enables users to compare summer average temperature trends for the different periods. In addition to the change values, values for the 1981-2000 baseline (corresponding to 0.51°C warming) and recent past (2001-2020, corresponding to 0.87°C warming) are also provided. This is summarised in the table below.PeriodDescription1981-2000 baselineAverage temperature (°C) for the period2001-2020 (recent past)Average temperature (°C) for the period2001-2020 (recent past) changeTemperature change (°C) relative to 1981-20001.5°C global warming level changeTemperature change (°C) relative to 1981-20002°C global warming level changeTemperature change (°C) relative to 1981-20002.5°C global warming level changeTemperature change (°C) relative to 1981-20003°C global warming level changeTemperature change (°C) relative to 1981-20004°C global warming level changeTemperature change (°C) relative to 1981-2000What is a global warming level?The Summer Average Temperature Change is calculated from the UKCP18 regional climate projections using the high emissions scenario (RCP 8.5) where greenhouse gas emissions continue to grow. Instead of considering future climate change during specific time periods (e.g. decades) for this scenario, the dataset is calculated at various levels of global warming relative to the pre-industrial (1850-1900) period. The world has already warmed by around 1.1°C (between 1850–1900 and 2011–2020), whilst this dataset allows for the exploration of greater levels of warming. The global warming levels available in this dataset are 1.5°C, 2°C, 2.5°C, 3°C and 4°C. The data at each warming level was calculated using a 21 year period. These 21 year periods are calculated by taking 10 years either side of the first year at which the global warming level is reached. This time will be different for different model ensemble members. To calculate the value for the Summer Average Temperature Change, an average is taken across the 21 year period.We cannot provide a precise likelihood for particular emission scenarios being followed in the real world future. However, we do note that RCP8.5 corresponds to emissions considerably above those expected with current international policy agreements. The results are also expressed for several global warming levels because we do not yet know which level will be reached in the real climate as it will depend on future greenhouse emission choices and the sensitivity of the climate system, which is uncertain. Estimates based on the assumption of current international agreements on greenhouse gas emissions suggest a median warming level in the region of 2.4-2.8°C, but it could either be higher or lower than this level.What are the naming conventions and how do I explore the data?These data contain a field for each warming level and the 1981-2000 baseline. They are named 'tas summer change' (change in air 'temperature at surface'), the warming level or baseline, and 'upper' 'median' or 'lower' as per the description below. e.g. 'tas summer change 2.0 median' is the median value for summer for the 2.0°C warming level. Decimal points are included in field aliases but not in field names, e.g. 'tas summer change 2.0 median' is named 'tas_summer_change_20_median'. To understand how to explore the data, refer to the New Users ESRI Storymap. Please note, if viewing in ArcGIS Map Viewer, the map will default to ‘tas summer change 2.0°C median’ values.What do the 'median', 'upper', and 'lower' values mean?Climate models are numerical representations of the climate system. To capture uncertainty in projections for the future, an ensemble, or group, of climate models are run. Each ensemble member has slightly different starting conditions or model set-ups. Considering all of the model outcomes gives users a range of plausible conditions which could occur in the future.For this dataset, the model projections consist of 12 separate ensemble members. To select which ensemble members to use, the Summer Average Temperature Change was calculated for each ensemble member and they were then ranked in order from lowest to highest for each location.The ‘lower’ fields are the second lowest ranked ensemble member. The ‘higher’ fields are the second highest ranked ensemble member. The ‘median’ field is the central value of the ensemble.This gives a median value, and a spread of the ensemble members indicating the range of possible outcomes in the projections. This spread of outputs can be used to infer the uncertainty in the projections. The larger the difference between the lower and higher fields, the greater the uncertainty.‘Lower’, ‘median’ and ‘upper’ are also given for the baseline period as these values also come from the model that was used to produce the projections. This allows a fair comparison between the model projections and recent past. Useful linksFor further information on the UK Climate Projections (UKCP).Further information on understanding climate data within the Met Office Climate Data Portal.
Monthly mean temperature in the UK 2015-2025
- statista.com
Updated Sep 9, 2025ShareFacebookTwitterEmailClick to copy linkLink copiedCiteStatista (2025). Monthly mean temperature in the UK 2015-2025 [Dataset]. https://www.statista.com/statistics/584893/monthly-mean-temperature-in-uk/Dataset updatedSep 9, 2025Time period coveredJan 2015 - Sep 2025Area coveredUnited KingdomDescriptionThe monthly mean temperature in the United Kingdom is typically highest in July and August. During this period, the monthly mean temperature peaked in July 2018, at *****degrees Celsius. In September 2025, the UK recorded a mean temperature of **** degrees Celsius, slightly higher than the temperature recorded the same month a year prior.
- e
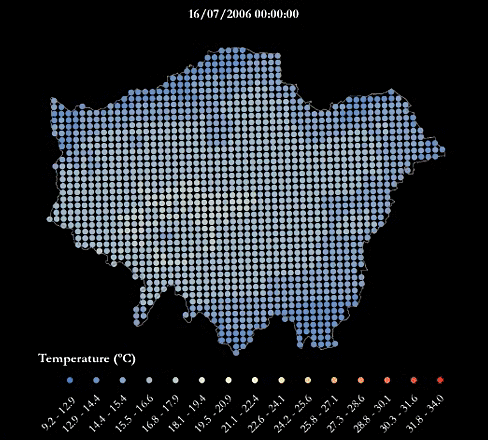
London’s Urban Heat Island - During A Warm Summer
- data.europa.eu
pdf, zip+ more versionsShareFacebookTwitterEmailClick to copy linkLink copiedCiteGreater London Authority, London’s Urban Heat Island - During A Warm Summer [Dataset]. https://data.europa.eu/data/datasets/londons-urban-heat-island-during-a-warm-summer?locale=lvpdf, zipAvailable download formatsDataset authored and provided byGreater London AuthorityArea coveredLondonDescriptionFor an urban heat island map during an average summer see this dataset.
A heatwave refers to a prolonged period of unusually hot weather. While there is no standard definition of a heatwave in England, the Met Office uses the World Meteorological Organization definition of a heatwave, which is "when the daily maximum temperature of more than five consecutive days exceeds the average maximum temperature by 5°C, the normal period being 1961-1990". They are common in the northern and southern hemisphere during summer have historically been associated with health problems and an increase in mortality.
The urban heat island (UHI) is the phenomenon where temperatures are relatively higher in cities compared to surrounding rural areas due to, for example, the urban surfaces and anthropogenic heat sources.
This urban heat island map was produced using LondUM, a specific set-up of the Met Office Unified Model version 6.1 for London. It uses the Met Office Reading Surface Exchange Scheme (MORUSES), as well as urban morphology data derived from Virtual London. The model was run from May until September 2006 and December 2006. This map shows average surface temperatures over the summer period of 2006 at a 1km by 1km resolution. To find out more about LondUM, see the University of Reading’s website.
The hourly outputs from LondUM have been aggregated and mapped by Jonathon Taylor, UCL Institute for Environmental Design and Engineering. Variables include:
- WSAVGMAX= the average of the maximum daily temperatures across the summer period (May 26th-August 31st)
- WSAVG=the average temperature across the summer period
- WSAVGMIN = the average minimum daily temperature across the summer period
- HWAVGMAX= the average of the maximum daily temperatures across the 2006 heatwave (July 16th-19th)
- HWAVG=the average temperature across the across the 2006 heatwave
- HWAVGMIN = the average minimum daily temperature across 2006 heatwave period
The maps are also available as one combined PDF.
The gif below maps the temperatures across London during the four-day period of 16-19th July, which was considered a heatwave.
If you make use of the LondUM data, please use the following citation to acknowledge the data and reference the publication below for model description:
LondUM (2011). Model data generated by Sylvia I. Bohnenstengel (*), Department of Meteorology, University of Reading and data retrieved from http://www.met.reading.ac.uk/~sws07sib/home/LondUM.html.
(*) Now at Metoffice@Reading, Email: sylvia.bohnenstengel@metoffice.gov.uk
Bohnenstengel SI, Evans S, Clark P and Belcher SeE (2011) Simulations of the London Urban Heat island. Quarterly journal of the Royal Meteorological Society, 137(659). pp. 1625-1640. ISSN 1477-870X doi 10.1002/qj.855. LondUM data (2013).
Monthly Temperature Projections 2050-2079
- climatedataportal.metoffice.gov.uk
Updated Nov 3, 2021+ more versionsShareFacebookTwitterEmailClick to copy linkLink copiedCiteMet Office (2021). Monthly Temperature Projections 2050-2079 [Dataset]. https://climatedataportal.metoffice.gov.uk/datasets/monthly-temperature-projections-2050-2079Dataset updatedNov 3, 2021Area coveredDescriptionWhat does the data show?
This data shows monthly averages of surface temperature (°C) for 2050-2079 from the UKCP18 regional climate projections. The data is for the high emissions scenario (RCP8.5).
Limitations of the data
We recommend the use of multiple grid cells or an average of grid cells around a point of interest to help users get a sense of the variability in the area. This will provide a more robust set of values for informing decisions based on the data.
What are the naming conventions and how do I explore the data?
This data contains a field for the average over the period. They are named 'tas' (temperature at surface), the month, and 'upper' 'median' or 'lower'. E.g. 'tas July Median' is the median value for July.
To understand how to explore the data, see this page: https://storymaps.arcgis.com/stories/457e7a2bc73e40b089fac0e47c63a578
Please note, if viewing in ArcGIS Map Viewer, the map will default to ‘tas January Median’ values.
What do the ‘median’, ‘upper’, and ‘lower’ values mean?
Climate models are numerical representations of the climate system. To capture uncertainty in projections for the future, an ensemble, or group, of climate models are run. Each ensemble member has slightly different starting conditions or model set-ups. Considering all of the model outcomes gives users a range of plausible conditions which could occur in the future.
For this dataset, the model projections consist of 12 separate ensemble members. To select which ensemble members to use, the monthly averages of temperature for 2050-2079 were calculated for each ensemble member and they were then ranked in order from lowest to highest for each location.
The ‘lower’ fields are the second lowest ranked ensemble member. The ‘upper’ fields are the second highest ranked ensemble member. The ‘median’ field is the central value of the ensemble.
This gives a median value, and a spread of the ensemble members indicating the range of possible outcomes in the projections. This spread of outputs can be used to infer the uncertainty in the projections. The larger the difference between the lower and upper fields, the greater the uncertainty.
Data source
tas_rcp85_land-rcm_uk_12km_12_mon-30y_200912-207911.nc (median)
tas_rcp85_land-rcm_uk_12km_05_mon-30y_200912-207911.nc (lower)
tas_rcp85_land-rcm_uk_12km_04_mon-30y_200912-207911.nc (upper)
UKCP18 v20190731 (downloaded 04/11/2021)
Useful links
Further information on the UK Climate Projections (UKCP). Further information on understanding climate data within the Met Office Climate Data Portal
UKCP09: 5km gridded data - Annual Average - Summer (May-October) coldwave...
- data.wu.ac.at
- data.europa.eu
txtUpdated Jul 14, 2016+ more versionsShareFacebookTwitterEmailClick to copy linkLink copiedCiteMet Office (2016). UKCP09: 5km gridded data - Annual Average - Summer (May-October) coldwave duration [Dataset]. https://data.wu.ac.at/schema/data_gov_uk/ZjVlNzVkYzEtMWFiNS00NGFiLTlhOGYtM2Y5OWE5MGI2YTE2txtAvailable download formatsDataset updatedJul 14, 2016DescriptionUKCP09: 5 km gridded data - Annual averages for the summer coldwave duration. The data set contains 12 files (one for each month for the 1961-1990 average period). The individual grids are named according to the following convention: variablename_mmm_Average_Actual.txt where mmm is the month name (e.g. Jan).
The datasets have been created with financial support from the Department for Environment, Food and Rural Affairs (Defra) and they are being promoted by the UK Climate Impacts Programme (UKCIP) as part of the UK Climate Projections (UKCP09). http://ukclimateprojections.defra.gov.uk/content/view/12/689/.
To view this data you will have to register on the Met Office website, here: http://www.metoffice.gov.uk/research/climate/climate-monitoring/UKCP09/register
- n
IPCC AR5 Seasonal temperature and precipitation extremes in IPCC regions for...
- data-search.nerc.ac.uk
- catalogue.ceda.ac.uk
Updated Nov 24, 2023ShareFacebookTwitterEmailClick to copy linkLink copiedCite(2023). IPCC AR5 Seasonal temperature and precipitation extremes in IPCC regions for CMIP5 [Dataset]. https://data-search.nerc.ac.uk/geonetwork/srv/search?format=csv%20and%20xlsDataset updatedNov 24, 2023DescriptionProjected regional average change in seasonal and annual temperature and precipitation extremes for the IPCC SREX regions for CMIP5. The data were produced in 2013 by the Intergovernmental Panel on Climate Change (IPCC) Working Group II (WGII) Chapter 14 supplementary material (SM) author team for the IPCC Fifth Assessment Report (AR5). Regional average seasonal and annual temperature and precipitation extremes for the periods 2016-2035, 2046-2065 and 2081-2100 for CMIP5 General Circulation Model (GCM) projections are compared to a baseline of 1986-2005 from each model's historical simulation. The temperature and precipitation data are based on the difference between the projected periods and the historical baseline for which the 25th, 50th and 75th percentiles, and the lowest and highest responses among the 32 models which are expressed for temperature as degrees Celsius change and for precipitation as a per cent change. The temperature responses are averaged over the boreal winter and summer seasons; December, January, February (DJF) and June, July and August (JJA) respectively. The precipitation responses are averaged over half year periods, boreal winter (BW); October, November, December, January, February and March (ONDJFM) and boreal summer (BS); April, May, June, July, August and September (AMJJAS). Regional averages are based on the SREX regions defined by the IPCC Special Report on Managing the Risks of Extreme Events and Disasters to Advance Climate Change Adaptation (IPCC, 2012: also known as "SREX"). Added to the SREX regions are additional regions containing the two polar regions, the Caribbean, Indian Ocean and Pacific Island States. The data are further categorised by the land and sea mask for each SREX region.
- a
Annual Count of Hot Summer Days - Projections (12km)
- hub.arcgis.com
- climatedataportal.metoffice.gov.uk
Updated Feb 7, 2023+ more versionsShareFacebookTwitterEmailClick to copy linkLink copiedCiteMet Office (2023). Annual Count of Hot Summer Days - Projections (12km) [Dataset]. https://hub.arcgis.com/datasets/1a89ff97e169482291ed49ff29ce1120Dataset updatedFeb 7, 2023Dataset authored and provided byMet OfficeArea coveredDescription[Updated 28/01/25 to fix an issue in the ‘Lower’ values, which were not fully representing the range of uncertainty. ‘Median’ and ‘Higher’ values remain unchanged. The size of the change varies by grid cell and fixed period/global warming levels but the average difference between the 'lower' values before and after this update is 0.2.]What does the data show? The Annual Count of Hot Summer Days is the number of days per year where the maximum daily temperature is above 30°C. It measures how many times the threshold is exceeded (not by how much) in a year. Note, the term ‘hot summer days’ is used to refer to the threshold and temperatures above 30°C outside the summer months also contribute to the annual count. The results should be interpreted as an approximation of the projected number of days when the threshold is exceeded as there will be many factors such as natural variability and local scale processes that the climate model is unable to represent.The Annual Count of Hot Summer Days is calculated for two baseline (historical) periods 1981-2000 (corresponding to 0.51°C warming) and 2001-2020 (corresponding to 0.87°C warming) and for global warming levels of 1.5°C, 2.0°C, 2.5°C, 3.0°C, 4.0°C above the pre-industrial (1850-1900) period. This enables users to compare the future number of hot summer days to previous values.What are the possible societal impacts?The Annual Count of Hot Summer Days indicates increased health risks, transport disruption and damage to infrastructure from high temperatures. It is based on exceeding a maximum daily temperature of 30°C. Impacts include:Increased heat related illnesses, hospital admissions or death.Transport disruption due to overheating of railway infrastructure. Overhead power lines also become less efficient. Other metrics such as the Annual Count of Summer Days (days above 25°C), Annual Count of Extreme Summer Days (days above 35°C) and the Annual Count of Tropical Nights (where the minimum temperature does not fall below 20°C) also indicate impacts from high temperatures, however they use different temperature thresholds.What is a global warming level?The Annual Count of Hot Summer Days is calculated from the UKCP18 regional climate projections using the high emissions scenario (RCP 8.5) where greenhouse gas emissions continue to grow. Instead of considering future climate change during specific time periods (e.g. decades) for this scenario, the dataset is calculated at various levels of global warming relative to the pre-industrial (1850-1900) period. The world has already warmed by around 1.1°C (between 1850–1900 and 2011–2020), whilst this dataset allows for the exploration of greater levels of warming. The global warming levels available in this dataset are 1.5°C, 2°C, 2.5°C, 3°C and 4°C. The data at each warming level was calculated using a 21 year period. These 21 year periods are calculated by taking 10 years either side of the first year at which the global warming level is reached. This time will be different for different model ensemble members. To calculate the value for the Annual Count of Hot Summer Days, an average is taken across the 21 year period. Therefore, the Annual Count of Hot Summer Days show the number of hot summer days that could occur each year, for each given level of warming. We cannot provide a precise likelihood for particular emission scenarios being followed in the real world future. However, we do note that RCP8.5 corresponds to emissions considerably above those expected with current international policy agreements. The results are also expressed for several global warming levels because we do not yet know which level will be reached in the real climate as it will depend on future greenhouse emission choices and the sensitivity of the climate system, which is uncertain. Estimates based on the assumption of current international agreements on greenhouse gas emissions suggest a median warming level in the region of 2.4-2.8°C, but it could either be higher or lower than this level.What are the naming conventions and how do I explore the data?This data contains a field for each global warming level and two baselines. They are named ‘HSD’ (where HSD means Hot Summer Days), the warming level or baseline, and ‘upper’ ‘median’ or ‘lower’ as per the description below. E.g. ‘Hot Summer Days 2.5 median’ is the median value for the 2.5°C warming level. Decimal points are included in field aliases but not field names e.g. ‘Hot Summer Days 2.5 median’ is ‘HotSummerDays_25_median’. To understand how to explore the data, see this page: https://storymaps.arcgis.com/stories/457e7a2bc73e40b089fac0e47c63a578Please note, if viewing in ArcGIS Map Viewer, the map will default to ‘HSD 2.0°C median’ values.What do the ‘median’, ‘upper’, and ‘lower’ values mean?Climate models are numerical representations of the climate system. To capture uncertainty in projections for the future, an ensemble, or group, of climate models are run. Each ensemble member has slightly different starting conditions or model set-ups. Considering all of the model outcomes gives users a range of plausible conditions which could occur in the future. For this dataset, the model projections consist of 12 separate ensemble members. To select which ensemble members to use, the Annual Count of Hot Summer Days was calculated for each ensemble member and they were then ranked in order from lowest to highest for each location. The ‘lower’ fields are the second lowest ranked ensemble member. The ‘upper’ fields are the second highest ranked ensemble member. The ‘median’ field is the central value of the ensemble.This gives a median value, and a spread of the ensemble members indicating the range of possible outcomes in the projections. This spread of outputs can be used to infer the uncertainty in the projections. The larger the difference between the lower and upper fields, the greater the uncertainty.‘Lower’, ‘median’ and ‘upper’ are also given for the baseline periods as these values also come from the model that was used to produce the projections. This allows a fair comparison between the model projections and recent past. Useful linksThis dataset was calculated following the methodology in the ‘Future Changes to high impact weather in the UK’ report and uses the same temperature thresholds as the 'State of the UK Climate' report.Further information on the UK Climate Projections (UKCP).Further information on understanding climate data within the Met Office Climate Data Portal.
Average seasonal temperatures in the United Kingdom (UK) 1659-2023, by...
- statista.com
ShareFacebookTwitterEmailClick to copy linkLink copiedCiteStatista, Average seasonal temperatures in the United Kingdom (UK) 1659-2023, by period [Dataset]. https://www.statista.com/statistics/1033628/seasonal-periodic-temperatures-united-kingdom/Area coveredUnited KingdomDescriptionSeasonal mean temperatures in the United Kingdom have been on a mostly increasing trend since 1659. Between 2001 and 2023, the average temperature in summer and autumn in the UK stood at **** and **** degrees Celsius, respectively. During those same seasons, figures were at **** and *** degrees Celsius in the period from 1659 to 1700.
Digest of UK Energy Statistics (DUKES): weather
- gov.uk
Updated Jul 31, 2025ShareFacebookTwitterEmailClick to copy linkLink copiedCiteDepartment for Energy Security and Net Zero (2025). Digest of UK Energy Statistics (DUKES): weather [Dataset]. https://www.gov.uk/government/statistics/weather-digest-of-united-kingdom-energy-statistics-dukesDataset updatedJul 31, 2025AuthorsDepartment for Energy Security and Net ZeroArea coveredUnited KingdomDescriptionAnnual trends in temperature and heating degree days are produced as part of the annual Digest of UK Energy Statistics (DUKES).
These statistics provide some contextual information for consumption patterns in energy, referenced in the chapters for each energy type.
These statistics are published annually on the last Thursday of July.
Contact us
If you have questions about this content, please email: energy.stats@energysecurity.gov.uk
Classifications for three climate indicator values (CV): Mean January...
- plos.figshare.com
xlsUpdated Jun 1, 2023ShareFacebookTwitterEmailClick to copy linkLink copiedCiteAleksandra Kosanic; Karen Anderson; Stephan Harrison; Thea Turkington; Jonathan Bennie (2023). Classifications for three climate indicator values (CV): Mean January temperature (Tjan), mean July temperature (Tjul), and mean precipitation (RR). [Dataset]. http://doi.org/10.1371/journal.pone.0191021.t001xlsAvailable download formatsUnique identifierhttps://doi.org/10.1371/journal.pone.0191021.t001Dataset updatedJun 1, 2023AuthorsAleksandra Kosanic; Karen Anderson; Stephan Harrison; Thea Turkington; Jonathan BennieLicenseAttribution 4.0 (CC BY 4.0)https://creativecommons.org/licenses/by/4.0/
License information was derived automaticallyDescriptionClassifications for three climate indicator values (CV): Mean January temperature (Tjan), mean July temperature (Tjul), and mean precipitation (RR).
Average temperatures in the United Kingdom (UK) 1961-2023, by period
- statista.com
ShareFacebookTwitterEmailClick to copy linkLink copiedCiteStatista, Average temperatures in the United Kingdom (UK) 1961-2023, by period [Dataset]. https://www.statista.com/statistics/1033560/average-periodic-temperatures-united-kingdom/Area coveredUnited KingdomDescriptionThe average temperature across the United Kingdom presented a trend of continuous growth since 1961. During the first period, from 1961 to 1990, the country recorded an average temperature of *** degrees Celsius. In the next period, from 1991 to 2020, the UK's average temperature increased by *** degrees Celsius and increased further by *** degrees Celsius between 2014 and 2023. In the latter year, figures remained at ** degrees Celsius, *** degrees warmer than the average recorded between 1961 and 1990, illustrating the effects of climate change. Nevertheless, 2022 was the warmest year in the United Kingdom.
London's Urban Heat Island - Average Summer
- ckan.publishing.service.gov.uk
- data.europa.eu
- +1more
Updated Mar 23, 2017+ more versionsShareFacebookTwitterEmailClick to copy linkLink copiedCiteckan.publishing.service.gov.uk (2017). London's Urban Heat Island - Average Summer [Dataset]. https://ckan.publishing.service.gov.uk/dataset/londons-urban-heat-island-average-summerDataset updatedMar 23, 2017Area coveredLondonDescriptionFor an urban heat island map during a warm summer see this dataset. This map shows the results of an ‘UrbClim’ simulation for the mean temperature at midnight during the summer of 2011 (May to September) at a resolution of 250m. This summer has been selected as a typical summer for a West-European city. On average, the night-time temperature is approximately 4°C higher in the city centre. During some hot nights, even larger effects are observed. UrbClim is an urban climate model designed to model and study the urban heat island effect (UHI) at a spatial resolution of a few hundred meters. This project was carried out by VITO as part of an EU-funded RAMSES programme on the urban impacts of climate change. For more information about the model, please see the Technical Information and Interpretation report. Please direct any enquiries to Hans Hooyberghs (hans.hooyberghs@vito.be) or Koen De Ridder (koen.deridder@vito.be).
UKCP09: Gridded Datasets of Annual values of Growing season length (days) -...
- ckan.publishing.service.gov.uk
Updated Jan 26, 2011+ more versionsShareFacebookTwitterEmailClick to copy linkLink copiedCiteckan.publishing.service.gov.uk (2011). UKCP09: Gridded Datasets of Annual values of Growing season length (days) - Dataset - data.gov.uk [Dataset]. https://ckan.publishing.service.gov.uk/dataset/ukcp09-gridded-annual-datasets-of-growing-season-length-daysDataset updatedJan 26, 2011DescriptionUKCP09: Gridded datasets of annual values. The day-by-day sum of the mean number of degrees by which the air temperature is more than a value of 22 °C Period bounded by daily mean temperature >5 °C for >5 consecutive days and daily mean temperature 5 consecutive days (after 1 July). The datasets have been created with financial support from the Department for Environment, Food and Rural Affairs (Defra) and they are being promoted by the UK Climate Impacts Programme (UKCIP) as part of the UK Climate Projections (UKCP09). http://ukclimateprojections.defra.gov.uk/content/view/12/689/. To view this data you will have to register on the Met Office website, here: http://www.metoffice.gov.uk/climatechange/science/monitoring/ukcp09/gds_form.html.
 FacebookTwitter
Monthly average daily temperatures in the United Kingdom 2015-2024
The highest average temperature recorded in 2024 until November was in August, at 16.8 degrees Celsius. Since 2015, the highest average daily temperature in the UK was registered in July 2018, at 18.7 degrees Celsius. The summer of 2018 was the joint hottest since institutions began recording temperatures in 1910. One noticeable anomaly during this period was in December 2015, when the average daily temperature reached 9.5 degrees Celsius. This month also experienced the highest monthly rainfall in the UK since before 2014, with England, Wales, and Scotland suffering widespread flooding. Daily hours of sunshine Unsurprisingly, the heat wave that spread across the British Isles in 2018 was the result of particularly sunny weather. July 2018 saw an average of 8.7 daily sun hours in the United Kingdom. This was more hours of sun than was recorded in July 2024, which only saw 5.8 hours of sun. Temperatures are on the rise Since the 1960s, there has been an increase in regional temperatures across the UK. Between 1961 and 1990, temperatures in England averaged nine degrees Celsius, and from 2013 to 2022, average temperatures in the country had increased to 10.3 degrees Celsius. Due to its relatively southern location, England continues to rank as the warmest country in the UK.