- g
Map Viewing Service (WMS) of the dataset: Strategic Map of Road...
- gimi9.com
+ more versions Share
Share Facebook
 Twitter
 EmailClick to copy linkLink copiedCiteMap Viewing Service (WMS) of the dataset: Strategic Map of Road Infrastructure Noise: type B [Dataset]. https://gimi9.com/dataset/eu_fr-120066022-srv-b306cf3c-1080-411f-bb0f-8b3b6b7fe48eLicense
CC0 1.0 Universal Public Domain Dedicationhttps://creativecommons.org/publicdomain/zero/1.0/
License information was derived automaticallyDescriptionThe strategic noise maps (CBS) are derived from the European Directive 2002/49/EC on the assessment and management of environmental noise. They are intended to inform the public about the levels of exposure to noise through graphic representations. In accordance with Article R572-5 of the Environmental Code, the CBS shall include maps of the areas affected by noise as defined by sound classification orders, known as ‘type B map’. Only classified lanes with an annual traffic of more than 3 million vehicles are visible. Sound classification orders are rules of constructability applicable in the sectors defined on both sides of the channels classified in accordance with articles R. 571-37 and R. 571-38 of the Environmental Code. The CBS of the major road infrastructure, whose annual traffic is more than 3 million vehicles, with a deadline for the Val-d’Oise, were approved by prefectural decree of 5 December 2018. They must be reassessed every 5 years.
- g
Map Viewing Service (WMS) of the dataset: Strategic Map of Iron...
- gimi9.com
Updated Feb 1, 2001+ more versionsShareFacebookTwitterEmailClick to copy linkLink copiedCite(2001). Map Viewing Service (WMS) of the dataset: Strategic Map of Iron Infrastructure Noise: type B [Dataset]. https://gimi9.com/dataset/eu_fr-120066022-srv-25ccb6c4-9685-49ab-ab08-8fd872295ea0Dataset updatedFeb 1, 2001LicenseCC0 1.0 Universal Public Domain Dedicationhttps://creativecommons.org/publicdomain/zero/1.0/
License information was derived automaticallyDescriptionThe strategic noise maps (CBS) are derived from the European Directive 2002/49/EC on the assessment and management of environmental noise. They are intended to inform the public about the levels of exposure to noise through graphic representations. In accordance with Article R572-5 of the Environmental Code, the CBS shall include maps of the areas affected by noise as defined by sound classification orders, known as ‘type B map’. Only classified tracks with annual traffic exceeding 30,000 train crossings are visible. Sound classification orders are rules of constructability applicable in the sectors defined on both sides of the channels classified in accordance with articles R. 571-37 and R. 571-38 of the Environmental Code. The CBS for major railway infrastructure, whose annual traffic is more than 30,000 train crossings, by the deadline of the Val-d’Oise, were approved by prefectural decree of 5 December 2018. They must be reassessed every 5 years.
- C
CBS Existing Land Use (INSPIRE harmonized) WFS
- ckan.mobidatalab.eu
wfsUpdated May 9, 2023+ more versionsShareFacebookTwitterEmailClick to copy linkLink copiedCiteNationaalGeoregisterNL (2023). CBS Existing Land Use (INSPIRE harmonized) WFS [Dataset]. https://ckan.mobidatalab.eu/dataset/cbs-existing-land-use-inspire-harmonized-wfswfsAvailable download formatsDataset updatedMay 9, 2023Dataset provided byNationaalGeoregisterNLDescriptionThis is the INSPIRE Existing Land Use data set of the Netherlands. It is based on the topographical map of the Netherlands (BRT) and aerial photo's.
- g
Dataset Direct Download Service (WFS): Strategic Map of Road Infrastructure...
- gimi9.com
Updated Sep 17, 2021+ more versionsShareFacebookTwitterEmailClick to copy linkLink copiedCite(2021). Dataset Direct Download Service (WFS): Strategic Map of Road Infrastructure Noise: type C Lden [Dataset]. https://gimi9.com/dataset/eu_fr-120066022-srv-11d59c67-89fc-4be1-8f4a-9cc6e3df9f4dDataset updatedSep 17, 2021LicenseCC0 1.0 Universal Public Domain Dedicationhttps://creativecommons.org/publicdomain/zero/1.0/
License information was derived automaticallyDescriptionThe strategic noise maps (CBS) are derived from the European Directive 2002/49/EC on the assessment and management of environmental noise. They are intended to inform the public about the levels of exposure to noise through graphic representations. In accordance with article R572-5 of the Environmental Code, the CBS include maps of areas where the noise level exceeds 62 dB(A) in Ln (level night, night indicator from 22h to 6h). They are called ‘C-type card’. Limit values in dB(A) are defined by article L572-6 of the Environmental Code. The CBS of the major road infrastructure, whose annual traffic is more than 3 million vehicles, with a deadline for the Val-d’Oise, were approved by prefectural decree of 5 December 2018. They must be reassessed every 5 years.
- f
Additional file 5 of A proactive genotype-to-patient-phenotype map for...
- springernature.figshare.com
xlsxUpdated Feb 14, 2024ShareFacebookTwitterEmailClick to copy linkLink copiedCiteSong Sun; Jochen Weile; Marta Verby; Yingzhou Wu; Yang Wang; Atina Cote; Iosifina Fotiadou; Julia Kitaygorodsky; Marc Vidal; Jasper Rine; Pavel Ješina; Viktor Kožich; Frederick Roth (2024). Additional file 5 of A proactive genotype-to-patient-phenotype map for cystathionine beta-synthase [Dataset]. http://doi.org/10.6084/m9.figshare.11775981.v1xlsxAvailable download formatsUnique identifierhttps://doi.org/10.6084/m9.figshare.11775981.v1Dataset updatedFeb 14, 2024Dataset provided byfigshareAuthorsSong Sun; Jochen Weile; Marta Verby; Yingzhou Wu; Yang Wang; Atina Cote; Iosifina Fotiadou; Julia Kitaygorodsky; Marc Vidal; Jasper Rine; Pavel Ješina; Viktor Kožich; Frederick RothLicenseAttribution 4.0 (CC BY 4.0)https://creativecommons.org/licenses/by/4.0/
License information was derived automaticallyDescriptionAdditional file 5: Table S3. Relative in vitro catalytic activity for 24 CBS missense variants expressed in E. coli and their corresponding high vitamin B6 VE map fitness scores.
- e
Natural Capital Accounts (2021) (CBS)
- data.europa.eu
wmsUpdated Aug 31, 2024ShareFacebookTwitterEmailClick to copy linkLink copiedCite(2024). Natural Capital Accounts (2021) (CBS) [Dataset]. https://data.europa.eu/data/datasets/5cfa7b2c-d384-43cd-ac38-b9aab23b0e2c?locale=enwmsAvailable download formatsDataset updatedAug 31, 2024DescriptionThe aim of the Natural Capital Accounts of Statistics Netherlands (CBS) is to map the relationship between nature, economy and human activities in a clear way - literally. CBS is working with Wageningen University on behalf of the Ministry of Agriculture, Nature and Food Quality (LNV) on the development of models, data and maps that provide a spatial and as complete as possible picture of the current state of natural capital in the Netherlands. For more information: https://www.cbs.nl/en-en/society/nature-and-environment/natural-capital
The following CBS maps have been made available for the Atlas of Natural Capital (https://www.atlasnatuurlijkkapitaal.nl). See the Natural Capital Atlas for the explanatory notes per map, or consult the technical explanatory notes (https://www.cbs.nl/en-nl/maatschappij/nature-en-milieu/natural-capital/technical-explanatory notes). For most ecosystem services, both physical and monetary (use) values have been mapped. The unit of the card is therefore stated in the card name, as well as the resolution and the reference year.
Producing ecosystem services: Production of food and ornamental crops (2021) Livestock fodder production (2021) Wood supply (2021)
Regulatory ecosystem services: Pollination (2021) Carbon sequestration (global climate regulation) (2021) Air filtration (2021) Rainwater regulation (2020) Reduction of UHI (local climate regulation) (2021)
Cultural ecosystem services: Green liveability (2021) Nature recreation (2021) Nature tourism (2021)
Apertif drift scan based compound beam maps (1130-1430 MHz)
- data.europa.eu
- data.niaid.nih.gov
- +1more
unknownUpdated Jun 5, 2022+ more versionsShareFacebookTwitterEmailClick to copy linkLink copiedCiteZenodo (2022). Apertif drift scan based compound beam maps (1130-1430 MHz) [Dataset]. https://data.europa.eu/data/datasets/oai-zenodo-org-6544219?locale=mtunknown(239261677)Available download formatsDataset updatedJun 5, 2022LicenseAttribution 4.0 (CC BY 4.0)https://creativecommons.org/licenses/by/4.0/
License information was derived automaticallyDescriptionApertif (APERture Tile In Focus) is a Phased Array Feed (PAF) system on the Westerbork Synthesis Radio Telescope (WSRT) that conducted the Apertif legacy surveys between the 1st of July 2019 and the 28th of February 2022. Apertif carried out a two tiered imaging survey, with a shallow, wide-area and a medium-deep, small-area component, and a time domain survey. In the standard observing mode for imaging 40 partially overlapping compound beams (CBs) are formed simultaneously in a rectangular configuration. Each of these 40 CBs have a unique shape that differs substantially from the "old" WSRT beam shape. This data set contains Apertif drift scan based CB maps measured at the first Apertif imaging survey frequency setting (1130-1430 MHz). Apertif imaging observations were take at these frequencies between July 2019 and January 2021. The CB maps are generated from drift scan observations using the AperPB scrips (DOI: https://doi.org/10.5281/zenodo.6544109). These CB maps can be used to primary beam correct or mosaic images or data cubes from the Apertif imaging surveys. The dataset contains two types of fits files: 1) Reconstructed CB maps from the drift scans. These maps are within directories called "drift_maps" and have the following naming scheme:
Dutch Municipality Region Code Map
- kaggle.com
zipUpdated Oct 16, 2022ShareFacebookTwitterEmailClick to copy linkLink copiedCiteMegan (2022). Dutch Municipality Region Code Map [Dataset]. https://www.kaggle.com/datasets/megan3/dutch-municipality-region-code-mapzip(5010 bytes)Available download formatsDataset updatedOct 16, 2022AuthorsMeganLicensehttps://creativecommons.org/publicdomain/zero/1.0/https://creativecommons.org/publicdomain/zero/1.0/
Area coveredNetherlandsDescriptionThis matches the Dutch regions with municipalities based on IDs. Data is from CBS for the year 2021.
I created this specifically to use with the Dutch crime dataset.
Example: GM1680 Aa en Hunze RE01 Noord-Nederland
Source: https://opendata.cbs.nl/statline/#/CBS/nl/dataset/84929NED/table?dl=343E
- e
Simple download service (Atom) of the dataset: Noise Zones (Type B Map) of...
- data.europa.eu
unknownUpdated Feb 18, 2022ShareFacebookTwitterEmailClick to copy linkLink copiedCite(2022). Simple download service (Atom) of the dataset: Noise Zones (Type B Map) of A8, licensed national road network [Dataset]. https://data.europa.eu/data/datasets/fr-120066022-srv-43f23f92-739f-4a49-833d-403f62056164unknownAvailable download formatsDataset updatedFeb 18, 2022DescriptionEuropean Directive 2002/49/EC of 25 June 2002 on the assessment and management of environmental noise entails for EU Member States an assessment of environmental noise in the vicinity of major transport infrastructure (land and air) and in large agglomerations. This assessment is carried out in particular through the development of ‘so-called’ noise maps, the first series of which were drawn up in 2007 (1st deadline of the Directive) and 2012 (2nd deadline). Article L572-5 of the Environmental Code states that these maps are “reviewed, and if necessary revised, at least every five years”. Thus, the implementation of this review leads, in 2017 and as appropriate, to revise or renew the maps previously developed.
Strategic Noise Maps (CBS) are designed to allow for the overall assessment of exposure to noise and to forecast its evolution.
CBS are required in particular for road infrastructure with annual traffic of more than 3 million vehicles per year. For major road and rail transport infrastructure, the CBS are established, decided and approved under the authority of the prefect of the department.
Noise maps are developed according to the indicators established by the European Directive, namely Lden (Day Evening Night Level) and Ln (Night Level). • Day/day: [6h-18h] • Evening/evening: [18h-22h] • Night/night: [22h-6h] The Lden and Ln indicators correspond to a defined energy average over the periods (Day/Black/Night) for Lden and (Night) for Ln. The corresponding results are expressed in A or dB(A) weighted decibels.
Type B maps correspond to the areas affected by noise in accordance with the noise classification of land transport infrastructure which has been drawn up and adopted by the Prefect pursuant to Article L571-10 of the Environmental Code. This classification defines, for future residential, educational, health and hotel buildings located in these areas affected by noise, a minimum sound isolation of buildings. These requirements are laid down in the Decree of 30 May 1996 as amended by Decree of 23 July 2013.
Additional file 1 of A proactive genotype-to-patient-phenotype map for...
- figshare.com
xlsxUpdated Feb 14, 2024ShareFacebookTwitterEmailClick to copy linkLink copiedCiteSong Sun; Jochen Weile; Marta Verby; Yingzhou Wu; Yang Wang; Atina Cote; Iosifina Fotiadou; Julia Kitaygorodsky; Marc Vidal; Jasper Rine; Pavel Ješina; Viktor Kožich; Frederick Roth (2024). Additional file 1 of A proactive genotype-to-patient-phenotype map for cystathionine beta-synthase [Dataset]. http://doi.org/10.6084/m9.figshare.11775963.v1xlsxAvailable download formatsUnique identifierhttps://doi.org/10.6084/m9.figshare.11775963.v1Dataset updatedFeb 14, 2024AuthorsSong Sun; Jochen Weile; Marta Verby; Yingzhou Wu; Yang Wang; Atina Cote; Iosifina Fotiadou; Julia Kitaygorodsky; Marc Vidal; Jasper Rine; Pavel Ješina; Viktor Kožich; Frederick RothLicenseAttribution 4.0 (CC BY 4.0)https://creativecommons.org/licenses/by/4.0/
License information was derived automaticallyDescriptionAdditional file 1: Table S1. Selected CBS variants and prediction scores for evaluation of prediction performance.
- N
Network Localization of atrophy patterns in corticobasal syndrome: Atrophy...
- neurovault.org
niftiUpdated Sep 29, 2020+ more versionsShareFacebookTwitterEmailClick to copy linkLink copiedCite(2020). Network Localization of atrophy patterns in corticobasal syndrome: Atrophy network mapping CBS v controls snpmT+ [Dataset]. http://identifiers.org/neurovault.image:396575niftiAvailable download formatsUnique identifierhttps://identifiers.org/neurovault.image:396575Dataset updatedSep 29, 2020LicenseCC0 1.0 Universal Public Domain Dedicationhttps://creativecommons.org/publicdomain/zero/1.0/
License information was derived automaticallyDescription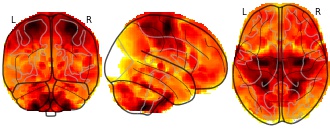
Collection description
Subject species
homo sapiens
Modality
Other
Analysis level
group
Cognitive paradigm (task)
None / Other
Map type
Other
- g
Simple download service (Atom) of the dataset: Strategic Map of Road...
- gimi9.com
+ more versionsShareFacebookTwitterEmailClick to copy linkLink copiedCiteSimple download service (Atom) of the dataset: Strategic Map of Road Infrastructure Noise: type B [Dataset]. https://gimi9.com/dataset/eu_fr-120066022-srv-32858912-cfdc-4978-b7bf-dccce8cde050/LicenseCC0 1.0 Universal Public Domain Dedicationhttps://creativecommons.org/publicdomain/zero/1.0/
License information was derived automaticallyDescriptionThe strategic noise maps (CBS) are derived from the European Directive 2002/49/EC on the assessment and management of environmental noise. They are intended to inform the public about the levels of exposure to noise through graphic representations. In accordance with Article R572-5 of the Environmental Code, the CBS shall include maps of the areas affected by noise as defined by sound classification orders, known as ‘type B map’. Only classified lanes with an annual traffic of more than 3 million vehicles are visible. Sound classification orders are rules of constructability applicable in the sectors defined on both sides of the channels classified in accordance with articles R. 571-37 and R. 571-38 of the Environmental Code. The CBS of the major road infrastructure, whose annual traffic is more than 3 million vehicles, with a deadline for the Val-d’Oise, were approved by prefectural decree of 5 December 2018. They must be reassessed every 5 years.
- N
Plasma phosphorylated tau 217 and phosphorylated tau 181 as biomarkers in...
- neurovault.org
niftiUpdated Mar 25, 2021+ more versionsShareFacebookTwitterEmailClick to copy linkLink copiedCite(2021). Plasma phosphorylated tau 217 and phosphorylated tau 181 as biomarkers in Alzheimer's disease and frontotemporal lobar degeneration: a retrospective diagnostic performance study: Correlation between pTau181 and tau-PET in the CBS group | R map [Dataset]. http://identifiers.org/neurovault.image:408021niftiAvailable download formatsUnique identifierhttps://identifiers.org/neurovault.image:408021Dataset updatedMar 25, 2021LicenseCC0 1.0 Universal Public Domain Dedicationhttps://creativecommons.org/publicdomain/zero/1.0/
License information was derived automaticallyDescriptionClinical Dx of corticobasal syndrome. No covariate. Positive contrast. Gray matter masked at analysis level. SPM T-map converted to R map using CAT12 without thresholding. R=0.51 corresponds to p<.001 uncorrected threshold and R=0.69 to p<.05 FWE-corrected.
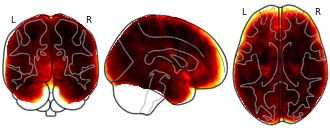
Collection description
Data from Thijssen, La Joie et al, Lancet Neurology (2021).
Voxelwise analyses between whole brain tau-PET or MRI volume and plasma pTau181 or pTau217.Subject species
homo sapiens
Modality
PET other
Analysis level
group
Cognitive paradigm (task)
None / Other
Map type
Other
Land Use
- nationaalgeoregister.nl
- ckan.mobidatalab.eu
- +5more
inspire atom +3Updated Sep 5, 2022+ more versionsShareFacebookTwitterEmailClick to copy linkLink copiedCiteStatistics Netherlands (2022). Land Use [Dataset]. https://www.nationaalgeoregister.nl/geonetwork/srv/api/records/6318009c-7b11-4ab9-9929-735584dfb692ogc:wfs, inspire atom, ogc:wms, ogc:api featuresAvailable download formatsDataset updatedSep 5, 2022Dataset authored and provided byStatistics NetherlandsLicensehttp://inspire.ec.europa.eu/metadata-codelist/ConditionsApplyingToAccessAndUse/noConditionsApplyhttp://inspire.ec.europa.eu/metadata-codelist/ConditionsApplyingToAccessAndUse/noConditionsApply
Attribution 4.0 (CC BY 4.0)https://creativecommons.org/licenses/by/4.0/
License information was derived automaticallyhttp://inspire.ec.europa.eu/metadata-codelist/LimitationsOnPublicAccess/noLimitationshttp://inspire.ec.europa.eu/metadata-codelist/LimitationsOnPublicAccess/noLimitations
Time period coveredJul 1, 2015 - Jul 31, 2015Area coveredDescriptionThis is the INSPIRE Existing Land Use data set of the Netherlands. It is based on the topographical map of the Netherlands (BRT) and aerial photo's of summer of 2017.
Additional file 4 of A proactive genotype-to-patient-phenotype map for...
- springernature.figshare.com
xlsxUpdated Feb 14, 2024ShareFacebookTwitterEmailClick to copy linkLink copiedCiteSong Sun; Jochen Weile; Marta Verby; Yingzhou Wu; Yang Wang; Atina Cote; Iosifina Fotiadou; Julia Kitaygorodsky; Marc Vidal; Jasper Rine; Pavel Ješina; Viktor Kožich; Frederick Roth (2024). Additional file 4 of A proactive genotype-to-patient-phenotype map for cystathionine beta-synthase [Dataset]. http://doi.org/10.6084/m9.figshare.11775978.v1xlsxAvailable download formatsUnique identifierhttps://doi.org/10.6084/m9.figshare.11775978.v1Dataset updatedFeb 14, 2024AuthorsSong Sun; Jochen Weile; Marta Verby; Yingzhou Wu; Yang Wang; Atina Cote; Iosifina Fotiadou; Julia Kitaygorodsky; Marc Vidal; Jasper Rine; Pavel Ješina; Viktor Kožich; Frederick RothLicenseAttribution 4.0 (CC BY 4.0)https://creativecommons.org/licenses/by/4.0/
License information was derived automaticallyDescriptionAdditional file 4: Table S2. Plasma CBS activity in vitamin B6 responder and non-responder.
- C
District and Neighborhood Map 2017 version 3
- ckan.mobidatalab.eu
Updated Jul 13, 2023+ more versionsShareFacebookTwitterEmailClick to copy linkLink copiedCiteOverheidNl (2023). District and Neighborhood Map 2017 version 3 [Dataset]. https://ckan.mobidatalab.eu/lv/dataset/13120-wijk-en-buurtkaart-2017-versie-3http://publications.europa.eu/resource/authority/file-type/png, http://publications.europa.eu/resource/authority/file-type/wfs_srvc, http://publications.europa.eu/resource/authority/file-type/wms_srvc, http://publications.europa.eu/resource/authority/file-type/atom, http://publications.europa.eu/resource/authority/file-type/zipAvailable download formatsDataset updatedJul 13, 2023Dataset provided byOverheidNlLicenseAttribution 4.0 (CC BY 4.0)https://creativecommons.org/licenses/by/4.0/
License information was derived automaticallyDescriptionThe File Wijk- en Buurtkaart 2017 contains the geometry of all municipalities, districts and neighborhoods in the Netherlands, with a number of statistical key figures as an attribute. The boundaries of districts and neighborhoods are based on what the municipalities pass on to Statistics Netherlands. The municipal boundary comes from the BRK of the Land Registry. This third version contains the most key figures. For more information, read the following document: https://www.cbs.nl/-/media/cbs/dossiers/nederland%20regionaal/wijk-en-buurtstatistieken/_pdf/toelichting-wijk-en-buurtkaart-2017-2018- en-2019.pdf
- e
Simple download service (Atom) of the dataset: Noise zones (Type C map, LD...
- data.europa.eu
unknownUpdated Feb 18, 2022ShareFacebookTwitterEmailClick to copy linkLink copiedCite(2022). Simple download service (Atom) of the dataset: Noise zones (Type C map, LD index) of the A8, licensed national road network [Dataset]. https://data.europa.eu/88u/dataset/fr-120066022-srv-4b87a879-e737-44c6-90ea-a039ddf3c6ccunknownAvailable download formatsDataset updatedFeb 18, 2022DescriptionEuropean Directive 2002/49/EC of 25 June 2002 on the assessment and management of environmental noise entails for EU Member States an assessment of environmental noise in the vicinity of major transport infrastructure (land and air) and in large agglomerations. This assessment is carried out in particular through the development of ‘so-called’ noise maps, the first series of which were drawn up in 2007 (1st deadline of the Directive) and 2012 (2nd deadline). Article L572-5 of the Environmental Code states that these maps are “reviewed, and if necessary revised, at least every five years”. Thus, the implementation of this review leads, in 2017 and as appropriate, to revise or renew the maps previously developed.
Strategic Noise Maps (CBS) are designed to allow for the overall assessment of exposure to noise and to forecast its evolution.
CBS are required in particular for road infrastructure with annual traffic of more than 3 million vehicles per year. For major road and rail transport infrastructure, the CBS are established, decided and approved under the authority of the prefect of the department.
Noise maps are developed according to the indicators established by the European Directive, namely Lden (Day Evening Night Level) and Ln (Night Level). • Day/day: [6h-18h] • Evening/evening: [18h-22h] • Night/night: [22h-6h] The Lden and Ln indicators correspond to a defined energy average over the periods (Day/Black/Night) for Lden and (Night) for Ln. The corresponding results are expressed in A or dB(A) weighted decibels.
Type C maps represent areas where noise limit values are exceeded for residential, educational and health buildings. For road and high-speed railway lines, the limit values are 68 dB(A) in Lden and 62 dB(A) in Ln.
- e
Simple download service (Atom) of the dataset: Noise Areas (Type B Map) of...
- data.europa.eu
unknownUpdated Feb 18, 2022ShareFacebookTwitterEmailClick to copy linkLink copiedCite(2022). Simple download service (Atom) of the dataset: Noise Areas (Type B Map) of metropolitan areas Toulon Provence Mediterranean [Dataset]. https://data.europa.eu/88u/dataset/fr-120066022-srv-1876a4c8-6603-4e2f-b1da-3d6737d5a968unknownAvailable download formatsDataset updatedFeb 18, 2022DescriptionEuropean Directive 2002/49/EC of 25 June 2002 on the assessment and management of environmental noise entails for EU Member States an assessment of environmental noise in the vicinity of major transport infrastructure (land and air) and in large agglomerations. This assessment is carried out in particular through the development of ‘so-called’ noise maps, the first series of which were drawn up in 2007 (1st deadline of the Directive) and 2012 (2nd deadline). Article L572-5 of the Environmental Code states that these maps are “reviewed, and if necessary revised, at least every five years”. Thus, the implementation of this review leads, in 2017 and as appropriate, to revise or renew the maps previously developed.
Strategic Noise Maps (CBS) are designed to allow for the overall assessment of exposure to noise and to forecast its evolution.
CBS are required in particular for road infrastructure with annual traffic of more than 3 million vehicles per year. For major road and rail transport infrastructure, the CBS are established, decided and approved under the authority of the prefect of the department.
Noise maps are developed according to the indicators established by the European Directive, namely Lden (Day Evening Night Level) and Ln (Night Level). • Day/day: [6h-18h] • Evening/evening: [18h-22h] • Night/night: [22h-6h] The Lden and Ln indicators correspond to a defined energy average over the periods (Day/Black/Night) for Lden and (Night) for Ln. The corresponding results are expressed in A or dB(A) weighted decibels.
Type B maps correspond to the areas affected by noise in accordance with the noise classification of land transport infrastructure which has been drawn up and adopted by the Prefect pursuant to Article L571-10 of the Environmental Code.
This classification defines, for future residential, educational, health and hotel buildings located in these areas affected by noise, a minimum sound isolation of buildings. These requirements are laid down in the Decree of 30 May 1996 as amended by Decree of 23 July 2013.
For a list of pathways, please refer to the non-technical summary (page 9).
- e
Dataset Direct Download Service (WFS): Noise zones (Map of type A, index LN)...
- data.europa.eu
unknownUpdated Feb 18, 2022+ more versionsShareFacebookTwitterEmailClick to copy linkLink copiedCite(2022). Dataset Direct Download Service (WFS): Noise zones (Map of type A, index LN) of metropolitan areas Toulon Provence Mediterranean [Dataset]. https://data.europa.eu/data/datasets/fr-120066022-srv-78ee1351-6bb1-4200-ab4c-35524eab4fa0?locale=enunknownAvailable download formatsDataset updatedFeb 18, 2022DescriptionEuropean Directive 2002/49/EC of 25 June 2002 on the assessment and management of environmental noise entails for EU Member States an assessment of environmental noise in the vicinity of major transport infrastructure (land and air) and in large agglomerations. This assessment is carried out in particular through the development of ‘so-called’ noise maps, the first series of which were drawn up in 2007 (1st deadline of the Directive) and 2012 (2nd deadline). Article L572-5 of the Environmental Code states that these maps are “reviewed, and if necessary revised, at least every five years”. Thus, the implementation of this review leads, in 2017 and as appropriate, to revise or renew the maps previously developed.
Strategic Noise Maps (CBS) are designed to allow for the overall assessment of exposure to noise and to forecast its evolution.
CBS are required in particular for road infrastructure with annual traffic of more than 3 million vehicles per year. For major road and rail transport infrastructure, the CBS are established, decided and approved under the authority of the prefect of the department.
Noise maps are developed according to the indicators established by the European Directive, namely Lden (Day Evening Night Level) and Ln (Night Level). • Day/day: [6h-18h] • Evening/evening: [18h-22h] • Night/night: [22h-6h] The Lden and Ln indicators correspond to a defined energy average over the periods (Day/Black/Night) for Lden and (Night) for Ln. The corresponding results are expressed in A or dB(A) weighted decibels.
Areas exposed to noise (type A map): These are two cards representing • areas exposed to more than 55 dB(A) in Lden • areas exposed to more than 50 dB(A) in Ln They are presented in the form of isophone curves materialising areas of the same sound level and are plotted by step of 5 dB(A) from the threshold of 55 dB(A) in Lden and 50 dB(A) in Ln.
For a list of pathways, please refer to the non-technical summary (page 9).
- e
Noise Zones (Type B Map) of the RN98, unlicensed national road network
- data.europa.eu
Updated Feb 19, 2022+ more versionsShareFacebookTwitterEmailClick to copy linkLink copiedCite(2022). Noise Zones (Type B Map) of the RN98, unlicensed national road network [Dataset]. https://data.europa.eu/data/datasets/fr-120066022-jdd-375e3eea-8369-452d-a252-d1c18665c4a6Dataset updatedFeb 19, 2022DescriptionEuropean Directive 2002/49/EC of 25 June 2002 on the assessment and management of environmental noise entails for EU Member States an assessment of environmental noise in the vicinity of major transport infrastructure (land and air) and in large agglomerations. This assessment is carried out in particular through the development of ‘so-called’ noise maps, the first series of which were drawn up in 2007 (1st deadline of the Directive) and 2012 (2nd deadline). Article L572-5 of the Environmental Code states that these maps are “reviewed, and if necessary revised, at least every five years”. Thus, the implementation of this review leads, in 2017 and as appropriate, to revise or renew the maps previously developed.
Strategic Noise Maps (CBS) are designed to allow for the overall assessment of exposure to noise and to forecast its evolution.
CBS are required in particular for road infrastructure with annual traffic of more than 3 million vehicles per year. For major road and rail transport infrastructure, the CBS are established, decided and approved under the authority of the prefect of the department.
Noise maps are developed according to the indicators established by the European Directive, namely Lden (Day Evening Night Level) and Ln (Night Level). • Day/day: [6h-18h] • Evening/evening: [18h-22h] • Night/night: [22h-6h] The Lden and Ln indicators correspond to a defined energy average over the periods (Day/Black/Night) for Lden and (Night) for Ln. The corresponding results are expressed in A or dB(A) weighted decibels.
Type B maps correspond to the areas affected by noise in accordance with the noise classification of land transport infrastructure which has been drawn up and adopted by the Prefect pursuant to Article L571-10 of the Environmental Code. This classification defines, for future residential, educational, health and hotel buildings located in these areas affected by noise, a minimum sound isolation of buildings. These requirements are laid down in the Decree of 30 May 1996 as amended by Decree of 23 July 2013.
FacebookTwitterCC0 1.0 Universal Public Domain Dedicationhttps://creativecommons.org/publicdomain/zero/1.0/
License information was derived automatically
The strategic noise maps (CBS) are derived from the European Directive 2002/49/EC on the assessment and management of environmental noise. They are intended to inform the public about the levels of exposure to noise through graphic representations. In accordance with Article R572-5 of the Environmental Code, the CBS shall include maps of the areas affected by noise as defined by sound classification orders, known as ‘type B map’. Only classified lanes with an annual traffic of more than 3 million vehicles are visible. Sound classification orders are rules of constructability applicable in the sectors defined on both sides of the channels classified in accordance with articles R. 571-37 and R. 571-38 of the Environmental Code. The CBS of the major road infrastructure, whose annual traffic is more than 3 million vehicles, with a deadline for the Val-d’Oise, were approved by prefectural decree of 5 December 2018. They must be reassessed every 5 years.