- l
Election 2010 Results By Ward
- opendata.london.ca
Updated Mar 13, 2019+ more versions Share
Share Facebook
 Twitter
 EmailClick to copy linkLink copiedCiteopendata_London (2019). Election 2010 Results By Ward [Dataset]. https://opendata.london.ca/documents/96258a4b9be64768acfafcc4f34bea56Dataset updatedMar 13, 2019Dataset authored and provided byopendata_LondonDescription
This displays votes for the City of London, Ontario 2010 municipal election. There are columns for candidate, number of votes and percentage of votes.
Ward Profiles and Atlas - Dataset - data.gov.uk
- ckan.publishing.service.gov.uk
Updated Mar 23, 2017+ more versionsShareFacebookTwitterEmailClick to copy linkLink copiedCiteckan.publishing.service.gov.uk (2017). Ward Profiles and Atlas - Dataset - data.gov.uk [Dataset]. https://ckan.publishing.service.gov.uk/dataset/ward-profiles-and-atlasDataset updatedMar 23, 2017DescriptionThe ward profiles and ward atlas provide a range of demographic and related data for each ward in Greater London. They are designed to provide an overview of the population in these small areas by presenting a range of data on the population, diversity, households, life expectancy, housing, crime, benefits, land use, deprivation, and employment. Indicators included here are population by age and sex, land area, projections, population density, household composition, religion, ethnicity, birth rates (general fertility rate), death rates (standardised mortality ratio), life expectancy, average house prices, properties sold, housing by council tax band, tenure, property size (bedrooms), dwelling build period and type, mortgage and landlord home repossession, employment and economic activity, Incapacity Benefit, Housing Benefit, Household income, Income Support and JobSeekers Allowance claimant rates, dependent children receiving child-tax credits by lone parents and out-of-work families, child poverty, National Insurance Number registration rates for overseas nationals (NINo), GCSE results, A-level / Level 3 results (average point scores), pupil absence, child obesity, crime rates (by type of crime), fires, ambulance call outs, road casualties, happiness and well-being, land use, public transport accessibility (PTALs), access to public greenspace, access to nature, air emissions / quality, car use, bicycle travel, Indices of Deprivation, and election turnout. The Ward Profiles present key summary measures for the most recent year, using both Excel and InstantAtlas mapping software. This is a useful tool for displaying a large amount of data for numerous geographies, in one place. The Ward Atlas presents a more detailed version of the data including trend data and generally includes the raw numbers as opposed to percentages or rates. The Instant Atlas reports use HTML5 technology, which can be used in modern browsers, including on Apple machines, but will not function on older browsers. WARD ATLAS FOR 2014 BOUNDARIES In May 2014, ward boundaries changed in Hackney, Kensington and Chelsea, and Tower Hamlets. This version of the ward atlas gives data for these new wards, as well as retaining data on the unchanged wards in the rest of London for comparison purposes. Data for boroughs has also been included. Very few datasets have been published for the new ward boundaries, so the majority of data contained in this atlas have been modelled using a method of proportion of households from the old boundaries that are located in the new boundaries. Therefore, the data contained in this atlas are indicative only. OTHER SMALL AREA PROFILES Other profiles available include Borough, LSOA and MSOA atlases. Data from these profiles were used to create the Well-being scores tool. *The London boroughs are: City of London, Barking and Dagenham, Barnet, Bexley, Brent, Bromley, Camden, Croydon, Ealing, Enfield, Greenwich, Hackney, Hammersmith and Fulham, Haringey, Harrow, Havering, Hillingdon, Hounslow, Islington, Kensington and Chelsea, Kingston upon Thames, Lambeth, Lewisham, Merton, Newham, Redbridge, Richmond upon Thames, Southwark, Sutton, Tower Hamlets, Waltham Forest, Wandsworth, Westminster. These profiles were created using the most up to date information available at the time of collection (September 2015).
- e
Borough Council Election Results 2014
- data.europa.eu
excel xls, pdfUpdated Dec 1, 2014+ more versionsShareFacebookTwitterEmailClick to copy linkLink copiedCiteGreater London Authority (2014). Borough Council Election Results 2014 [Dataset]. https://data.europa.eu/data/datasets/borough-council-election-results-2014excel xls, pdfAvailable download formatsDataset updatedDec 1, 2014Dataset authored and provided byGreater London AuthorityDescription
This report includes a great deal of detail on every aspect of the 2014 London Borough council general elections. No other single volume presents the full results and election statistics from the 32 London boroughs enabling the reader to analyse and compare the results across London in one place. The report presents data for every candidate in every ward (excluding the City of London which operates on a different electoral model). The report also contains analysis of the European election results for London that took place on the same day.
Printed Copies We are able to accept orders for hard copies £30. Click here for further details.
Details of all previous elections reports in the series can be found here.
Summary results of the 2014 local elections in London, showing number and percentage of seats won, turnout and political control.
Final 2014 ward results
These results show the number of votes for each candidate in each ward in London. Turnout, number of ballots, postal votes, and breakdown of rejected votes, Mayoral and European voting figures are also included where available.
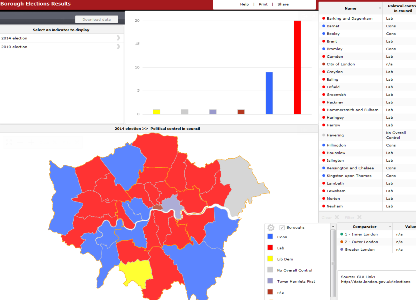
Map showing political control in each ward.
https://londondatastore-upload.s3.amazonaws.com/images/London-ward-map-borough-election-2014-new-colours-small.png" alt="">
Also, using these ward results, Oliver O'Brien from CASA has created some eye catching interactive ward maps.
The borough map shows the summary results in both the 2010 and 2014 elections.
The ward interactive map shows the detailed results for each candidate at ward level for the last three elections between 2006 and 2014.

This motion chart shows the relationship, between share of votes and seats won by the major parties in elections since 1964 at borough level (requires Adobe Flash Player).
 )
) - e
Borough Council Election Results 2018
- data.europa.eu
- gimi9.com
unknownUpdated Mar 14, 2011+ more versionsShareFacebookTwitterEmailClick to copy linkLink copiedCite(2011). Borough Council Election Results 2018 [Dataset]. https://data.europa.eu/data/datasets/vdjz5?locale=nounknownAvailable download formatsDataset updatedMar 14, 2011DescriptionWith the aim of making the democratic process as transparent as possible to the London electorate, this report includes a great deal of detail on every aspect of the 2018 London Borough council elections. No other single volume presents the full results and election statistics from the 32 London boroughs enabling the reader to analyse and compare the results across London in one place.
The report presents data for every candidate in every ward (excluding the City of London which operates on a different electoral model). Summaries are provided in the form of maps and tables, and to make comparisons easier, they mostly match those included in the 2014 report. Results of all council by-elections between the general elections in 2014 and 2018, as well as details of the elections in the four boroughs that directly elect a mayor, are also presented here. A commentary of the results, written by Professor Tony Travers of the London School of Economics, has been included to give readers an overview of the trends seen in these elections.
This is the latest report in a long series of council election reports dating back to 1964, all of which are currently available on the London Datastore at: http://data.london.gov.uk/elections
- o
Data from: A congratulatory poem on the Right Honourable Sir Patience Ward,...
- llds.ling-phil.ox.ac.uk
Updated Apr 4, 2024ShareFacebookTwitterEmailClick to copy linkLink copiedCiteW. W. (2024). A congratulatory poem on the Right Honourable Sir Patience Ward, Knight and Baronet, Lord Mayor of the city of London [Dataset]. https://llds.ling-phil.ox.ac.uk/llds/xmlui/handle/20.500.14106/A65495Dataset updatedApr 4, 2024AuthorsW. W.LicenseCC0 1.0 Universal Public Domain Dedicationhttps://creativecommons.org/publicdomain/zero/1.0/
License information was derived automaticallyArea coveredCity of LondonDescription(:unav)...........................................
- o
By the mayor, to the alderman of the ward of [blank] whereas the frequenting...
- llds.ling-phil.ox.ac.uk
Updated Sep 13, 2022ShareFacebookTwitterEmailClick to copy linkLink copiedCiteCity of London (England). Lord Mayor.; Thomas Pilkington (2022). By the mayor, to the alderman of the ward of [blank] whereas the frequenting and tipling in taverns, alehouses, coffee-houses and other victualling-houses is too much used and practiced within this city on the Lord's-day ... [Dataset]. https://llds.ling-phil.ox.ac.uk/llds/xmlui/handle/20.500.14106/B26170Dataset updatedSep 13, 2022AuthorsCity of London (England). Lord Mayor.; Thomas PilkingtonLicenseCC0 1.0 Universal Public Domain Dedicationhttps://creativecommons.org/publicdomain/zero/1.0/
License information was derived automaticallyDescription(:unav)...........................................
Borough Council Election Results 2022 - Dataset - data.gov.uk
- ckan.publishing.service.gov.uk
Updated Jun 21, 2023+ more versionsShareFacebookTwitterEmailClick to copy linkLink copiedCiteckan.publishing.service.gov.uk (2023). Borough Council Election Results 2022 - Dataset - data.gov.uk [Dataset]. https://ckan.publishing.service.gov.uk/dataset/borough-council-election-results-2022Dataset updatedJun 21, 2023DescriptionWith the aim of making the democratic process as transparent as possible to the London electorate, this report includes a great deal of detail on every aspect of the 2022 London Borough council elections. No other single volume presents the full results and election statistics from the 32 London boroughs enabling the reader to analyse and compare the results across London in one place. The report presents data for every candidate in every ward (excluding the City of London which operates on a different electoral model). Summaries are provided in the form of maps and tables, and to make comparisons easier, they mostly match those included in the 2018 report. A commentary of the results, written by Professor Tony Travers of the London School of Economics, has been included to give readers an overview of the trends seen in these elections. This is the latest report in a long series of council election reports dating back to 1964, all of which are currently available on the London Datastore at: http://data.london.gov.uk/elections

Not seeing a result you expected?
Learn how you can add new datasets to our index.
FacebookTwitterThis displays votes for the City of London, Ontario 2010 municipal election. There are columns for candidate, number of votes and percentage of votes.