- u
Hidden Room Educational Data Mining Analysis
- produccioncientifica.uca.es
- figshare.com
Updated 2016 Share
Share Facebook
 Twitter
 EmailClick to copy linkLink copiedCitePalomo-Duarte, Manuel; Berns, Anke; Palomo-Duarte, Manuel; Berns, Anke (2016). Hidden Room Educational Data Mining Analysis [Dataset]. https://produccioncientifica.uca.es/documentos/668fc475b9e7c03b01bde1d4Dataset updated2016AuthorsPalomo-Duarte, Manuel; Berns, Anke; Palomo-Duarte, Manuel; Berns, AnkeDescription
Histograms and results of k-means and Ward's clustering for Hidden Room game
The fileset contains information from three sources:
1. Histograms files:
* Lexical_histogram.png (histogram of lexical error ratios)
* Grammatical_histogram.png (histogram of grammatical error ratios)
2. K-means clustering files:
* elbow-lex kmeans.png (clustering by lexical aspects: error curves obtained for applying elbow method to determinate the optimal number of clusters)
* cube-lex kmeans.png (clustering by lexical aspects: a three-dimensional representation of clusters obtained after applying k-means method)
* Lexical_clusters (table) kmeans.xls (clustering by lexical aspects: centroids, standard deviations and number of instances assigned to each cluster)
* elbow-gram kmeans.png (clustering by grammatical aspects: error curves obtained for applying elbow method to determinate the optimal number of clusters)
* cube-gramm kmeans.png (clustering by grammatical aspects: a three-dimensional representation of clusters obtained after applying k-means method)
* Grammatical_clusters (table) kmeans.xls (clustering by grammatical aspects: centroids, standard deviations and number of instances assigned to each cluster)
* elbow-lexgram kmeans.png (clustering by lexical and grammatical aspects: error curves obtained for applying elbow method to determinate the optimal number of clusters)
* Lexical_Grammatical_clusters (table) kmeans.xls (clustering by lexical and grammatical aspects: centroids, standard deviations and number of instances assigned to each cluster)
* Grammatical_clusters_number_of_words (table) kmeans.xls : number of words (from column 2 to 4) and sizes (last column) obtained per each cluster by applying k-means clustering to grammatical error ratios.
* Lexical_clusters_number_of_words (table) kmeans.xls : number of words (from column 2 to 4) and sizes (last column) obtained per each cluster by applying k-means clustering to lexical error ratios.
* Lexical_Grammatical_clusters_number_of_words (table) kmeans.xls : number of words (from column 2 to 4) and sizes (last column) obtained per each cluster by applying k-means clustering to lexical and grammatical error ratios.
3. Ward’s Agglomerative Hierarchical Clustering files:
* Lexical_Cluster_Dendrogram_ward.png (clustering by lexical aspects: dendrogram obtained after applying Ward's clustering method).
* Grammatical_Cluster_Dendrogram_ward.png (clustering by grammatical aspects: dendrogram obtained after applying Ward's clustering method)
* Lexical_Grammatical_Cluster_Dendrogram_ward.png (clustering by lexical and grammatical aspects: dendrogram obtained after applying Ward's clustering method)
* Lexical_Grammatical_clusters (table) ward.xls: Centroids (from column 2 to 7) and cluster sizes (last column) obtained by applying Ward's agglomerative hierarchical clustering to lexical and grammatical error ratios.
* Grammatical_clusters (table) ward.xls: Centroids (from column 2 to 4) and cluster sizes (last column) obtained by applying Ward's agglomerative hierarchical clustering to grammatical error ratios.
* Lexical_clusters (table) ward.xls: Centroids (from column 2 to 4) and cluster sizes (last column) obtained by applying Ward's agglomerative hierarchical clustering to lexical error ratios.
* Lexical_clusters_number_of_words (table) ward.xls: number of words (from column 2 to 4) and sizes (last column) obtained per each cluster by applying Ward's agglomerative hierarchical clustering to lexical error ratios.
* Grammatical_clusters_number_of_words (table) ward.xls: number of words (from column 2 to 4) and sizes (last column) obtained per each cluster by applying Ward's agglomerative hierarchical clustering to grammatical error ratios.
* Lexical_Grammatical_clusters_number_of_words (table) ward.xls: number of words (from column 2 to 4) and sizes (last column) obtained per each cluster by applying Ward's agglomerative hierarchical clustering to lexical and grammatical error ratios. - m
Educational Attainment in North Carolina Public Schools: Use of statistical...
- data.mendeley.com
Updated Nov 14, 2018ShareFacebookTwitterEmailClick to copy linkLink copiedCiteScott Herford (2018). Educational Attainment in North Carolina Public Schools: Use of statistical modeling, data mining techniques, and machine learning algorithms to explore 2014-2017 North Carolina Public School datasets. [Dataset]. http://doi.org/10.17632/6cm9wyd5g5.1Unique identifierhttps://doi.org/10.17632/6cm9wyd5g5.1Dataset updatedNov 14, 2018AuthorsScott HerfordLicenseAttribution 4.0 (CC BY 4.0)https://creativecommons.org/licenses/by/4.0/
License information was derived automaticallyArea coveredNorth CarolinaDescriptionThe purpose of data mining analysis is always to find patterns of the data using certain kind of techiques such as classification or regression. It is not always feasible to apply classification algorithms directly to dataset. Before doing any work on the data, the data has to be pre-processed and this process normally involves feature selection and dimensionality reduction. We tried to use clustering as a way to reduce the dimension of the data and create new features. Based on our project, after using clustering prior to classification, the performance has not improved much. The reason why it has not improved could be the features we selected to perform clustering are not well suited for it. Because of the nature of the data, classification tasks are going to provide more information to work with in terms of improving knowledge and overall performance metrics. From the dimensionality reduction perspective: It is different from Principle Component Analysis which guarantees finding the best linear transformation that reduces the number of dimensions with a minimum loss of information. Using clusters as a technique of reducing the data dimension will lose a lot of information since clustering techniques are based a metric of 'distance'. At high dimensions euclidean distance loses pretty much all meaning. Therefore using clustering as a "Reducing" dimensionality by mapping data points to cluster numbers is not always good since you may lose almost all the information. From the creating new features perspective: Clustering analysis creates labels based on the patterns of the data, it brings uncertainties into the data. By using clustering prior to classification, the decision on the number of clusters will highly affect the performance of the clustering, then affect the performance of classification. If the part of features we use clustering techniques on is very suited for it, it might increase the overall performance on classification. For example, if the features we use k-means on are numerical and the dimension is small, the overall classification performance may be better. We did not lock in the clustering outputs using a random_state in the effort to see if they were stable. Our assumption was that if the results vary highly from run to run which they definitely did, maybe the data just does not cluster well with the methods selected at all. Basically, the ramification we saw was that our results are not much better than random when applying clustering to the data preprocessing. Finally, it is important to ensure a feedback loop is in place to continuously collect the same data in the same format from which the models were created. This feedback loop can be used to measure the model real world effectiveness and also to continue to revise the models from time to time as things change.
Hidden Room game in University of Cadiz data clustering by DeutschUCA
- figshare.com
pngUpdated Apr 30, 2018+ more versionsShareFacebookTwitterEmailClick to copy linkLink copiedCiteManuel Palomo-duarte; Anke Berns (2018). Hidden Room game in University of Cadiz data clustering by DeutschUCA [Dataset]. http://doi.org/10.6084/m9.figshare.6194597.v1pngAvailable download formatsUnique identifierhttps://doi.org/10.6084/m9.figshare.6194597.v1Dataset updatedApr 30, 2018AuthorsManuel Palomo-duarte; Anke BernsLicenseAttribution 4.0 (CC BY 4.0)https://creativecommons.org/licenses/by/4.0/
License information was derived automaticallyArea coveredCádizDescription- Histograms and results of k-means and Ward's clustering for Hidden Room game (Open Simulator) in University of Cadiz (Spain) by DeutschUCAThe fileset contains information from three sources:1. Histograms files:* Lexical_histogram.png (histogram of lexical error ratios)* Grammatical_histogram.png (histogram of grammatical error ratios)2. K-means clustering files:*
- elbow-lex kmeans.png (clustering by lexical aspects: error curves
- obtained for applying elbow method to determinate the optimal number of
- clusters)* cube-lex kmeans.png (clustering by lexical aspects: a
- three-dimensional representation of clusters obtained after applying
- k-means method)* Lexical_clusters (table) kmeans.xls (clustering by
- lexical aspects: centroids, standard deviations and number of instances
- assigned to each cluster)* elbow-gram kmeans.png (clustering by
- grammatical aspects: error curves obtained for applying elbow method to
- determinate the optimal number of clusters)* cube-gramm kmeans.png
- (clustering by grammatical aspects: a three-dimensional representation
- of clusters obtained after applying k-means method)*
- Grammatical_clusters (table) kmeans.xls (clustering by grammatical
- aspects: centroids, standard deviations and number of instances assigned
- to each cluster)* elbow-lexgram kmeans.png (clustering by lexical
- and grammatical aspects: error curves obtained for applying elbow method
- to determinate the optimal number of clusters)*
- Lexical_Grammatical_clusters (table) kmeans.xls (clustering by lexical
- and grammatical aspects: centroids, standard deviations and number of
- instances assigned to each cluster)*
- Grammatical_clusters_number_of_words (table) kmeans.xls
- number of words (from column 2 to 4) and sizes (last column) obtained per each cluster by applying k-means clustering to grammatical error ratios.* Lexical_clusters_number_of_words (table) kmeans.xls
- number of words (from column 2 to 4) and sizes (last column) obtained per each cluster by applying k-means clustering to lexical error ratios.* Lexical_Grammatical_clusters_number_of_words (table) kmeans.xls
- number of words (from column 2 to 4) and sizes (last column) obtained
per each cluster by applying k-means clustering to lexical and
grammatical error ratios.3. Ward’s Agglomerative Hierarchical Clustering files:*
Lexical_Cluster_Dendrogram_ward.png (clustering by lexical aspects:
dendrogram obtained after applying Ward's clustering method).*
Grammatical_Cluster_Dendrogram_ward.png (clustering by grammatical
aspects: dendrogram obtained after applying Ward's clustering method)*
Lexical_Grammatical_Cluster_Dendrogram_ward.png (clustering by lexical
and grammatical aspects: dendrogram obtained after applying Ward's
clustering method)* Lexical_Grammatical_clusters (table) ward.xls:
Centroids (from column 2 to 7) and cluster sizes (last column) obtained by applying Ward's agglomerative hierarchical clustering to lexical and grammatical error ratios.* Grammatical_clusters (table) ward.xls: Centroids (from column 2 to 4) and cluster sizes (last column) obtained by applying Ward's agglomerative hierarchical clustering to grammatical error ratios.* Lexical_clusters (table) ward.xls: Centroids (from column 2 to 4) and cluster sizes (last column) obtained by applying Ward's agglomerative hierarchical clustering to lexical error ratios.* Lexical_clusters_number_of_words (table) ward.xls: number of words (from column 2 to 4) and sizes (last column) obtained per each cluster by applying Ward's agglomerative hierarchical clustering to lexical error ratios.* Grammatical_clusters_number_of_words (table) ward.xls: number of words (from column 2 to 4) and sizes (last column) obtained per each cluster by applying Ward's agglomerative hierarchical clustering to grammatical error ratios.* Lexical_Grammatical_clusters_number_of_words (table) ward.xls: number of words (from column 2 to 4) and sizes (last column) obtained per each cluster by applying Ward's agglomerative hierarchical clustering to lexical and grammatical error ratios.
- u
Data from: IJEE Educational Data Mining
- produccioncientifica.uca.es
Updated 2016+ more versionsShareFacebookTwitterEmailClick to copy linkLink copiedCitePalomo-Duarte, Manuel; Palomo-Duarte, Manuel (2016). IJEE Educational Data Mining [Dataset]. https://produccioncientifica.uca.es/documentos/668fc475b9e7c03b01bde195Dataset updated2016AuthorsPalomo-Duarte, Manuel; Palomo-Duarte, ManuelDescriptionHistograms and results of k-means and Ward's clustering for IJEE special issue
The fileset contains information from three sources:
1. Histograms (two files):
* Lexical_histogram.png (histogram of lexical error ratios)
* Grammatical_histogram.png (histogram of grammatical error ratios)
2. K-means clustering (eight files):
* elbow-lex.png (clustering by lexical aspects: error curves obtained for applying elbow method to determinate the optimal number of clusters)
* cube-lex.png (clustering by lexical aspects: a three-dimensional representation of clusters obtained after applying k-means method)
* Lexical_clusters (table).xls (clustering by lexical aspects: centroids, standard deviations and number of instances assigned to each cluster)
* elbow-gram.png (clustering by grammatical aspects: error curves obtained for applying elbow method to determinate the optimal number of clusters)
* cube-gramm.png (clustering by grammatical aspects: a three-dimensional representation of clusters obtained after applying k-means method)
* Grammatical_clusters (table).xls (clustering by grammatical aspects: centroids, standard deviations and number of instances assigned to each cluster)
* elbow-lexgram.png (clustering by lexical and grammatical aspects: error curves obtained for applying elbow method to determinate the optimal number of clusters)
* Lexical_Grammatical_clusters (table).xls (clustering by lexical and grammatical aspects: centroids, standard deviations and number of instances assigned to each cluster)
* Grammatical_clusters_number_of_words (table) kmeans.xls : number of words (from column 2 to 4) and sizes (last column) obtained per each cluster by applying k-means clustering to grammatical error ratios.
* Lexical_clusters_number_of_words (table) kmeans.xls : number of words (from column 2 to 4) and sizes (last column) obtained per each cluster by applying k-means clustering to lexical error ratios.
* Lexical_Grammatical_clusters_number_of_words (table) kmeans.xls : number of words (from column 2 to 4) and sizes (last column) obtained per each cluster by applying k-means clustering to lexical and grammatical error ratios.
3. Ward’s Agglomerative Hierarchical Clustering (three files):
* Lexical_Cluster_Dendrogram_ward.png (clustering by lexical aspects: dendrogram obtained after applying Ward's clustering method).
* Grammatical_Cluster_Dendrogram_ward.png (clustering by grammatical aspects: dendrogram obtained after applying Ward's clustering method)
* Lexical_Grammatical_Cluster_Dendrogram_ward.png (clustering by lexical and grammatical aspects: dendrogram obtained after applying Ward's clustering method)
* Lexical_Grammatical_clusters (table).xls: Centroids (from column 2 to 7) and cluster sizes (last column) obtained by applying Ward's agglomerative hierarchical clustering to lexical and grammatical error ratios.
* Grammatical_clusters (table).xls: Centroids (from column 2 to 4) and cluster sizes (last column) obtained by applying Ward's agglomerative hierarchical clustering to grammatical error ratios.
* Lexical_clusters (table).xls: Centroids (from column 2 to 4) and cluster sizes (last column) obtained by applying Ward's agglomerative hierarchical clustering to lexical error ratios.
* Lexical_clusters_number_of_words (table) ward.xls: number of words (from column 2 to 4) and sizes (last column) obtained per each cluster by applying Ward's agglomerative hierarchical clustering to lexical error ratios.
* Grammatical_clusters_number_of_words (table) ward.xls: number of words (from column 2 to 4) and sizes (last column) obtained per each cluster by applying Ward's agglomerative hierarchical clustering to grammatical error ratios.
* Lexical_Grammatical_clusters_number_of_words (table) ward.xls: number of words (from column 2 to 4) and sizes (last column) obtained per each cluster by applying Ward's agglomerative hierarchical clustering to lexical and grammatical error ratios. - Z
Data from: Cluster analysis successfully identifies clinically meaningful...
- data.niaid.nih.gov
- datadryad.org
- +1more
Updated Jun 1, 2022ShareFacebookTwitterEmailClick to copy linkLink copiedCiteBriem, Kristín (2022). Data from: Cluster analysis successfully identifies clinically meaningful knee valgus moment patterns: frequency of early peaks reflects sex-specific ACL injury incidence [Dataset]. https://data.niaid.nih.gov/resources?id=zenodo_4993859Dataset updatedJun 1, 2022Dataset provided bySigurðsson, Haraldur B
Briem, KristínLicenseCC0 1.0 Universal Public Domain Dedicationhttps://creativecommons.org/publicdomain/zero/1.0/
License information was derived automaticallyDescriptionBackground: Biomechanical studies of ACL injury risk factors frequently analyze only a fraction of the relevant data, and typically not in accordance with the injury mechanism. Extracting a peak value within a time series of relevance to ACL injuries is challenging due to differences in the relative timing and size of the peak value of interest.
Aims/hypotheses: The aim was to cluster analyze the knee valgus moment time series curve shape in the early stance phase. We hypothesized that 1a) There would be few discrete curve shapes, 1b) there would be a shape reflecting an early peak of the knee valgus moment, 2a) youth athletes of both sexes would show similar frequencies of early peaks, 2b) adolescent girls would have greater early peak frequencies.
Methods: N = 213 (39% boys) youth soccer and team handball athletes (phase 1) and N = 35 (45% boys) with 5 year follow-up data (phase 2) were recorded performing a change of direction task with 3D motion analysis and a force plate. The time series of the first 30% of stance phase were cluster analyzed based on Euclidean distances in two steps; shape-based main clusters with a transformed time series, and magnitude based sub-clusters with body weight normalized time series. Group differences (sex, phase) in curve shape frequencies, and shape-magnitude frequencies were tested with chi-squared tests.
Results: Six discrete shape-clusters and 14 magnitude based sub-clusters were formed. Phase 1 boys had greater frequency of early peaks than phase 1 girls (38% vs 25% respectively, P < 0.001 for full test). Phase 2 girls had greater frequency of early peaks than phase 2 boys (42% vs 21% respectively, P < 0.001 for full test).
Conclusions: Cluster analysis can reveal different patterns of curve shapes in biomechanical data, which likely reflect different movement strategies. The early peak shape is relatable to the ACL injury mechanism as the timing of its peak moment is consistent with the timing of injury. Greater frequency of early peaks demonstrated by Phase 2 girls is consistent with their higher risk of ACL injury in sports.
- f
Notations and descriptions.
- plos.figshare.com
xlsUpdated Jun 11, 2023+ more versionsShareFacebookTwitterEmailClick to copy linkLink copiedCiteYaling Zhang; Jin Han (2023). Notations and descriptions. [Dataset]. http://doi.org/10.1371/journal.pone.0248737.t001xlsAvailable download formatsUnique identifierhttps://doi.org/10.1371/journal.pone.0248737.t001Dataset updatedJun 11, 2023Dataset provided byPLOS ONEAuthorsYaling Zhang; Jin HanLicenseAttribution 4.0 (CC BY 4.0)https://creativecommons.org/licenses/by/4.0/
License information was derived automaticallyDescriptionNotations and descriptions.
- f
Data_Sheet_2_Qluster: An easy-to-implement generic workflow for robust...
- figshare.com
docxUpdated May 31, 2023+ more versionsShareFacebookTwitterEmailClick to copy linkLink copiedCiteCyril Esnault; Melissa Rollot; Pauline Guilmin; Jean-Daniel Zucker (2023). Data_Sheet_2_Qluster: An easy-to-implement generic workflow for robust clustering of health data.docx [Dataset]. http://doi.org/10.3389/frai.2022.1055294.s002docxAvailable download formatsUnique identifierhttps://doi.org/10.3389/frai.2022.1055294.s002Dataset updatedMay 31, 2023Dataset provided byFrontiersAuthorsCyril Esnault; Melissa Rollot; Pauline Guilmin; Jean-Daniel ZuckerLicenseAttribution 4.0 (CC BY 4.0)https://creativecommons.org/licenses/by/4.0/
License information was derived automaticallyDescriptionThe exploration of heath data by clustering algorithms allows to better describe the populations of interest by seeking the sub-profiles that compose it. This therefore reinforces medical knowledge, whether it is about a disease or a targeted population in real life. Nevertheless, contrary to the so-called conventional biostatistical methods where numerous guidelines exist, the standardization of data science approaches in clinical research remains a little discussed subject. This results in a significant variability in the execution of data science projects, whether in terms of algorithms used, reliability and credibility of the designed approach. Taking the path of parsimonious and judicious choice of both algorithms and implementations at each stage, this article proposes Qluster, a practical workflow for performing clustering tasks. Indeed, this workflow makes a compromise between (1) genericity of applications (e.g. usable on small or big data, on continuous, categorical or mixed variables, on database of high-dimensionality or not), (2) ease of implementation (need for few packages, few algorithms, few parameters, ...), and (3) robustness (e.g. use of proven algorithms and robust packages, evaluation of the stability of clusters, management of noise and multicollinearity). This workflow can be easily automated and/or routinely applied on a wide range of clustering projects. It can be useful both for data scientists with little experience in the field to make data clustering easier and more robust, and for more experienced data scientists who are looking for a straightforward and reliable solution to routinely perform preliminary data mining. A synthesis of the literature on data clustering as well as the scientific rationale supporting the proposed workflow is also provided. Finally, a detailed application of the workflow on a concrete use case is provided, along with a practical discussion for data scientists. An implementation on the Dataiku platform is available upon request to the authors.
- D
Data Analytics Consulting Service Report
- marketresearchforecast.com
doc, pdf, pptUpdated Mar 5, 2025ShareFacebookTwitterEmailClick to copy linkLink copiedCiteMarket Research Forecast (2025). Data Analytics Consulting Service Report [Dataset]. https://www.marketresearchforecast.com/reports/data-analytics-consulting-service-27535ppt, pdf, docAvailable download formatsDataset updatedMar 5, 2025Dataset authored and provided byMarket Research ForecastLicensehttps://www.marketresearchforecast.com/privacy-policyhttps://www.marketresearchforecast.com/privacy-policy
Time period covered2025 - 2033Area coveredGlobalVariables measuredMarket SizeDescriptionThe Data Analytics Consulting Services market is experiencing robust growth, driven by the increasing adoption of data-driven decision-making across various industries. The market, estimated at $50 billion in 2025, is projected to exhibit a Compound Annual Growth Rate (CAGR) of 15% from 2025 to 2033, reaching approximately $150 billion by 2033. This expansion is fueled by several key factors: the proliferation of big data, advancements in artificial intelligence (AI) and machine learning (ML) technologies, and the rising need for businesses to gain actionable insights from their data to improve operational efficiency, enhance customer experience, and drive innovation. Key segments driving growth include predictive data analysis, used extensively for forecasting and risk management, and data mining, crucial for uncovering hidden patterns and trends within vast datasets. Large enterprises are the primary consumers of these services, investing heavily in advanced analytics to gain a competitive edge, followed by a rapidly growing segment of SMEs seeking to leverage data analytics for streamlined operations and improved decision-making. Significant regional variations are expected. North America, particularly the United States, is anticipated to maintain a substantial market share due to the presence of established technology giants and a mature data analytics ecosystem. However, regions like Asia-Pacific, especially India and China, are demonstrating rapid growth due to increasing digitalization and a burgeoning demand for data-driven solutions. While the market faces challenges such as data security concerns, the scarcity of skilled data scientists, and the high cost of implementation, the overall growth trajectory remains positive, driven by the undeniable value proposition of data analytics for businesses of all sizes and across various sectors. Competitive landscape is highly fragmented, with a mix of global consulting firms (Accenture, Deloitte, McKinsey), specialized data analytics companies (DataArt, Analytics8), and regional players competing for market share.
- f
Iris data aggregation class effect.
- plos.figshare.com
xlsUpdated Jun 5, 2023ShareFacebookTwitterEmailClick to copy linkLink copiedCiteYaling Zhang; Jin Han (2023). Iris data aggregation class effect. [Dataset]. http://doi.org/10.1371/journal.pone.0248737.t003xlsAvailable download formatsUnique identifierhttps://doi.org/10.1371/journal.pone.0248737.t003Dataset updatedJun 5, 2023Dataset provided byPLOS ONEAuthorsYaling Zhang; Jin HanLicenseAttribution 4.0 (CC BY 4.0)https://creativecommons.org/licenses/by/4.0/
License information was derived automaticallyDescriptionIris data aggregation class effect.
Data from: DATA MINING THE GALAXY ZOO MERGERS
- data.nasa.gov
- data.staging.idas-ds1.appdat.jsc.nasa.gov
- +2more
application/rdfxml +5Updated Jun 26, 2018ShareFacebookTwitterEmailClick to copy linkLink copiedCite(2018). DATA MINING THE GALAXY ZOO MERGERS [Dataset]. https://data.nasa.gov/dataset/DATA-MINING-THE-GALAXY-ZOO-MERGERS/cs4h-8wdaxml, application/rdfxml, application/rssxml, tsv, json, csvAvailable download formatsDataset updatedJun 26, 2018LicenseU.S. Government Workshttps://www.usa.gov/government-works
License information was derived automaticallyDescriptionDATA MINING THE GALAXY ZOO MERGERS
STEVEN BAEHR*, ARUN VEDACHALAM*, KIRK BORNE*, AND DANIEL SPONSELLER*
Abstract. Collisions between pairs of galaxies usually end in the coalescence (merger) of the two galaxies. Collisions and mergers are rare phenomena, yet they may signal the ultimate fate of most galaxies, including our own Milky Way. With the onset of massive collection of astronomical data, a computerized and automated method will be necessary for identifying those colliding galaxies worthy of more detailed study. This project researches methods to accomplish that goal. Astronomical data from the Sloan Digital Sky Survey (SDSS) and human-provided classifications on merger status from the Galaxy Zoo project are combined and processed with machine learning algorithms. The goal is to determine indicators of merger status based solely on discovering those automated pipeline-generated attributes in the astronomical database that correlate most strongly with the patterns identified through visual inspection by the Galaxy Zoo volunteers. In the end, we aim to provide a new and improved automated procedure for classification of collisions and mergers in future petascale astronomical sky surveys. Both information gain analysis (via the C4.5 decision tree algorithm) and cluster analysis (via the Davies-Bouldin Index) are explored as techniques for finding the strongest correlations between human-identified patterns and existing database attributes. Galaxy attributes measured in the SDSS green waveband images are found to represent the most influential of the attributes for correct classification of collisions and mergers. Only a nominal information gain is noted in this research, however, there is a clear indication of which attributes contribute so that a direction for further study is apparent.
- f
Main procedures of K-means.
- figshare.com
xlsUpdated Jun 2, 2023+ more versionsShareFacebookTwitterEmailClick to copy linkLink copiedCiteQiwei Wang; Xiaoya Zhu; Manman Wang; Fuli Zhou; Shuang Cheng (2023). Main procedures of K-means. [Dataset]. http://doi.org/10.1371/journal.pone.0286034.t002xlsAvailable download formatsUnique identifierhttps://doi.org/10.1371/journal.pone.0286034.t002Dataset updatedJun 2, 2023Dataset provided byPLOS ONEAuthorsQiwei Wang; Xiaoya Zhu; Manman Wang; Fuli Zhou; Shuang ChengLicenseAttribution 4.0 (CC BY 4.0)https://creativecommons.org/licenses/by/4.0/
License information was derived automaticallyDescriptionThe coronavirus disease 2019 pandemic has impacted and changed consumer behavior because of a prolonged quarantine and lockdown. This study proposed a theoretical framework to explore and define the influencing factors of online consumer purchasing behavior (OCPB) based on electronic word-of-mouth (e-WOM) data mining and analysis. Data pertaining to e-WOM were crawled from smartphone product reviews from the two most popular online shopping platforms in China, Jingdong.com and Taobao.com. Data processing aimed to filter noise and translate unstructured data from complex text reviews into structured data. The machine learning based K-means clustering method was utilized to cluster the influencing factors of OCPB. Comparing the clustering results and Kotler’s five products level, the influencing factors of OCPB were clustered around four categories: perceived emergency context, product, innovation, and function attributes. This study contributes to OCPB research by data mining and analysis that can adequately identify the influencing factors based on e-WOM. The definition and explanation of these categories may have important implications for both OCPB and e-commerce.
Inductive Monitoring System (IMS)
- data.nasa.gov
- data.staging.idas-ds1.appdat.jsc.nasa.gov
- +1more
application/rdfxml +5Updated Jun 26, 2018+ more versionsShareFacebookTwitterEmailClick to copy linkLink copiedCite(2018). Inductive Monitoring System (IMS) [Dataset]. https://data.nasa.gov/widgets/73ye-z68xcsv, xml, tsv, application/rssxml, application/rdfxml, jsonAvailable download formatsDataset updatedJun 26, 2018LicenseU.S. Government Workshttps://www.usa.gov/government-works
License information was derived automaticallyDescriptionIMS: Inductive Monitoring System
The Inductive Monitoring System (IMS) is a tool that uses a data mining technique called clustering to extract models of normal system operation from archived data. IMS works with vectors of data values. IMS analyzes data collected during periods of normal system operation to build a system model. It characterizes how the parameters relate to one another during normal operation by finding areas in the vector space where nominal data tends to fall. These areas are called nominal operating regions and correspond to clusters of similar points found by the IMS clustering algorithm. These nominal operating regions are stored in a knowledge base that IMS uses for real-time telemetry monitoring or archived data analysis.
During the monitoring operation, IMS reads real-time or archived data values, formats them into the predefined vector structure, and searches the knowledge base of nominal operating regions to see how well the new data fits the nominal system characterization. For each input vector, IMS returns the distance that vector falls from the nearest nominal operating region. Data that matches the normal training data well will have a deviation distance of zero. If one or more of the data parameters is slightly outside of expected values, a small non-zero result is returned. As incoming data deviates further from the normal system data, indicating a possible malfunction, IMS will return a higher deviation value to alert users of the anomaly. IMS also calculates the contribution of each individual parameter to the overall deviation, which can help isolate the cause of the anomaly.
- m
Global Data Analytics Consulting Service Market Size, Trends and Projections...
- marketresearchintellect.com
Updated Jan 31, 2024ShareFacebookTwitterEmailClick to copy linkLink copiedCiteMarket Research Intellect (2024). Global Data Analytics Consulting Service Market Size, Trends and Projections [Dataset]. https://www.marketresearchintellect.com/product/data-analytics-consulting-service-market/Dataset updatedJan 31, 2024Dataset authored and provided byMarket Research IntellectLicensehttps://www.marketresearchintellect.com/privacy-policyhttps://www.marketresearchintellect.com/privacy-policy
Area coveredGlobalDescriptionThe size and share of the market is categorized based on Type (Data Mining, Predictive Data Analysis, Cluster Analysis, Data Summary, Others) and Application (SMEs, Large Enterprises) and geographical regions (North America, Europe, Asia-Pacific, South America, and Middle-East and Africa).
- d
The Orange workflow for observing collocation clusters ColEmbed 1.0 -...
- b2find.dkrz.de
Updated May 8, 2021+ more versionsShareFacebookTwitterEmailClick to copy linkLink copiedCite(2021). The Orange workflow for observing collocation clusters ColEmbed 1.0 - Dataset - B2FIND [Dataset]. https://b2find.dkrz.de/dataset/78ffbb28-6863-512b-8d4d-5ee846b54c1fDataset updatedMay 8, 2021DescriptionColEmbed is a workflow (.OWS file) for Orange Data Mining (an open-source machine learning and data visualization software: https://orangedatamining.com/) that allows the user to observe clusters of collocation candidates extracted from corpora. The workflow consists of a series of data filters, embedding processors, and visualizers. As input, the workflow takes a tab-separated file (.TSV/.TAB) with data on collocations extracted from a corpus, along with their relative frequencies by year of publication and other optional values (such as information on temporal trends). The workflow allows the user to select the features which are then used in the workflow to cluster collocation candidates, along with the embeddings generated based on the selected lemmas (either one lemma or both lemmas can be selected, depending on our clustering criteria; for instance, if we wish to cluster adjective+noun candidates based on the similarities of their noun components, we only select the second lemma to be taken into account in embedding generation). The obtained embedding clusters can be visualized and further processed (e.g. by finding the closest neighbors of a reference collocation). The workflow is described in more detail in the accompanying README file. The entry also contains three .TAB files that can be used to test the workflow. The files contain collocation candidates (along with their relative frequencies per year of publication and four measures describing their temporal trends; see http://hdl.handle.net/11356/1424 for more details) extracted from the Gigafida 2.0 Corpus of Written Slovene (https://viri.cjvt.si/gigafida/) with three different syntactic structures (as defined in http://hdl.handle.net/11356/1415): 1) p0-s0 (adjective + noun, e.g. rezervni sklad), 2) s0-s2 (noun + noun in the genitive case, e.g. ukinitev lastnine), and 3) gg-s4 (verb + noun in the accusative case, e.g. pripraviti besedilo). It should be noted that only collocation candidates with absolute frequency of 15 and above were extracted. Please note that the ColEmbed workflow requires the installation of the Text Mining add-on for Orange. For installation instructions as well as a more detailed description of the different phases of the workflow and the measures used to observe the collocation trends, please consult the README file.
Data from: Regional E-Atlas of the Greater Phoenix Region: high-technology...
- search.dataone.org
- portal.edirepository.org
Updated Oct 30, 2013ShareFacebookTwitterEmailClick to copy linkLink copiedCiteTim Hogan (2013). Regional E-Atlas of the Greater Phoenix Region: high-technology employment clusters, 2000. [Dataset]. https://search.dataone.org/view/knb-lter-cap.112.9Dataset updatedOct 30, 2013AuthorsTim HoganTime period coveredJan 1, 2000Area coveredDescriptionThese data represent high-technology employment clusters across central Arizona-Phoenix. These data are presented by industry: aerospace, bio-industry, information, software for the year 2000.
- z
Data from: Zero-shot Bilingual App Reviews Mining with Large Language Models...
- zenodo.org
- data.niaid.nih.gov
zipUpdated May 23, 2024ShareFacebookTwitterEmailClick to copy linkLink copiedCiteJialiang Wei; Anne-Lise Courbis; Thomas Lambolais; Binbin Xu; Pierre Louis Bernard; Gérard Dray; Jialiang Wei; Anne-Lise Courbis; Thomas Lambolais; Binbin Xu; Pierre Louis Bernard; Gérard Dray (2024). Zero-shot Bilingual App Reviews Mining with Large Language Models [Dataset]. http://doi.org/10.1109/ictai59109.2023.00135zipAvailable download formatsUnique identifierhttps://doi.org/10.1109/ictai59109.2023.00135Dataset updatedMay 23, 2024Dataset provided byIEEEAuthorsJialiang Wei; Anne-Lise Courbis; Thomas Lambolais; Binbin Xu; Pierre Louis Bernard; Gérard Dray; Jialiang Wei; Anne-Lise Courbis; Thomas Lambolais; Binbin Xu; Pierre Louis Bernard; Gérard DrayLicenseMIT Licensehttps://opensource.org/licenses/MIT
License information was derived automaticallyDescriptionClassification
6000 English and 6000 French user reviews from three applications on Google Play (Garmin Connect, Huawei Health, Samsung Health) are labelled manually. We employed three labels: problem report, feature request, and irrelevant.
- Problem reports show the issues the users have experienced while using the app.
- Feature requests reflect the demande of users on new function, new content, new interface, etc.
- Irrelevant are the user reviews that do not belongs to the two aforementioned categories.
As we can observe from the following table, that shows examples of labelled user reviews, each review belongs to one or more categories.
App Language Total Feature request Problem report Irrelevant Garmin Connect en 2000 223 579 1231 Garmin Connect fr 2000 217 772 1051 Huawei Health en 2000 415 876 764 Huawei Health fr 2000 387 842 817 Samsung Health en 2000 528 500 990 Samsung Health fr 2000 496 492 1047 Clustering
1200 bilingual labeled user reviews for clustering evaluation. From each of the three applications and for each of the two languages present in the classification dataset, we randomly selected 100 problem reports and 100 feature requests. Subsequently, we conducted manual clustering on each collection of 200 bilingual reviews, all of which pertained to the same category.
Garmin Connect Huawei Health Samsung Health #clusters in feature request 89 74 69 #clusters(𝑠𝑖𝑧𝑒≥5) in feature request 7 9 11 #clusters in problem report 45 44 41 #clusters(𝑠𝑖𝑧𝑒≥5) in problem report 10 13 12 - u
Association analysis of high-high cluster road intersection crashes...
- zivahub.uct.ac.za
xlsxUpdated Jun 7, 2024+ more versionsShareFacebookTwitterEmailClick to copy linkLink copiedCiteSimone Vieira; Simon Hull; Roger Behrens (2024). Association analysis of high-high cluster road intersection crashes involving public transport within the CoCT in 2017, 2018, 2019 and 2021 [Dataset]. http://doi.org/10.25375/uct.25975972.v1xlsxAvailable download formatsUnique identifierhttps://doi.org/10.25375/uct.25975972.v1Dataset updatedJun 7, 2024Dataset provided byUniversity of Cape TownAuthorsSimone Vieira; Simon Hull; Roger BehrensLicenseAttribution 4.0 (CC BY 4.0)https://creativecommons.org/licenses/by/4.0/
License information was derived automaticallyArea coveredCity of Cape TownDescriptionThis dataset provides comprehensive information on road intersection crashes involving public transport (Bus, Bus-train, Combi/minibusses, midibusses) recognised as "high-high" clusters within the City of Cape Town. It includes detailed records of all intersection crashes and their corresponding crash attribute combinations, which were prevalent in at least 10% of the total "high-high" cluster public transport road intersection crashes for the years 2017, 2018, 2019, and 2021.The dataset is meticulously organised according to support metric values, ranging from 0,10 to 0,171, with entries presented in descending order.Data SpecificsData Type: Geospatial-temporal categorical dataFile Format: Excel document (.xlsx)Size: 160 KBNumber of Files: The dataset contains a total of 1620 association rulesDate Created: 23rd May 2024MethodologyData Collection Method: The descriptive road traffic crash data per crash victim involved in the crashes was obtained from the City of Cape Town Network InformationSoftware: ArcGIS Pro, PythonProcessing Steps: Following the spatio-temporal analyses and the derivation of "high-high" cluster fishnet grid cells from a cluster and outlier analysis, all the road intersection crashes involving public transport that occurred within the "high-high" cluster fishnet grid cells were extracted to be processed by association analysis. The association analysis of these crashes was processed using Python software and involved the use of a 0,10 support metric value. Consequently, commonly occurring crash attributes among at least 10% of the "high-high" cluster road intersection public transport crashes were extracted for inclusion in this dataset.Geospatial InformationSpatial Coverage:West Bounding Coordinate: 18°20'EEast Bounding Coordinate: 19°05'ENorth Bounding Coordinate: 33°25'SSouth Bounding Coordinate: 34°25'SCoordinate System: South African Reference System (Lo19) using the Universal Transverse Mercator projectionTemporal InformationTemporal Coverage:Start Date: 01/01/2017End Date: 31/12/2021 (2020 data omitted)
- N
An investigation of the structural, connectional, and functional...
- neurovault.org
niftiUpdated Jun 30, 2018+ more versionsShareFacebookTwitterEmailClick to copy linkLink copiedCite(2018). An investigation of the structural, connectional, and functional subspecialization in the human amygdala: Figure 3 - Left Amygdala (cluster #3) [Dataset]. http://identifiers.org/neurovault.image:12012niftiAvailable download formatsUnique identifierhttps://identifiers.org/neurovault.image:12012Dataset updatedJun 30, 2018LicenseCC0 1.0 Universal Public Domain Dedicationhttps://creativecommons.org/publicdomain/zero/1.0/
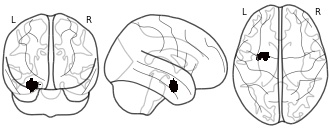
License information was derived automaticallyDescriptionConnectivity-based parcellation (CBP) of the left human amygdala. Cluster #3 (blue) - laterobasal nuclei group
Collection description
We here employed methods for large-scale data mining to perform a connectivity-derived parcellation of the human amygdala based on whole-brain coactivation patterns computed for each seed voxel. Using this approach, connectivity-based parcellation divided the amygdala into three distinct clusters that are highly consistent with earlier microstructural distinctions. Meta-analytic connectivity modelling and functional characterization further revealed that the amygdala's laterobasal nuclei group was associated with coordinating high-level sensory input, whereas its centromedial nuclei group was linked to mediating attentional, vegetative, and motor responses. The results of this model-free approach support the concordance of structural, connectional, and functional organization in the human amygdala. This dataset was automatically imported from the ANIMA <http://anima.modelgui.org/> database. Version: 1
Subject species
homo sapiens
Modality
fMRI-BOLD
Analysis level
meta-analysis
Cognitive paradigm (task)
None / Other
Map type
M
- f
Confusion matrix.
- figshare.com
xlsUpdated Jul 7, 2023+ more versionsShareFacebookTwitterEmailClick to copy linkLink copiedCiteShaoxia Mou; Heming Zhang (2023). Confusion matrix. [Dataset]. http://doi.org/10.1371/journal.pone.0288140.t002xlsAvailable download formatsUnique identifierhttps://doi.org/10.1371/journal.pone.0288140.t002Dataset updatedJul 7, 2023Dataset provided byPLOS ONEAuthorsShaoxia Mou; Heming ZhangLicenseAttribution 4.0 (CC BY 4.0)https://creativecommons.org/licenses/by/4.0/
License information was derived automaticallyDescriptionDue to the inherent characteristics of accumulation sequence of unbalanced data, the mining results of this kind of data are often affected by a large number of categories, resulting in the decline of mining performance. To solve the above problems, the performance of data cumulative sequence mining is optimized. The algorithm for mining cumulative sequence of unbalanced data based on probability matrix decomposition is studied. The natural nearest neighbor of a few samples in the unbalanced data cumulative sequence is determined, and the few samples in the unbalanced data cumulative sequence are clustered according to the natural nearest neighbor relationship. In the same cluster, new samples are generated from the core points of dense regions and non core points of sparse regions, and then new samples are added to the original data accumulation sequence to balance the data accumulation sequence. The probability matrix decomposition method is used to generate two random number matrices with Gaussian distribution in the cumulative sequence of balanced data, and the linear combination of low dimensional eigenvectors is used to explain the preference of specific users for the data sequence; At the same time, from a global perspective, the AdaBoost idea is used to adaptively adjust the sample weight and optimize the probability matrix decomposition algorithm. Experimental results show that the algorithm can effectively generate new samples, improve the imbalance of data accumulation sequence, and obtain more accurate mining results. Optimizing global errors as well as more efficient single-sample errors. When the decomposition dimension is 5, the minimum RMSE is obtained. The proposed algorithm has good classification performance for the cumulative sequence of balanced data, and the average ranking of index F value, G mean and AUC is the best.
- d
Strategic Agricultural Lands (SAL) Equine Critical Industry Cluster
- data.gov.au
- researchdata.edu.au
- +3more
Updated Nov 19, 2019+ more versionsShareFacebookTwitterEmailClick to copy linkLink copiedCiteBioregional Assessment Program (2019). Strategic Agricultural Lands (SAL) Equine Critical Industry Cluster [Dataset]. https://data.gov.au/data/dataset/81056a9a-bdca-4e2a-8288-759ac4fbafffDataset updatedNov 19, 2019Dataset authored and provided byBioregional Assessment ProgramDescriptionAbstract
This dataset and its metadata statement were supplied to the Bioregional Assessment Programme by a third party and are presented here as originally supplied.
Important Note: 14/01/2015. Since we generated these spatial layer datasets, the NSW Department of Planning and Environment has published an interactive CSG Exclusion Zone map. Interested parties should go to http://www.planning.nsw.gov.au/en-au/planningyourregion/strategicregionallanduse/coalseamgasexclusionzones.aspx where they can find out more about CSG exclusion zones. The information in the Bioregional Assessment products aligns with the CSG exclusion zones as published by NSW and the subsequent publication of those NSW maps does not alter the information in our assessments.
A polygon dataset showing critical industry Equine Clusters in the Upper Hunter region.
The horse breeding cluster includes a highly integrated concentration of horse breeding facilities and related infrastructure covering thoroughbred and stock horse breeding centres and numerous other equine developments and support services, such as a specialised veterinary centre.
Purpose
Industry clusters that meet the following criteria:
- there is a concentration of enterprises that provides clear development and
marketing advantages and is based on an agricultural product;
the productive industries are interrelated;
it consists of a unique combination of factors such as location, infrastructure,
heritage and natural resources;
it is of national and/or international importance;
it is an iconic industry that contributes to the region's identity; and
it is potentially substantially impacted by coal seam gas or mining proposals.
Dataset History
The equine cluster is spatially defined as the following land (excluding State Forests and National Park):
Mapping was first completed at a broad regional scale in 2012 as part of the Upper Hunter Strategic Regional Land Use Plan, a commitment was made in the Plan to verify the location of specific enterprises in the clusters.
In 2013, an independent consultant conducted the regional verification process, with input from industry members. The consultant used evidence of current commercial activity.
These maps were exhibited in October and November 2013 to ensure that the process captured all relevant enterprises. Landholders were given the opportunity to nominate their land for inclusion if it met certain criteria. Mining and coal seam gas companies were also given an opportunity to identify properties that they owned as at the date of release of the Strategic Regional Land Use Plan (10 September 2012) to have these properties removed from the CIC mapping.
Dataset Citation
NSW Department of Planning and Infrastructure (2013) Strategic Agricultural Lands (SAL) Equine Critical Industry Cluster. Bioregional Assessment Source Dataset. Viewed 27 September 2017, http://data.bioregionalassessments.gov.au/dataset/81056a9a-bdca-4e2a-8288-759ac4fbafff.
FacebookTwitterHistograms and results of k-means and Ward's clustering for Hidden Room game
The fileset contains information from three sources:
1. Histograms files:
* Lexical_histogram.png (histogram of lexical error ratios)
* Grammatical_histogram.png (histogram of grammatical error ratios)
2. K-means clustering files:
* elbow-lex kmeans.png (clustering by lexical aspects: error curves obtained for applying elbow method to determinate the optimal number of clusters)
* cube-lex kmeans.png (clustering by lexical aspects: a three-dimensional representation of clusters obtained after applying k-means method)
* Lexical_clusters (table) kmeans.xls (clustering by lexical aspects: centroids, standard deviations and number of instances assigned to each cluster)
* elbow-gram kmeans.png (clustering by grammatical aspects: error curves obtained for applying elbow method to determinate the optimal number of clusters)
* cube-gramm kmeans.png (clustering by grammatical aspects: a three-dimensional representation of clusters obtained after applying k-means method)
* Grammatical_clusters (table) kmeans.xls (clustering by grammatical aspects: centroids, standard deviations and number of instances assigned to each cluster)
* elbow-lexgram kmeans.png (clustering by lexical and grammatical aspects: error curves obtained for applying elbow method to determinate the optimal number of clusters)
* Lexical_Grammatical_clusters (table) kmeans.xls (clustering by lexical and grammatical aspects: centroids, standard deviations and number of instances assigned to each cluster)
* Grammatical_clusters_number_of_words (table) kmeans.xls : number of words (from column 2 to 4) and sizes (last column) obtained per each cluster by applying k-means clustering to grammatical error ratios.
* Lexical_clusters_number_of_words (table) kmeans.xls : number of words (from column 2 to 4) and sizes (last column) obtained per each cluster by applying k-means clustering to lexical error ratios.
* Lexical_Grammatical_clusters_number_of_words (table) kmeans.xls : number of words (from column 2 to 4) and sizes (last column) obtained per each cluster by applying k-means clustering to lexical and grammatical error ratios.
3. Ward’s Agglomerative Hierarchical Clustering files:
* Lexical_Cluster_Dendrogram_ward.png (clustering by lexical aspects: dendrogram obtained after applying Ward's clustering method).
* Grammatical_Cluster_Dendrogram_ward.png (clustering by grammatical aspects: dendrogram obtained after applying Ward's clustering method)
* Lexical_Grammatical_Cluster_Dendrogram_ward.png (clustering by lexical and grammatical aspects: dendrogram obtained after applying Ward's clustering method)
* Lexical_Grammatical_clusters (table) ward.xls: Centroids (from column 2 to 7) and cluster sizes (last column) obtained by applying Ward's agglomerative hierarchical clustering to lexical and grammatical error ratios.
* Grammatical_clusters (table) ward.xls: Centroids (from column 2 to 4) and cluster sizes (last column) obtained by applying Ward's agglomerative hierarchical clustering to grammatical error ratios.
* Lexical_clusters (table) ward.xls: Centroids (from column 2 to 4) and cluster sizes (last column) obtained by applying Ward's agglomerative hierarchical clustering to lexical error ratios.
* Lexical_clusters_number_of_words (table) ward.xls: number of words (from column 2 to 4) and sizes (last column) obtained per each cluster by applying Ward's agglomerative hierarchical clustering to lexical error ratios.
* Grammatical_clusters_number_of_words (table) ward.xls: number of words (from column 2 to 4) and sizes (last column) obtained per each cluster by applying Ward's agglomerative hierarchical clustering to grammatical error ratios.
* Lexical_Grammatical_clusters_number_of_words (table) ward.xls: number of words (from column 2 to 4) and sizes (last column) obtained per each cluster by applying Ward's agglomerative hierarchical clustering to lexical and grammatical error ratios.