Canadian Cluster Map Portal Data
- open.canada.ca
csvUpdated Feb 21, 2022+ more versions Share
Share Facebook
 Twitter
 EmailClick to copy linkLink copiedCiteInnovation, Science and Economic Development Canada (2022). Canadian Cluster Map Portal Data [Dataset]. https://open.canada.ca/data/en/dataset/83c19800-74a9-4da5-8d67-d2e0611e167fcsvAvailable download formatsDataset updatedFeb 21, 2022License
Open Government Licence - Canada 2.0https://open.canada.ca/en/open-government-licence-canada
License information was derived automaticallyTime period coveredJan 1, 2006 - Dec 31, 2017Area coveredCanadaDescriptionThe datasets provided encompass all the statistics found on the Canadian Cluster Map Portal. Moreover, additional information such as cluster-concordance and cluster descriptions are provided to allow for accurate analysis of the data.
- N
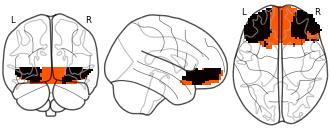
Connectivity-Based Parcellation of the Human Orbitofrontal Cortex: K=2...
- neurovault.org
niftiUpdated Nov 18, 2024+ more versionsShareFacebookTwitterEmailClick to copy linkLink copiedCite(2024). Connectivity-Based Parcellation of the Human Orbitofrontal Cortex: K=2 cluster map [Dataset]. http://identifiers.org/neurovault.image:887623niftiAvailable download formatsUnique identifierhttps://identifiers.org/neurovault.image:887623Dataset updatedNov 18, 2024LicenseCC0 1.0 Universal Public Domain Dedicationhttps://creativecommons.org/publicdomain/zero/1.0/
License information was derived automaticallyDescriptionK=2 cluster map based on N=13 participants.
Collection description
K-means cluster maps of orbitofrontal cortex with K=2, 3, 4, 5, 6, and 7 clusters based on resting-state fMRI data.
Subject species
homo sapiens
Modality
fMRI-BOLD
Analysis level
group
Cognitive paradigm (task)
rest eyes open
Map type
R
- f
World Clusters map
- data.apps.fao.org
Updated Mar 2, 2024ShareFacebookTwitterEmailClick to copy linkLink copiedCite(2024). World Clusters map [Dataset]. https://data.apps.fao.org/map/catalog/srv/resources/datasets/d772cf60-88fd-11da-a88f-000d939bc5d8Dataset updatedMar 2, 2024Area coveredWorldDescriptionWorld cluster map of the world based on a Coastal zone (LOICZ) database received in 1995 from the Netherlands Institute for Sea Research (NIOZ).
- f
R script and datasets - Cluster Analysis and Heat maps
- figshare.com
txtUpdated May 30, 2020ShareFacebookTwitterEmailClick to copy linkLink copiedCiteChui Pin Leaw; Po Teen Lim; Li Keat Lee (2020). R script and datasets - Cluster Analysis and Heat maps [Dataset]. http://doi.org/10.6084/m9.figshare.12387242.v2txtAvailable download formatsUnique identifierhttps://doi.org/10.6084/m9.figshare.12387242.v2Dataset updatedMay 30, 2020Dataset provided byfigshareAuthorsChui Pin Leaw; Po Teen Lim; Li Keat LeeLicenseAttribution 4.0 (CC BY 4.0)https://creativecommons.org/licenses/by/4.0/
License information was derived automaticallyDescriptionThis folder contained R scripts and data sets used to generate clustering dendogram and heatmaps as shown Fig. 3.
Hydrochemical Clusters Map: K-Means Clustering Results for Southcentral...
- figshare.com
htmlUpdated Jan 11, 2025ShareFacebookTwitterEmailClick to copy linkLink copiedCiteAbhinav Choudhary (2025). Hydrochemical Clusters Map: K-Means Clustering Results for Southcentral Alaska [Dataset]. http://doi.org/10.6084/m9.figshare.28188833.v1htmlAvailable download formatsUnique identifierhttps://doi.org/10.6084/m9.figshare.28188833.v1Dataset updatedJan 11, 2025AuthorsAbhinav ChoudharyLicenseAttribution 4.0 (CC BY 4.0)https://creativecommons.org/licenses/by/4.0/
License information was derived automaticallyArea coveredSouthcentral Alaska, AlaskaDescriptionThis interactive map shows the spatial distribution of hydrochemical data across Southcentral Alaska using K-Means clustering. The dataset includes key hydrochemical measurements, and each cluster is represented by a unique color on the map. The map is generated using Leaflet and Folium libraries in Python.The static version is available in the main manuscript, while this HTML file provides a dynamic exploration of clustering results.Contact: Abhinav Choudhary (Chandigarh University, MSc Data Science)Date of creation: 2025-01-11
- c
Cluster Maps
- data.catchmentbasedapproach.org
Updated Jun 4, 2024ShareFacebookTwitterEmailClick to copy linkLink copiedCiteDefra Group Open (2024). Cluster Maps [Dataset]. https://data.catchmentbasedapproach.org/maps/defra-open::cluster-maps-1Dataset updatedJun 4, 2024Dataset authored and provided byDefra Group OpenLicenseMIT Licensehttps://opensource.org/licenses/MIT
License information was derived automaticallyArea coveredDescriptionCluster Maps
- a
Kmeans SEZ Composite
- hub.arcgis.com
Updated Feb 15, 2023+ more versionsShareFacebookTwitterEmailClick to copy linkLink copiedCitegISU (2023). Kmeans SEZ Composite [Dataset]. https://hub.arcgis.com/maps/ISU::kmeans-sez-compositeDataset updatedFeb 15, 2023Dataset authored and provided bygISUArea coveredDescriptionSee Publication: https://doi.org/10.1002/ecs2.4242 Policy interest in socio-ecological systems has driven attempts to define and map socio-ecological zones (SEZs), that is, spatial regions, distinguishable by their conjoined social and bio-geo-physical characteristics. The state of Idaho, USA, has a strong need for SEZ designations because of potential conflicts between rapidly increasing and impactful human populations, and proximal natural ecosystems. Our Idaho SEZs address analytical shortcomings in previously published SEZs by: (1) considering potential biases of clustering methods, (2) cross-validating SEZ classifications, (3) measuring the relative importance of bio-geo-physical and social system predictors, and (4) considering spatial autocorrelation. We obtained authoritative bio-geo-physical and social system datasets for Idaho, aggregated into 5-km grids = 25 km2, and decomposed these using principal components analyses (PCAs). PCA scores were classified using two clustering techniques commonly used in SEZ mapping: hierarchical clustering with Ward's linkage, and k-means analysis. Classification evaluators indicated that eight- and five-cluster solutions were optimal for the bio-geo-physical and social datasets for Ward's linkage, resulting in 31 SEZ composite types, and six- and five-cluster solutions were optimal for k-means analysis, resulting in 24 SEZ composite types. Ward's and k-means solutions were similar for bio-geo-physical and social classifications with similar numbers of clusters. Further, both classifiers identified the same dominant SEZ composites. For rarer SEZs, however, classification methods strongly affected SEZ classifications, potentially altering land management perspectives. Our SEZs identify several critical regions of social–ecological overlap. These include suburban interface types and a high desert transition zone. Based on multinomial generalized linear models, bio-geo-physical information explained more variation in SEZs than social system data, after controlling for spatial autocorrelation, under both Ward's and k-means approaches. Agreement (cross-validation) levels were high for multinomial models with bio-geo-physical and social predictors for both Ward's and k-means SEZs. A consideration of historical drivers, including indigenous social systems, and current trajectories of land and resource management in Idaho, indicates a strong need for rigorous SEZ designations to guide development and conservation in the region. Our analytical framework can be broadly applied in SES research and applied in other regions, when categorical responses—including cluster designations—have a spatial component.
- d
Neighborhood Clusters
- opendata.dc.gov
- catalog.data.gov
Updated Jul 28, 2021ShareFacebookTwitterEmailClick to copy linkLink copiedCiteCity of Washington, DC (2021). Neighborhood Clusters [Dataset]. https://opendata.dc.gov/datasets/neighborhood-clustersDataset updatedJul 28, 2021Dataset authored and provided byCity of Washington, DCLicenseAttribution 4.0 (CC BY 4.0)https://creativecommons.org/licenses/by/4.0/
License information was derived automaticallyArea coveredDescriptionThis data set describes Neighborhood Clusters that have been used for community planning and related purposes in the District of Columbia for many years. It does not represent boundaries of District of Columbia neighborhoods. Cluster boundaries were established in the early 2000s based on the professional judgment of the staff of the Office of Planning as reasonably descriptive units of the City for planning purposes. Once created, these boundaries have been maintained unchanged to facilitate comparisons over time, and have been used by many city agencies and outside analysts for this purpose. (The exception is that 7 “additional” areas were added to fill the gaps in the original dataset, which omitted areas without significant neighborhood character such as Rock Creek Park, the National Mall, and the Naval Observatory.) The District of Columbia does not have official neighborhood boundaries. The Office of Planning provides a separate data layer containing Neighborhood Labels that it uses to place neighborhood names on its maps. No formal set of standards describes which neighborhoods are included in that dataset.Whereas neighborhood boundaries can be subjective and fluid over time, these Neighborhood Clusters represent a stable set of boundaries that can be used to describe conditions within the District of Columbia over time.
- M
Map of Service Areas - Clusters
- data.montgomeryschoolsmd.org
csv, xlsx, xmlUpdated Jun 23, 2016ShareFacebookTwitterEmailClick to copy linkLink copiedCite(2016). Map of Service Areas - Clusters [Dataset]. https://data.montgomeryschoolsmd.org/w/3hy6-nzu3/tf2z-49td?cur=u8XX-kpqrOU&from=igR9PPcIPGkcsv, xlsx, xmlAvailable download formatsDataset updatedJun 23, 2016DescriptionMCPS Cluster Service Areas
- e
Structural vision RO, Regional clusters — Vision map
- data.europa.eu
Updated Jul 26, 2023+ more versionsShareFacebookTwitterEmailClick to copy linkLink copiedCite(2023). Structural vision RO, Regional clusters — Vision map [Dataset]. https://data.europa.eu/data/datasets/8c528f4a-7814-4a47-8ed3-8bf8fa46b6c3Dataset updatedJul 26, 2023DescriptionEconomic knowledge clusters. A distinction is made between ‘Metropolitan region’, ‘Economic knowledge cluster’ and ‘Indication economic cluster outside Brabant’.
- d
Alqami Human Mobility Data Global | location data, map data, clustering or...
- datarade.ai
Updated Nov 20, 2020ShareFacebookTwitterEmailClick to copy linkLink copiedCiteAlqami (2020). Alqami Human Mobility Data Global | location data, map data, clustering or contextualisation [Dataset]. https://datarade.ai/data-products/human-mobility-global-alqamiDataset updatedNov 20, 2020Dataset authored and provided byAlqamiArea coveredRomania, Russian Federation, Cyprus, Jersey, Greenland, Kazakhstan, Bulgaria, Mongolia, Jordan, Virgin Islands (U.S.)DescriptionPredict financial performance of companies versus competitors based on site performance, understand human mobility globally to help local and national authorities better predict and plan for the future, or analyse these insights to identify macro trends and areas of opportunity for growth for your business.
- Raw location data, unique clustering and contextualisation available as well to better understand how people relate to physical relations
- Large global coverage over 5 continents
- 127 million monthly active users in the US
- All data is rigorously vetted for quality and privacy compliance
- History: Up to 3 years
- Frequency: Daily
- Universe: Retail, Real Estate, Travel & Tourism, Entertainment
- h
FinePersonas-v0.1-clustering-100k
- huggingface.co
Updated Oct 18, 2024+ more versionsShareFacebookTwitterEmailClick to copy linkLink copiedCiteArgilla (2024). FinePersonas-v0.1-clustering-100k [Dataset]. https://huggingface.co/datasets/argilla/FinePersonas-v0.1-clustering-100kCroissantCroissant is a format for machine-learning datasets. Learn more about this at mlcommons.org/croissant.Dataset updatedOct 18, 2024Dataset authored and provided byArgillaLicensehttps://choosealicense.com/licenses/llama3/https://choosealicense.com/licenses/llama3/
DescriptionDataset Card for PersonaHub FineWeb-Edu 4 Clustering 100k
This dataset has been created with distilabel. The following figure is a map of the clusters generated from the pipeline. It's automatically generated by the TextClustering with all the information gathered. It contains 177 different clusters, which were assigned a set of 3 labels each, and the black dots correspond to those unclassified examples.
Dataset SummaryThis dataset has been… See the full description on the dataset page: https://huggingface.co/datasets/argilla/FinePersonas-v0.1-clustering-100k.
- M
School Clusters Map
- data.montgomeryschoolsmd.org
csv, xlsx, xmlUpdated Jun 23, 2016 - H
Clustering of Ncloud maps
- dataverse.harvard.edu
Updated Oct 4, 2021ShareFacebookTwitterEmailClick to copy linkLink copiedCiteGiuseppe Puglisi (2021). Clustering of Ncloud maps [Dataset]. http://doi.org/10.7910/DVN/XAMJ4XCroissantCroissant is a format for machine-learning datasets. Learn more about this at mlcommons.org/croissant.Unique identifierhttps://doi.org/10.7910/DVN/XAMJ4XDataset updatedOct 4, 2021Dataset provided byHarvard DataverseAuthorsGiuseppe PuglisiLicenseCC0 1.0 Universal Public Domain Dedicationhttps://creativecommons.org/publicdomain/zero/1.0/
License information was derived automaticallyDescriptionHealpix maps of Nclouds from https://iopscience.iop.org/article/10.3847/1538-4357/abb6f5 and the uncertainties Map of patches estimated from spectral clustering .
- p
Busia K-Means Cluster Map
- purr.purdue.edu
Updated Nov 18, 2019ShareFacebookTwitterEmailClick to copy linkLink copiedCiteJoshua Minai; Darrell Schulze (2019). Busia K-Means Cluster Map [Dataset]. http://doi.org/10.4231/4Q9T-FT90Unique identifierhttps://doi.org/10.4231/4Q9T-FT90Dataset updatedNov 18, 2019Dataset provided byPURRAuthorsJoshua Minai; Darrell SchulzeLicenseCC0 1.0 Universal Public Domain Dedicationhttps://creativecommons.org/publicdomain/zero/1.0/
License information was derived automaticallyArea coveredBusiaDescriptionMap that mimics the geometry of 'fully developed slopes'.
- e
Milky Way nuclear star cluster extinction map - Dataset - B2FIND
- b2find.eudat.eu
Updated Oct 28, 2023ShareFacebookTwitterEmailClick to copy linkLink copiedCite(2023). Milky Way nuclear star cluster extinction map - Dataset - B2FIND [Dataset]. https://b2find.eudat.eu/dataset/f8ba9e0a-80cb-5574-b6ba-ceec5c0561b5Dataset updatedOct 28, 2023DescriptionAlthough the Milky Way Nuclear Star Cluster (MWNSC) was discovered more than four decades ago, several of its key properties have not been determined unambiguously up to now because of the strong and spatially highly variable interstellar extinction toward the Galactic centre. In this paper we aim at determining the shape, size, and luminosity/mass of the MWNSC.In order to investigate the properties of the MWNSC, we use Spitzer/IRAC images at 3.6 and 4.5{mu}m, where interstellar extinction is at a minimum but the overall emission is still dominated by stars. We correct the 4.5{mu}m image for PAH emission with the help of the IRAC 8.0{mu}m map and for extinction with the help of a [3.6-4.5] colour map. Finally, we investigate the symmetry of the nuclear cluster and fit it with Sersic, Moffat, and King models. We present an extinction map for the central ~300x200pc^2^ of the Milky Way, as well as a PAH-emission and extinction corrected image of the stellar emission, with a resolution of about 0.20pc. We find that the MWNSC appears in projection intrinsically point-symmetric, that it is significantly flattened, with its major axis aligned along the Galactic Plane, and that it is centred on the black hole, Sagittarius A. Its density follows the well known approximate {rho}{prop.to}r^-2^-law at distances of a few parsecs from Sagittarius A, but becomes as steep as about {rho}{prop.to}r^-3^ at projected radii around 5pc. We derive a half light radius of 4.2+/-0.4pc, a total luminosity of L_MWNSC,4.5{mu}m_=4.1+/-0.4x10^7^L_{sun}, and a mass of M_MWNSC=2.1+/-0.4x10^7^M_{sun}_. The overall properties of the MWNSC agree well with the ones of its extragalactic counterparts, which underlines its role as a template for these objects. Its flattening agrees well with its previously established rotation parallel to Galactic rotation and suggests that it has formed by accretion of material that fell in preferentially along the Galactic Plane. Our findings support the in situ growth scenario for nuclear clusters and emphasize the need to increase the complexity of theoretical models for their formation and for the interaction between their stars and the central black hole in order to include rotation, axisymmetry, and growth in recurrent episodes. Cone search capability for table J/A+A/566/A47/list (List of FITS maps) Associated data
- N
Cluster gene maps acute psychedelics
- neurovault.org
zipUpdated Apr 23, 2025ShareFacebookTwitterEmailClick to copy linkLink copiedCite(2025). Cluster gene maps acute psychedelics [Dataset]. http://identifiers.org/neurovault.collection:20426zipAvailable download formatsUnique identifierhttps://identifiers.org/neurovault.collection:20426Dataset updatedApr 23, 2025LicenseCC0 1.0 Universal Public Domain Dedicationhttps://creativecommons.org/publicdomain/zero/1.0/
License information was derived automaticallyDescriptionA collection of 6 brain maps. Each brain map is a 3D array of values representing properties of the brain at different locations.
Collection description
Indicative Flood Risk Areas - Clusters - Dataset - data.gov.uk
- ckan.publishing.service.gov.uk
Updated Nov 27, 2018+ more versionsShareFacebookTwitterEmailClick to copy linkLink copiedCiteckan.publishing.service.gov.uk (2018). Indicative Flood Risk Areas - Clusters - Dataset - data.gov.uk [Dataset]. https://ckan.publishing.service.gov.uk/dataset/indicative-flood-risk-areas-clustersDataset updatedNov 27, 2018DescriptionPLEASE NOTE: this dataset has been retired. It has been superseded by data for Flood Risk Areas: https://environment.data.gov.uk/dataset/f3d63ec5-a21a-49fb-803a-0fa0fb7238b6 The Indicative Flood Risk Areas are primarily based on an aggregated 1km square grid Updated Flood Map for Surface Water (1 in 100 and 1000 annual probability rainfall), informally referred to as the “blue square map”. • Cluster Maps – are aggregations of 3km by 3km squares that each contain at least 4 (in Wales) or 5 (in England) touching "blue squares" (i.e. 1km grid squares where one of the thresholds above is exceeded) This dataset forms part of Indicative Flood Risk Areas (shapefiles) A bundle download of all Indicative Flood Risk Areas spatial datasets is also available from this record. Please see individual records for full details and metadata on each product. Attribution statement: © Environment Agency copyright and/or database right 2016. All rights reserved.
- a
Berwick Crashes SR 4
- maine.hub.arcgis.com
Updated Jan 31, 2023ShareFacebookTwitterEmailClick to copy linkLink copiedCiteState of Maine (2023). Berwick Crashes SR 4 [Dataset]. https://maine.hub.arcgis.com/maps/maine::berwick-crashes-sr-4Dataset updatedJan 31, 2023Dataset authored and provided byState of MaineArea coveredDescriptionThis crash dataset does include crashes from 2023 up until near the end of January that have been reviewed and loaded into the Maine DOT Asset Warehouse. This crash dataset is static and was put together as an example showing the clustering functionality in ArcGIS Online. In addition the dataset was designed with columns that include data items at the Unit and Persons levels of a crash. The feature layer visualization by default will show the crashes aggregated by the predominant crash type along the corridor. The aggregation settings can be toggled off if desired and crashes can be viewed by the type of crash. Both the aggregation and standard Feature Layer configurations do include popup settings that have been configured.As mentioned above, the Feature Layer itself has been configured to include a standard unique value renderer based on Crash Type and the layer also includes clustering aggregation configurations that could be toggled on or off if the user were to add this layer to a new ArcGIS Online Map. Clustering and aggregation options in ArcGIS Online provide functionality that is not yet available in the latest version of ArcGIS Pro (<=3.1). This additional configuration includes how to show the popup content for the cluster of crashes. Users interested in learning more about clustering and aggregation in ArcGIS Online and some more advanced options should see the following ESRI article (https://www.esri.com/arcgis-blog/products/arcgis-online/mapping/summarize-and-explore-point-clusters-with-arcade-in-popups/).Popups have been configured for both the clusters and the individual crashes. The individual crashes themselves do include multiple tables within a single text element. The bottom table does include data items that pertain to at a maximum of three units for a crash. If a crash includes just one unit then this bottom table will include only 2 columns. For each additional unit involved in a crash an additional column will appear listing out those data items that pertain to that unit up to a maximum of 3 units. There are crashes that do include more than 3 units and information for these additional units is not currently included in the dataset at the moment. The crash data items available in this Feature Layer representation includes many of the same data items from the Crash Layer (10 Years) that are available for use in Maine DOT's Public Map Viewer Application that can be accessed from the following link(https://www.maine.gov/mdot/mapviewer/?added=Crashes%20-%2010%20Years). However this crash data includes data items that are not yet available in other GIS Crash Departments used in visualizations by the department currently. These additional data items can be aggregated using other presentation types such as a Chart, but could also be filtered in the map. Users should refer to the unit count associated to each crash and be aware when a units information may not be visible in those situations where there are four or more units involved in a crash.
- d
Database for the Geologic Map of the Katmai Volcanic Cluster, Katmai...
- catalog.data.gov
- data.usgs.gov
- +1more
Updated Aug 29, 2024ShareFacebookTwitterEmailClick to copy linkLink copiedCiteU.S. Geological Survey (2024). Database for the Geologic Map of the Katmai Volcanic Cluster, Katmai National Park, Alaska [Dataset]. https://catalog.data.gov/dataset/database-for-the-geologic-map-of-the-katmai-volcanic-cluster-katmai-national-park-alaskaDataset updatedAug 29, 2024Area coveredAlaskaDescriptionA database of the geologic map of the Katmai Volcanic Cluster as described in the original abstract: This digital publication contains all the geologic map information used to publish U.S. Geological Survey Geologic Investigations Map Series I-2778 (Hildreth and Fierstein, 2003). This is a geologic map of the Katmai volcanic cluster on the Alaska Peninsula (including Mount Katmai, Trident Volcano, Mount Mageik, Mount Martin, Mount Griggs, Snowy Mountain, Alagogshak volcano, and Novarupta volcano), and shows the distribution of ejecta from the great eruption of June, 1912 at Novarupta. Widely scattered erosional remnants of volcanic rocks, unrelated to but in the vicinity of the Katmai cluster, are also mapped. Distribution of glacial deposits, large landslides, debris avalanches, and surficial deposits are a snapshot of an ever-changing landscape.
FacebookTwitterOpen Government Licence - Canada 2.0https://open.canada.ca/en/open-government-licence-canada
License information was derived automatically
The datasets provided encompass all the statistics found on the Canadian Cluster Map Portal. Moreover, additional information such as cluster-concordance and cluster descriptions are provided to allow for accurate analysis of the data.