Canadian Cluster Map Portal Data
- open.canada.ca
csvUpdated Feb 21, 2022+ more versions Share
Share Facebook
 Twitter
 EmailClick to copy linkLink copiedCiteInnovation, Science and Economic Development Canada (2022). Canadian Cluster Map Portal Data [Dataset]. https://open.canada.ca/data/en/dataset/83c19800-74a9-4da5-8d67-d2e0611e167fcsvAvailable download formatsDataset updatedFeb 21, 2022License
Open Government Licence - Canada 2.0https://open.canada.ca/en/open-government-licence-canada
License information was derived automaticallyTime period coveredJan 1, 2006 - Dec 31, 2017Area coveredCanadaDescriptionThe datasets provided encompass all the statistics found on the Canadian Cluster Map Portal. Moreover, additional information such as cluster-concordance and cluster descriptions are provided to allow for accurate analysis of the data.
- N
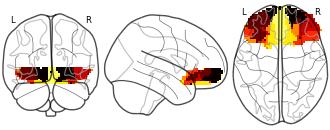
Connectivity-Based Parcellation of the Human Orbitofrontal Cortex: K=7...
- neurovault.org
niftiUpdated Nov 18, 2024+ more versionsShareFacebookTwitterEmailClick to copy linkLink copiedCite(2024). Connectivity-Based Parcellation of the Human Orbitofrontal Cortex: K=7 cluster map [Dataset]. http://identifiers.org/neurovault.image:887628niftiAvailable download formatsUnique identifierhttps://identifiers.org/neurovault.image:887628Dataset updatedNov 18, 2024LicenseCC0 1.0 Universal Public Domain Dedicationhttps://creativecommons.org/publicdomain/zero/1.0/
License information was derived automaticallyDescriptionK=7 cluster map based on N=13 participants.
Collection description
K-means cluster maps of orbitofrontal cortex with K=2, 3, 4, 5, 6, and 7 clusters based on resting-state fMRI data.
Subject species
homo sapiens
Modality
fMRI-BOLD
Analysis level
group
Cognitive paradigm (task)
rest eyes open
Map type
R
- f
World Clusters map
- data.apps.fao.org
Updated Mar 1, 2024ShareFacebookTwitterEmailClick to copy linkLink copiedCite(2024). World Clusters map [Dataset]. https://data.apps.fao.org/map/catalog/srv/resources/registries/vocabularies//concepts/Tag_landDataset updatedMar 1, 2024Area coveredWorldDescriptionWorld cluster map of the world based on a Coastal zone (LOICZ) database received in 1995 from the Netherlands Institute for Sea Research (NIOZ).
- d
Neighborhood Clusters
- opendata.dc.gov
- catalog.data.gov
- +1more
Updated Jul 28, 2021+ more versionsShareFacebookTwitterEmailClick to copy linkLink copiedCiteCity of Washington, DC (2021). Neighborhood Clusters [Dataset]. https://opendata.dc.gov/datasets/neighborhood-clustersDataset updatedJul 28, 2021Dataset authored and provided byCity of Washington, DCLicenseAttribution 4.0 (CC BY 4.0)https://creativecommons.org/licenses/by/4.0/
License information was derived automaticallyArea coveredDescriptionThis data set describes Neighborhood Clusters that have been used for community planning and related purposes in the District of Columbia for many years. It does not represent boundaries of District of Columbia neighborhoods. Cluster boundaries were established in the early 2000s based on the professional judgment of the staff of the Office of Planning as reasonably descriptive units of the City for planning purposes. Once created, these boundaries have been maintained unchanged to facilitate comparisons over time, and have been used by many city agencies and outside analysts for this purpose. (The exception is that 7 “additional” areas were added to fill the gaps in the original dataset, which omitted areas without significant neighborhood character such as Rock Creek Park, the National Mall, and the Naval Observatory.) The District of Columbia does not have official neighborhood boundaries. The Office of Planning provides a separate data layer containing Neighborhood Labels that it uses to place neighborhood names on its maps. No formal set of standards describes which neighborhoods are included in that dataset.Whereas neighborhood boundaries can be subjective and fluid over time, these Neighborhood Clusters represent a stable set of boundaries that can be used to describe conditions within the District of Columbia over time.
Clusters of interactions common between the Parkinson's disease map and the...
- data-staging.niaid.nih.gov
- data.niaid.nih.gov
- +1more
Updated Dec 18, 2022ShareFacebookTwitterEmailClick to copy linkLink copiedCiteMarek Ostaszewski (2022). Clusters of interactions common between the Parkinson's disease map and the Ageing map [Dataset]. https://data-staging.niaid.nih.gov/resources?id=zenodo_7448588Dataset updatedDec 18, 2022Dataset provided byLuxembourg Centre for Systems BiomedicineAuthorsMarek OstaszewskiLicenseAttribution 4.0 (CC BY 4.0)https://creativecommons.org/licenses/by/4.0/
License information was derived automaticallyDescriptionThis set of files was generated using the script demonstrating the use of MINERVA Net repository.
The script is available under:
https://gitlab.lcsb.uni.lu/minerva/api-scripts/-/blob/master/R/API-minervanet.R
The diagrams should be opened with the CellDesigner software (https://www.celldesigner.org/).
Hydrochemical Clusters Map: K-Means Clustering Results for Southcentral...
- figshare.com
htmlUpdated Jan 11, 2025ShareFacebookTwitterEmailClick to copy linkLink copiedCiteAbhinav Choudhary (2025). Hydrochemical Clusters Map: K-Means Clustering Results for Southcentral Alaska [Dataset]. http://doi.org/10.6084/m9.figshare.28188833.v1htmlAvailable download formatsUnique identifierhttps://doi.org/10.6084/m9.figshare.28188833.v1Dataset updatedJan 11, 2025AuthorsAbhinav ChoudharyLicenseAttribution 4.0 (CC BY 4.0)https://creativecommons.org/licenses/by/4.0/
License information was derived automaticallyArea coveredSouthcentral Alaska, AlaskaDescriptionThis interactive map shows the spatial distribution of hydrochemical data across Southcentral Alaska using K-Means clustering. The dataset includes key hydrochemical measurements, and each cluster is represented by a unique color on the map. The map is generated using Leaflet and Folium libraries in Python.The static version is available in the main manuscript, while this HTML file provides a dynamic exploration of clustering results.Contact: Abhinav Choudhary (Chandigarh University, MSc Data Science)Date of creation: 2025-01-11
- M
Map of Service Areas - Clusters
- data.montgomeryschoolsmd.org
csv, xlsx, xmlUpdated Jun 23, 2016ShareFacebookTwitterEmailClick to copy linkLink copiedCite(2016). Map of Service Areas - Clusters [Dataset]. https://data.montgomeryschoolsmd.org/w/3hy6-nzu3/tf2z-49td?cur=u8XX-kpqrOU&from=igR9PPcIPGkcsv, xlsx, xmlAvailable download formatsDataset updatedJun 23, 2016DescriptionMCPS Cluster Service Areas
- c
Cluster Maps
- data.catchmentbasedapproach.org
Updated Jun 4, 2024ShareFacebookTwitterEmailClick to copy linkLink copiedCiteDefra Group Open (2024). Cluster Maps [Dataset]. https://data.catchmentbasedapproach.org/maps/defra-open::cluster-maps-1Dataset updatedJun 4, 2024Dataset authored and provided byDefra Group OpenLicenseMIT Licensehttps://opensource.org/licenses/MIT
License information was derived automaticallyArea coveredDescriptionCluster Maps
- a
2011-2020 HSIP Bicycle Cluster
- geo-massdot.opendata.arcgis.com
- geodot-massdot.hub.arcgis.com
- +2more
Updated May 10, 2023+ more versionsShareFacebookTwitterEmailClick to copy linkLink copiedCiteMassachusetts geoDOT (2023). 2011-2020 HSIP Bicycle Cluster [Dataset]. https://geo-massdot.opendata.arcgis.com/datasets/MassDOT::2011-2020-hsip-bicycle-cluster/exploreDataset updatedMay 10, 2023Dataset authored and provided byMassachusetts geoDOTArea coveredDescriptionThe top locations where reported collisions occurred between bicyclists and motor vehicles have been identified. The crash cluster analysis methodology for the top bicyclist clusters uses a fixed meter search distance of 100 meters (328 ft.) to merge crash clusters together. Located crashes between motor vehicles and bicyclists were identified by using the non-motorist type code within the CDS database (which may yield different results from using most harmful event, first harmful event, or sequence of events data fields). Furthermore, the methodology uses the Equivalent Property Damage Only (EPDO) weighting to rank the clusters. However, because of the relatively small number of reported bicyclists crashes in the crash data file, the clustering analysis used crashes from the ten year period from 2010-2019. Additionally, due to the larger geographic area encompassed by the bicyclist crash clusters, it was difficult to name them so they were left unnamed but can be viewed spatially.
Using Dendritic Heat Maps to Simultaneously Display Genotype Divergence with...
- plos.figshare.com
- datasetcatalog.nlm.nih.gov
pdfUpdated Jun 7, 2023ShareFacebookTwitterEmailClick to copy linkLink copiedCiteMatthew Kellom; Jason Raymond (2023). Using Dendritic Heat Maps to Simultaneously Display Genotype Divergence with Phenotype Divergence [Dataset]. http://doi.org/10.1371/journal.pone.0161292pdfAvailable download formatsUnique identifierhttps://doi.org/10.1371/journal.pone.0161292Dataset updatedJun 7, 2023AuthorsMatthew Kellom; Jason RaymondLicenseAttribution 4.0 (CC BY 4.0)https://creativecommons.org/licenses/by/4.0/
License information was derived automaticallyDescriptionThe advancement of techniques to visualize and analyze large-scale sequencing datasets is an area of active research and is rooted in traditional techniques such as heat maps and dendrograms. We introduce dendritic heat maps that display heat map results over aligned DNA sequence clusters for a range of clustering cutoffs. Dendritic heat maps aid in visualizing the effects of group differences on clustering hierarchy and relative abundance of sampled sequences. Here, we artificially generate two separate datasets with simplified mutation and population growth procedures with GC content group separation to use as example phenotypes. In this work, we use the term phenotype to represent any feature by which groups can be separated. These sequences were clustered in a fractional identity range of 0.75 to 1.0 using agglomerative minimum-, maximum-, and average-linkage algorithms, as well as a divisive centroid-based algorithm. We demonstrate that dendritic heat maps give freedom to scrutinize specific clustering levels across a range of cutoffs, track changes in phenotype inequity across multiple levels of sequence clustering specificity, and easily visualize how deeply rooted changes in phenotype inequity are in a dataset. As genotypes diverge in sample populations, clusters are shown to break apart into smaller clusters at higher identity cutoff levels, similar to a dendrogram. Phenotype divergence, which is shown as a heat map of relative abundance bin response, may or may not follow genotype divergences. This joined view highlights the relationship between genotype and phenotype divergence for treatment groups. We discuss the minimum-, maximum-, average-, and centroid-linkage algorithm approaches to building dendritic heat maps and make a case for the divisive “top-down” centroid-based clustering methodology as being the best option visualize the effects of changing factors on clustering hierarchy and relative abundance.
Indicative Flood Risk Areas - Clusters
- data.europa.eu
- environment.data.gov.uk
unknown, zipUpdated Oct 11, 2021+ more versionsShareFacebookTwitterEmailClick to copy linkLink copiedCiteEnvironment Agency (2021). Indicative Flood Risk Areas - Clusters [Dataset]. https://data.europa.eu/data/datasets/indicative-flood-risk-areas-clusterszip, unknownAvailable download formatsDataset updatedOct 11, 2021DescriptionPLEASE NOTE: this dataset has been retired. It has been superseded by data for Flood Risk Areas: https://environment.data.gov.uk/dataset/f3d63ec5-a21a-49fb-803a-0fa0fb7238b6
The Indicative Flood Risk Areas are primarily based on an aggregated 1km square grid Updated Flood Map for Surface Water (1 in 100 and 1000 annual probability rainfall), informally referred to as the “blue square map”.
• Cluster Maps – are aggregations of 3km by 3km squares that each contain at least 4 (in Wales) or 5 (in England) touching "blue squares" (i.e. 1km grid squares where one of the thresholds above is exceeded)
This dataset forms part of Indicative Flood Risk Areas (shapefiles)
A bundle download of all Indicative Flood Risk Areas spatial datasets is also available from this record. Please see individual records for full details and metadata on each product. Attribution statement: © Environment Agency copyright and/or database right 2016. All rights reserved.
- C
Structural vision RO, Regional clusters - Vision map
- ckan.mobidatalab.eu
Updated Jul 13, 2023ShareFacebookTwitterEmailClick to copy linkLink copiedCiteOverheidNl (2023). Structural vision RO, Regional clusters - Vision map [Dataset]. https://ckan.mobidatalab.eu/dataset/5403-structuurvisie-ro-regionale-clusters-visiekaarthttp://publications.europa.eu/resource/authority/file-type/zipAvailable download formatsDataset updatedJul 13, 2023Dataset provided byOverheidNlLicensehttp://standaarden.overheid.nl/owms/terms/licentieonbekendhttp://standaarden.overheid.nl/owms/terms/licentieonbekend
DescriptionEconomic knowledge clusters. A distinction is made between "Metropolitan region", "Economic knowledge cluster" and "Indication economic cluster outside Brabant".
- d
Data from: Database for the Geologic Map of Three Sisters Volcanic Cluster,...
- catalog.data.gov
- data.usgs.gov
- +1more
Updated Nov 21, 2025+ more versionsShareFacebookTwitterEmailClick to copy linkLink copiedCiteU.S. Geological Survey (2025). Database for the Geologic Map of Three Sisters Volcanic Cluster, Cascade Range, Oregon [Dataset]. https://catalog.data.gov/dataset/database-for-the-geologic-map-of-three-sisters-volcanic-cluster-cascade-range-oregonDataset updatedNov 21, 2025Area coveredThree Sisters, Oregon, Cascade RangeDescriptionA database of geologic map of Three Sisters Volcanic Cluster as described in the original abstract: The geologic map represents part of a late Quaternary volcanic field within which scores of eruptions have taken place over the last 50,000 years, some as recently as ~1,500 years ago. No rocks of early Pleistocene (or greater) age crop out within the map area, although volcanic and derivative sedimentary rocks of Miocene and Pliocene age are widespread to the east and west and are certainly buried beneath the younger volcanic field. Of the 145 volcanic map units described herein, only 22 are certainly older than late Pleistocene (>126 ka), and 12 are postglacial (<15 ka). The oldest unit identified yields an age of 532+/-7 ka, and the second oldest, 374+/-6 ka. Compositionally, 10 percent of the units are true basalt; 36 percent, basaltic andesite; 20 percent, andesite; 21.5 percent, dacite; and only 12.5 percent, rhyodacite or rhyolite. Most of the 145 volcanic map units described herein are newly defined, although equivalents of several were described by Taylor, 1978, 1987; Scott, 1987; and Scott and Gardner, 1992. Each is an eruptive unit derived from a single vent or fissure. Some are simple flow units, but many are shields, cones, or stacks of several lava flows that have chemical and mineralogical coherence. Each unit was delineated by field mapping on foot and its integrity confirmed, challenged, or revised by chemical and microscopic work in the laboratory. Definition of a few units required iterative acquisition of field and lab data over a period of years, providing a firm basis for subdividing, lumping, or correlating slightly heterogeneous sequences of lavas. Most units have narrow compositional ranges, but some show zoning or heterogeneity spanning ranges of a few percent SiO2.
- m
2019-2021 HSIP Cluster
- gis.data.mass.gov
- geo-massdot.opendata.arcgis.com
- +3more
Updated Jul 2, 2024+ more versionsShareFacebookTwitterEmailClick to copy linkLink copiedCiteMassachusetts geoDOT (2024). 2019-2021 HSIP Cluster [Dataset]. https://gis.data.mass.gov/datasets/MassDOT::2019-2021-hsip-cluster-Dataset updatedJul 2, 2024Dataset authored and provided byMassachusetts geoDOTArea coveredDescriptionThe top locations where reported collisions occurred at intersections have been identified. The crash cluster analysis methodology for the top intersection clusters uses a fixed meter search distance of 25 meters (82 ft.) to merge crash clusters together. This analysis was based on crashes where a police officer specified one of the following junction types: Four way intersection, T-intersection, Y-intersection, five point or more. Furthermore, the methodology uses the Equivalent Property Damage Only (EPDO) weighting to rank the clusters. EPDO is based any type of injury crash (including fatal, incapacitating, non-incapacitating and possible) having a weighting of 21 compared to a property damage only crash (which has weighting of 1). The clustering analysis used crashes from the three year period from 2019-2021. The area encompassing the crash cluster may cover a larger area than just the intersection so it is critical to view these spatially.
- a
School Cluster Boundaries (MCPS)
- hub.arcgis.com
- arc-gis-hub-home-arcgishub.hub.arcgis.com
Updated Jul 20, 2021ShareFacebookTwitterEmailClick to copy linkLink copiedCiteMontgomery Maps (2021). School Cluster Boundaries (MCPS) [Dataset]. https://hub.arcgis.com/maps/MCPlanning::school-cluster-boundaries-mcpsDataset updatedJul 20, 2021Dataset authored and provided byMontgomery MapsLicenseMIT Licensehttps://opensource.org/licenses/MIT
License information was derived automaticallyArea coveredMontgomery County Public Schools,DescriptionGroups of geographically defined attendance areas. They include elementary and middle-level schools that feed into particular high schools and consortium schools.For further details: https://www2.montgomeryschoolsmd.org/departments/Clusteradmin/Clusters/indexFor more information, contact: GIS Manager Information Technology & Innovation (ITI) Montgomery County Planning Department, MNCPPC T: 301-650-5620
- f
Clusters indicated as mapping priorities with their constituent diseases...
- datasetcatalog.nlm.nih.gov
- plos.figshare.com
Updated Jun 10, 2015ShareFacebookTwitterEmailClick to copy linkLink copiedCiteDowell, Scott F.; Krause, L. Kendall; Kimball, Ann M.; Battle, Katherine E.; Howes, Rosalind E.; Kyu, Hmwe H.; Wiebe, Antoinette; Gething, Peter W.; Farag, Tamer H.; Murray, Christopher J. L.; Pigott, David M.; Hay, Simon I.; Brooker, Simon J.; Smith, Craig H.; Vos, Theo; Golding, Nick; Garcia, Andres J.; Moyes, Catherine L. (2015). Clusters indicated as mapping priorities with their constituent diseases recommended for distribution modelling and current global mapping projects identified. [Dataset]. https://datasetcatalog.nlm.nih.gov/dataset?q=0001872787Dataset updatedJun 10, 2015AuthorsDowell, Scott F.; Krause, L. Kendall; Kimball, Ann M.; Battle, Katherine E.; Howes, Rosalind E.; Kyu, Hmwe H.; Wiebe, Antoinette; Gething, Peter W.; Farag, Tamer H.; Murray, Christopher J. L.; Pigott, David M.; Hay, Simon I.; Brooker, Simon J.; Smith, Craig H.; Vos, Theo; Golding, Nick; Garcia, Andres J.; Moyes, Catherine L.Description- Indicates default null value.MAP—Malaria Atlas Project; WHO—World Health Organization; GBD—Global Burden of Disease; GAHI—Global Atlas of Helminth Infections; SEEG—Spatial Ecology and Epidemiology Group; APOC—African Programme for Onchocerciasis Control; GAT—Global Atlas of TrachomaClusters indicated as mapping priorities with their constituent diseases recommended for distribution modelling and current global mapping projects identified.
- p
Busia K-Means Cluster Map
- purr.purdue.edu
Updated Nov 18, 2019ShareFacebookTwitterEmailClick to copy linkLink copiedCiteJoshua Minai; Darrell Schulze (2019). Busia K-Means Cluster Map [Dataset]. http://doi.org/10.4231/4Q9T-FT90Unique identifierhttps://doi.org/10.4231/4Q9T-FT90Dataset updatedNov 18, 2019Dataset provided byPURRAuthorsJoshua Minai; Darrell SchulzeLicenseCC0 1.0 Universal Public Domain Dedicationhttps://creativecommons.org/publicdomain/zero/1.0/
License information was derived automaticallyArea coveredBusiaDescriptionMap that mimics the geometry of 'fully developed slopes'.
- N
Cluster gene maps acute psychedelics: Cluster map 2
- neurovault.org
niftiUpdated Apr 23, 2025+ more versionsShareFacebookTwitterEmailClick to copy linkLink copiedCite(2025). Cluster gene maps acute psychedelics: Cluster map 2 [Dataset]. http://identifiers.org/neurovault.image:898778niftiAvailable download formatsUnique identifierhttps://identifiers.org/neurovault.image:898778Dataset updatedApr 23, 2025LicenseCC0 1.0 Universal Public Domain Dedicationhttps://creativecommons.org/publicdomain/zero/1.0/
License information was derived automaticallyDescription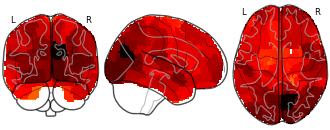
Collection description
Subject species
homo sapiens
Map type
Other
Cluster descriptions.
- plos.figshare.com
xlsUpdated Nov 30, 2023+ more versionsShareFacebookTwitterEmailClick to copy linkLink copiedCiteWaad R. Alolayan; Jana M. Rieger; Minn N. Yoon (2023). Cluster descriptions. [Dataset]. http://doi.org/10.1371/journal.pone.0294712.t002xlsAvailable download formatsUnique identifierhttps://doi.org/10.1371/journal.pone.0294712.t002Dataset updatedNov 30, 2023AuthorsWaad R. Alolayan; Jana M. Rieger; Minn N. YoonLicenseAttribution 4.0 (CC BY 4.0)https://creativecommons.org/licenses/by/4.0/
License information was derived automaticallyDescriptionWith the increasing focus on patient-centred care, this study sought to understand priorities considered by patients and healthcare providers from their experience with head and neck cancer treatment, and to compare how patients’ priorities compare to healthcare providers’ priorities. Group concept mapping was used to actively identify priorities from participants (patients and healthcare providers) in two phases. In phase one, participants brainstormed statements reflecting considerations related to their experience with head and neck cancer treatment. In phase two, statements were sorted based on their similarity in theme and rated in terms of their priority. Multidimensional scaling and cluster analysis were performed to produce multidimensional maps to visualize the findings. Two-hundred fifty statements were generated by participants in the brainstorming phase, finalized to 94 statements that were included in phase two. From the sorting activity, a two-dimensional map with stress value of 0.2213 was generated, and eight clusters were created to encompass all statements. Timely care, education, and person-centred care were the highest rated priorities for patients and healthcare providers. Overall, there was a strong correlation between patient and healthcare providers’ ratings (r = 0.80). Our findings support the complexity of the treatment planning process in head and neck cancer, evident by the complex maps and highly interconnected statements related to the experience of treatment. Implications for improving the quality of care delivered and care experience of head and cancer are discussed.
Statistics of the clusterings obtained by the map equation methods Metimap...
- plos.figshare.com
xlsUpdated Jun 1, 2023ShareFacebookTwitterEmailClick to copy linkLink copiedCiteLovro Šubelj; Nees Jan van Eck; Ludo Waltman (2023). Statistics of the clusterings obtained by the map equation methods Metimap and Infomap. [Dataset]. http://doi.org/10.1371/journal.pone.0154404.t005xlsAvailable download formatsUnique identifierhttps://doi.org/10.1371/journal.pone.0154404.t005Dataset updatedJun 1, 2023AuthorsLovro Šubelj; Nees Jan van Eck; Ludo WaltmanLicenseAttribution 4.0 (CC BY 4.0)https://creativecommons.org/licenses/by/4.0/
License information was derived automaticallyDescriptionThe methods are applied to the Library & Information Science citation network and the largest scientometric clusters with s ≥ 50 are shown. See Fig 5 for a comparison of the clusterings and text for the interpretation.
FacebookTwitterOpen Government Licence - Canada 2.0https://open.canada.ca/en/open-government-licence-canada
License information was derived automatically
The datasets provided encompass all the statistics found on the Canadian Cluster Map Portal. Moreover, additional information such as cluster-concordance and cluster descriptions are provided to allow for accurate analysis of the data.