- n
CMap
- neuinfo.org
- scicrunch.org
- +1more
Updated Jan 29, 2022 Share
Share Facebook
 Twitter
 EmailClick to copy linkLink copiedCite(2022). CMap [Dataset]. http://identifiers.org/RRID:SCR_016204Unique identifierhttps://identifiers.org/RRID:SCR_016204Dataset updatedJan 29, 2022Description
Dataset of cellular signatures that catalogs transcriptional responses of human cells to chemical and genetic perturbation. CMap contains perturbagens, expression signatures, and small molecules from cell lines.
- a
L1000 Connectivity Map perturbational profiles from Broad Institute LINCS...
- academictorrents.com
bittorrentUpdated Nov 12, 2019ShareFacebookTwitterEmailClick to copy linkLink copiedCiteLINCS (2019). L1000 Connectivity Map perturbational profiles from Broad Institute LINCS Center for Transcriptomics LINCS PHASE *II* (n=354,123; updated March 30, 2017) (Level 5 data) [Dataset]. https://academictorrents.com/details/99970027a2a6bd6eceb8b9113346f899a50e17bebittorrent(5365179698)Available download formatsDataset updatedNov 12, 2019Dataset authored and provided byLINCSLicensehttps://academictorrents.com/nolicensespecifiedhttps://academictorrents.com/nolicensespecified
DescriptionThe Library of Integrated Cellular Signatures (LINCS) is an NIH program which funds the generation of perturbational profiles across multiple cell and perturbation types, as well as read-outs, at a massive scale. The LINCS Center for Transcriptomics at the Broad Institute uses the L1000 high-throughput gene-expression assay to build a Connectivity Map which seeks to enable the discovery of functional connections between drugs, genes and diseases through analysis of patterns induced by common gene-expression changes. This is Level 5 data: GSE70138_Broad_LINCS_Level5_COMPZ_n118050x12328_2017-03-06.gctx.gz Series GSE70138 L1000 data is provided at five levels of the data processing pipeline: Level 1: Raw unprocessed flow cytometry data from Luminex (LXB) Level 2: Gene expression values per 1000 genes after deconvolution (GEX) Level 3: Quantile-normalized gene expression profiles of landmark genes and imputed transcripts (Q2NORM or INF) Level 4: Gene signatures computed using z-scores rela
- r
Connectivity Map 02
- rrid.site
- scicrunch.org
Updated Jan 29, 2022ShareFacebookTwitterEmailClick to copy linkLink copiedCite(2022). Connectivity Map 02 [Dataset]. http://identifiers.org/RRID:SCR_015674Unique identifierhttps://identifiers.org/RRID:SCR_015674Dataset updatedJan 29, 2022DescriptionCollection of genome-wide transcriptional expression data from cultured human cells treated with bioactive small molecules and simple pattern-matching algorithms. camp aims to enable the discovery of functional connections between drugs, genes and diseases through the transitory feature of common gene-expression changes.
- n
LINCS Connectivity Map
- neuinfo.org
- scicrunch.org
- +1more
Updated Oct 16, 2019ShareFacebookTwitterEmailClick to copy linkLink copiedCite(2019). LINCS Connectivity Map [Dataset]. http://identifiers.org/RRID:SCR_002639Unique identifierhttps://identifiers.org/RRID:SCR_002639Dataset updatedOct 16, 2019DescriptionA catalog of gene-expression data collected from human cells treated with chemical compounds and genetic reagents. Computational methods to reduce the number of necessary genomic measurements along with streamlined methodologies enable the current effort to significantly increase the size of the CMap database and along with it, our potential to connect human diseases with the genes that underlie them and the drugs that treat them. The NIH has funded a large expansion of the Connectivity Map dataset through the Library of Integrated Network-based Cellular Signatures (LINCS). The Broad Institute's LINCS center aims to create a first installment of data generation and analysis for the LINCS program. Through these data LINCS intends to accelerate the discovery process by systematically revealing connections between genes/compounds discovered in screens and molecular pathways that underlie disease states.
Comparative analysis of genes frequently regulated by drugs based on...
- plos.figshare.com
tiffUpdated Jun 1, 2023ShareFacebookTwitterEmailClick to copy linkLink copiedCiteXinhua Liu; Pan Zeng; Qinghua Cui; Yuan Zhou (2023). Comparative analysis of genes frequently regulated by drugs based on connectivity map transcriptome data [Dataset]. http://doi.org/10.1371/journal.pone.0179037tiffAvailable download formatsUnique identifierhttps://doi.org/10.1371/journal.pone.0179037Dataset updatedJun 1, 2023AuthorsXinhua Liu; Pan Zeng; Qinghua Cui; Yuan ZhouLicenseAttribution 4.0 (CC BY 4.0)https://creativecommons.org/licenses/by/4.0/
License information was derived automaticallyDescriptionGene expression is perturbated by drugs to different extent. Analyzing genes whose expression is frequently regulated by drugs would be useful for the screening of candidate therapeutic targets and genes implicated in side effect. Here, we obtained the differential expression number (DEN) for genes profiled in Affymetrix microarrays from the Connectivity Map project, and conducted systemic comparative computational analysis between high DEN genes and other genes. Results indicated that genes with higher down-/up-regulation number (down_h/up_h) tended to be clustered in genome, and have lower homologous gene number, higher SNP density and more disease-related SNP. Down_h and up_h were significantly enriched in cancer related pathways, while genes with lower down-/up-regulation number (down_l/up_l) were mainly involved in the development of nervous system diseases. Besides, up_h had lower interaction network degree, later developmental stage to express, higher tissue expression specificity than up_l, while down_h showed reversed tendency in comparison with down_l. Together, our analysis suggests that genes frequently regulated by drugs are more likely to be associated with disease-related functions, but the extensive activation of conserved and widely expressed genes by drugs is disfavored.
- f
Data_Sheet_1_In silico Drug Screening Approach Using L1000-Based...
- frontiersin.figshare.com
docxUpdated May 31, 2023ShareFacebookTwitterEmailClick to copy linkLink copiedCiteTakaharu Asano; Sarvesh Chelvanambi; Julius L. Decano; Mary C. Whelan; Elena Aikawa; Masanori Aikawa (2023). Data_Sheet_1_In silico Drug Screening Approach Using L1000-Based Connectivity Map and Its Application to COVID-19.docx [Dataset]. http://doi.org/10.3389/fcvm.2022.842641.s001docxAvailable download formatsUnique identifierhttps://doi.org/10.3389/fcvm.2022.842641.s001Dataset updatedMay 31, 2023Dataset provided byFrontiersAuthorsTakaharu Asano; Sarvesh Chelvanambi; Julius L. Decano; Mary C. Whelan; Elena Aikawa; Masanori AikawaLicenseAttribution 4.0 (CC BY 4.0)https://creativecommons.org/licenses/by/4.0/
License information was derived automaticallyDescriptionConventional drug screening methods search for a limited number of small molecules that directly interact with the target protein. This process can be slow, cumbersome and has driven the need for developing new drug screening approaches to counter rapidly emerging diseases such as COVID-19. We propose a pipeline for drug repurposing combining in silico drug candidate identification followed by in vitro characterization of these candidates. We first identified a gene target of interest, the entry receptor for the SARS-CoV-2 virus, angiotensin converting enzyme 2 (ACE2). Next, we employed a gene expression profile database, L1000-based Connectivity Map to query gene expression patterns in lung epithelial cells, which act as the primary site of SARS-CoV-2 infection. Using gene expression profiles from 5 different lung epithelial cell lines, we computationally identified 17 small molecules that were predicted to decrease ACE2 expression. We further performed a streamlined validation in the normal human epithelial cell line BEAS-2B to demonstrate that these compounds can indeed decrease ACE2 surface expression and to profile cell health and viability upon drug treatment. This proposed pipeline combining in silico drug compound identification and in vitro expression and viability characterization in relevant cell types can aid in the repurposing of FDA-approved drugs to combat rapidly emerging diseases.
Analysis of the query gene signature using the Connectivity-map 2.0.
- plos.figshare.com
xlsUpdated May 31, 2023ShareFacebookTwitterEmailClick to copy linkLink copiedCiteChiara Braconi; Erica Swenson; Takayuki Kogure; Nianyuan Huang; Tushar Patel (2023). Analysis of the query gene signature using the Connectivity-map 2.0. [Dataset]. http://doi.org/10.1371/journal.pone.0015195.t001xlsAvailable download formatsUnique identifierhttps://doi.org/10.1371/journal.pone.0015195.t001Dataset updatedMay 31, 2023AuthorsChiara Braconi; Erica Swenson; Takayuki Kogure; Nianyuan Huang; Tushar PatelLicenseAttribution 4.0 (CC BY 4.0)https://creativecommons.org/licenses/by/4.0/
License information was derived automaticallyDescriptionThe highest connectivity score recorded, arithmetic mean of the scores for all the instances in the database, measure of enrichment of those instances related to each agent and a p-value for the enrichment are listed.
- c
Terrestrial Connectivity - ACE [ds2734] GIS Dataset
- map.dfg.ca.gov
Updated Mar 13, 2024 - f
Table_1_Master Regulators Connectivity Map: A Transcription Factors-Centered...
- frontiersin.figshare.com
docxUpdated Jun 9, 2023ShareFacebookTwitterEmailClick to copy linkLink copiedCiteMarco A. De Bastiani; Bianca Pfaffenseller; Fabio Klamt (2023). Table_1_Master Regulators Connectivity Map: A Transcription Factors-Centered Approach to Drug Repositioning.DOCX [Dataset]. http://doi.org/10.3389/fphar.2018.00697.s002docxAvailable download formatsUnique identifierhttps://doi.org/10.3389/fphar.2018.00697.s002Dataset updatedJun 9, 2023Dataset provided byFrontiersAuthorsMarco A. De Bastiani; Bianca Pfaffenseller; Fabio KlamtLicenseAttribution 4.0 (CC BY 4.0)https://creativecommons.org/licenses/by/4.0/
License information was derived automaticallyDescriptionDrug discovery is a very expensive and time-consuming endeavor. Fortunately, recent omics technologies and Systems Biology approaches introduced interesting new tools to achieve this task, facilitating the repurposing of already known drugs to new therapeutic assignments using gene expression data and bioinformatics. The inherent role of transcription factors in gene expression modulation makes them strong candidates for master regulators of phenotypic transitions. However, transcription factors expression itself usually does not reflect its activity changes due to post-transcriptional modifications and other complications. In this aspect, the use of high-throughput transcriptomic data may be employed to infer transcription factors-targets interactions and assess their activity through co-expression networks, which can be further used to search for drugs capable of reverting the gene expression profile of pathological phenotypes employing the connectivity maps paradigm. Following this idea, we argue that a module-oriented connectivity map approach using transcription factors-centered networks would aid the query for new repositioning candidates. Through a brief case study, we explored this idea in bipolar disorder, retrieving known drugs used in the usual clinical scenario as well as new candidates with potential therapeutic application in this disease. Indeed, the results of the case study indicate just how promising our approach may be to drug repositioning.
Evaluation of RNAi and CRISPR technologies by large-scale gene expression...
- plos.figshare.com
pdfUpdated May 30, 2023ShareFacebookTwitterEmailClick to copy linkLink copiedCiteIan Smith; Peyton G. Greenside; Ted Natoli; David L. Lahr; David Wadden; Itay Tirosh; Rajiv Narayan; David E. Root; Todd R. Golub; Aravind Subramanian; John G. Doench (2023). Evaluation of RNAi and CRISPR technologies by large-scale gene expression profiling in the Connectivity Map [Dataset]. http://doi.org/10.1371/journal.pbio.2003213pdfAvailable download formatsUnique identifierhttps://doi.org/10.1371/journal.pbio.2003213Dataset updatedMay 30, 2023AuthorsIan Smith; Peyton G. Greenside; Ted Natoli; David L. Lahr; David Wadden; Itay Tirosh; Rajiv Narayan; David E. Root; Todd R. Golub; Aravind Subramanian; John G. DoenchLicenseAttribution 4.0 (CC BY 4.0)https://creativecommons.org/licenses/by/4.0/
License information was derived automaticallyDescriptionThe application of RNA interference (RNAi) to mammalian cells has provided the means to perform phenotypic screens to determine the functions of genes. Although RNAi has revolutionized loss-of-function genetic experiments, it has been difficult to systematically assess the prevalence and consequences of off-target effects. The Connectivity Map (CMAP) represents an unprecedented resource to study the gene expression consequences of expressing short hairpin RNAs (shRNAs). Analysis of signatures for over 13,000 shRNAs applied in 9 cell lines revealed that microRNA (miRNA)-like off-target effects of RNAi are far stronger and more pervasive than generally appreciated. We show that mitigating off-target effects is feasible in these datasets via computational methodologies to produce a consensus gene signature (CGS). In addition, we compared RNAi technology to clustered regularly interspaced short palindromic repeat (CRISPR)-based knockout by analysis of 373 single guide RNAs (sgRNAs) in 6 cells lines and show that the on-target efficacies are comparable, but CRISPR technology is far less susceptible to systematic off-target effects. These results will help guide the proper use and analysis of loss-of-function reagents for the determination of gene function.
Essential Connectivity Areas - California Essential Habitat Connectivity...
- data.ca.gov
- data.cnra.ca.gov
- +3more
Updated Dec 14, 2023ShareFacebookTwitterEmailClick to copy linkLink copiedCiteCalifornia Department of Fish and Wildlife (2023). Essential Connectivity Areas - California Essential Habitat Connectivity (CEHC) [ds620] [Dataset]. https://data.ca.gov/dataset/essential-connectivity-areas-california-essential-habitat-connectivity-cehc-ds620arcgis geoservices rest api, html, zipAvailable download formatsDataset updatedDec 14, 2023LicenseAttribution 4.0 (CC BY 4.0)https://creativecommons.org/licenses/by/4.0/
License information was derived automaticallyArea coveredCaliforniaDescriptionThe California Department of Transportation (Caltrans) and California Department of Fish and Game (CDFG) commissioned the California Essential Habitat Connectivity Project because a functional network of connected wildlands is essential to the continued support of Californias diverse natural communities in the face of human development and climate change. The Essential Connectivity Map depicts large, relatively natural habitat blocks that support native biodiversity (Natural Landscape Blocks) and areas essential for ecological connectivity between them (Essential Connectivity Areas). This coarse-scale map was based primarily on the concept of ecological integrity, rather than the needs of particular species. Essential Connectivity Areas are placeholder polygons that can inform land-planning efforts, but that should eventually be replaced by more detailed Linkage Designs, developed at finer resolution based on the needs of particular species and ecological processes. It is important to recognize that even areas outside of Natural Landscape Blocks and Essential Connectivity Areas support important ecological values that should not be "written off" as lacking conservation value. Furthermore, because the Essential Habitat Connectivity Map was created at the statewide scale, based on available statewide data layers, and ignored Natural Landscape Blocks smaller than 2,000 acres squared, it has errors of omission that should be addressed at regional and local scales.
Natural Areas Small - California Essential Habitat Connectivity (CEHC)...
- data.ca.gov
- data.cnra.ca.gov
- +4more
Updated Feb 6, 2025+ more versionsShareFacebookTwitterEmailClick to copy linkLink copiedCiteCalifornia Department of Fish and Wildlife (2025). Natural Areas Small - California Essential Habitat Connectivity (CEHC) [ds1073] [Dataset]. https://data.ca.gov/dataset/natural-areas-small-california-essential-habitat-connectivity-cehc-ds1073arcgis geoservices rest api, zip, csv, kml, geojson, htmlAvailable download formatsDataset updatedFeb 6, 2025LicenseAttribution 4.0 (CC BY 4.0)https://creativecommons.org/licenses/by/4.0/
License information was derived automaticallyArea coveredCaliforniaDescriptionThe California Department of Transportation (Caltrans) and California Department of Fish and Game (CDFG) commissioned the California Essential Habitat Connectivity Project because a functional network of connected wildlands is essential to the continued support of California's diverse natural communities in the face of human development and climate change. The Essential Connectivity Map depicts large, relatively natural habitat blocks that support native biodiversity (Natural Landscape Blocks) and areas essential for ecological connectivity between them (Essential Connectivity Areas). This coarse-scale map was based primarily on the concept of ecological integrity, rather than the needs of particular species. Essential Connectivity Areas are placeholder polygons that can inform land-planning efforts, but that should eventually be replaced by more detailed Linkage Designs, developed at finer resolution based on the needs of particular species and ecological processes. It is important to recognize that even areas outside of Natural Landscape Blocks and Essential Connectivity Areas support important ecological values that should not be "written off" as lacking conservation value. Furthermore, because the Essential Habitat Connectivity Map was created at the statewide scale, based on available statewide data layers, and ignored Natural Landscape Blocks smaller than 2,000 acres squared, it has errors of omission that should be addressed at regional and local scales.
- r
National Institute of Mental Health (NIMH) Human Genetics Initiative
- rrid.site
- scicrunch.org
Updated Jan 29, 2022ShareFacebookTwitterEmailClick to copy linkLink copiedCite(2022). National Institute of Mental Health (NIMH) Human Genetics Initiative [Dataset]. http://identifiers.org/RRID:SCR_007436Unique identifierhttps://identifiers.org/RRID:SCR_007436Dataset updatedJan 29, 2022DescriptionThe Connectivity Map aims to generate a detailed map that links gene patterns associated with disease to corresponding patterns produced by drug candidates and a variety of genetic manipulations. The Connectivity Map is the most comprehensive effort yet for using genomics in a drug-discovery framework. It allows researchers to screen compounds against genome-wide disease signatures, rather than a pre-selected set of target genes. Drugs are paired with diseases using sophisticated pattern-matching methods with a high level of resolution and specificity. To build a Connectivity Map, the Broad Institute brings together molecular biologists, genomics specialists, computational scientists, pharmacologists, chemists and chemical biologists, as well as expertise from across the breadth and depth of medicine.Connectivity map is a large public database of signatures of drugs and genes, and pattern-matching tools to detect similarities among these signatures.The parent site for the Broad Institute at MIT has a software library of software applications developed for use in genetic analysis.
- o
Analysis of differentially expressed genes in placental tissues of...
- omicsdi.org
xmlShareFacebookTwitterEmailClick to copy linkLink copiedCiteJuntao Liu,wang liang,Saiqiong Huang,Yingna Song,Liang Zhang, Analysis of differentially expressed genes in placental tissues of Pre-eclampsia Using microarray combined with Connectivity Map database [Dataset]. https://www.omicsdi.org/dataset/arrayexpress-repository/E-GEOD-47187xmlAvailable download formatsAuthorsJuntao Liu,wang liang,Saiqiong Huang,Yingna Song,Liang ZhangVariables measuredTranscriptomicsDescriptionPreeclampsia (PE), which affects 2-7% of human pregnancies, causes significant maternal and neonatal morbidity and mortality. To better understand the pathophysiology of PE, gene expression profiling of placental tissue from 5 controls and 5 PEs were assessed using microarray. A total of 224 transcripts were identified as being significantly differentially expressed (fold change > 2 and q value < 0.05 in the SAM software), GO enrichment analysis indicated that genes involved hypoxia, oxidative and reductive processes were significantly changed. Ten differentially expressed genes (DEGs) involved in these biological process were further verified by quantitative real-time PCR. Finally, the potential therapeutic agents for PE were explored via Connectivity Map database . In conclusion, the data obtained in this study might provide clues to better understand the pathophysiology of PE and found potential therapeutic agents for PE patients. gene expression profiling of placental tissue from 5 controls and 5 PEs were assessed using microarray.
- m
CDCM: A Correlation-Dependent Connectivity Map approach to rapidly screen...
- data.mendeley.com
Updated Oct 31, 2023ShareFacebookTwitterEmailClick to copy linkLink copiedCiteJunlei Liao (2023). CDCM: A Correlation-Dependent Connectivity Map approach to rapidly screen drugs for the outbreak of public infectious diseases including COVID-19 [Dataset]. http://doi.org/10.17632/tsk7dxrd23.1Unique identifierhttps://doi.org/10.17632/tsk7dxrd23.1Dataset updatedOct 31, 2023AuthorsJunlei LiaoLicenseAttribution 4.0 (CC BY 4.0)https://creativecommons.org/licenses/by/4.0/
License information was derived automaticallyDescriptionThe main signature and reference database calculation and score calculation codes of the CDCM method.
- a
Access Network Mapping (England)
- naturalengland-defra.opendata.arcgis.com
- data.catchmentbasedapproach.org
- +3more
Updated Dec 12, 2016ShareFacebookTwitterEmailClick to copy linkLink copiedCiteDefra group ArcGIS Online organisation (2016). Access Network Mapping (England) [Dataset]. https://naturalengland-defra.opendata.arcgis.com/datasets/access-network-mapping-englandDataset updatedDec 12, 2016Dataset authored and provided byDefra group ArcGIS Online organisationArea coveredDescriptionThe Access Network Map of England is a national composite dataset of Access layers, showing analysis of extent of Access provision for each Lower Super Output Area (LSOA), as a percentage or area coverage of access in England. The ‘Access Network Map’ was developed by Natural England to inform its work to improve opportunities for people to enjoy the natural environment. This map shows, across England, the relative abundance of accessible land in relation to where people live. Due to issues explained below, the map does not, and cannot, provide a definitive statement of where intervention is necessary. Rather, it should be used to identify areas of interest which require further exploration. Natural England believes that places where people can enjoy the natural environment should be improved and created where they are most wanted. Access Network Maps help support this work by providing means to assess the amount of accessible land available in relation to where people live. They combine all the available good quality data on access provision into a single dataset and relate this to population. This provides a common foundation for regional and national teams to use when targeting resources to improve public access to greenspace, or projects that rely on this resource. The Access Network Maps are compiled from the datasets available to Natural England which contain robust, nationally consistent data on land and routes that are normally available to the public and are free of charge. Datasets contained in the aggregated data:•
Agri-environment scheme permissive access (routes and open access)•
CROW access land (including registered common land and Section 16)•
Country Parks•
Cycleways (Sustrans Routes) including Local/Regional/National and Link Routes•
Doorstep Greens•
Local Nature Reserves•
Millennium Greens•
National Nature Reserves (accessible sites only)•
National Trails•
Public Rights of Way•
Forestry Commission ‘Woods for People’ data•
Village Greens – point data only Due to the quantity and complexity of data used, it is not possible to display clearly on a single map the precise boundary of accessible land for all areas. We therefore selected a unit which would be clearly visible at a variety of scales and calculated the total area (in hectares) of accessible land in each. The units we selected are ‘Lower Super Output Areas’ (LSOAs), which represent where approximately 1,500 people live based on postcode. To calculate the total area of accessible land for each we gave the linear routes a notional width of 3 metres so they could be measured in hectares. We then combined together all the datasets and calculated the total hectares of accessible land in each LSOA. For further information about this data see the following links:Access Network Mapping GuidanceAccess Network Mapping Metadata Full metadata can be viewed on data.gov.uk. - b
Network Map
- dbarchive.biosciencedbc.jp
Updated Aug 8, 2020+ more versionsShareFacebookTwitterEmailClick to copy linkLink copiedCite(2020). Network Map [Dataset]. http://doi.org/10.18908/lsdba.nbdc01185-006.V006Unique identifierhttps://doi.org/10.18908/lsdba.nbdc01185-006.V006Dataset updatedAug 8, 2020DescriptionKEGG NETWORK is a database to capture knowledge of diseases and drugs in terms of perturbed molecular networks. It accumulates variations of molecular interaction/reaction networks in terms of "network variation maps" consisting of "network elements". Each map is identified by the nt number. In this archive, "Network" is divided into another data.
- N
Multimodal connectivity mapping of the human left anterior and posterior...
- neurovault.org
niftiUpdated Jun 30, 2018+ more versionsShareFacebookTwitterEmailClick to copy linkLink copiedCite(2018). Multimodal connectivity mapping of the human left anterior and posterior lateral prefrontal cortex: Figure 3F [Dataset]. http://identifiers.org/neurovault.image:12180niftiAvailable download formatsUnique identifierhttps://identifiers.org/neurovault.image:12180Dataset updatedJun 30, 2018LicenseCC0 1.0 Universal Public Domain Dedicationhttps://creativecommons.org/publicdomain/zero/1.0/
License information was derived automaticallyDescriptionConjunction of task-load WM network with the pLPFC conjunction of Figure 2G (task-load ∩ MACM ∩ RS-FC ∩ SC)
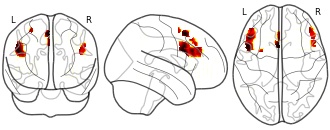
Collection description
In this study, we investigated the connectivity of the anterior and posterior parts of the lateral prefrontal cortex (LPFC). We estimated connectivity using three separate approaches: resting-state BOLD covariance, structural covariance based on cortical thickness, and meta-analytic connectivity modelling (MACM). We found a distinct overlap of all measures, more strongly for aLPFC, with working memory networks defined in a previous study, and a contrast between resting state aLPFC and pLPFC activation that is consistent with the idea of a hierarchical organization of frontoparietal networks. We also found significant anti-correlations of these seed region, with aLPFC but not pLPFC showing a substantial overlap with networks previously associated with social and emotional processing. This dataset was automatically imported from the ANIMA <http://anima.modelgui.org/> database. Version: 1
Subject species
homo sapiens
Modality
fMRI-BOLD
Analysis level
meta-analysis
Cognitive paradigm (task)
None / Other
Map type
Other
- d
Mississippi Alluvial Plain (MAP): Surface Confining Layer & Connectivity
- catalog.data.gov
- data.usgs.gov
- +2more
Updated Jul 27, 2024+ more versionsShareFacebookTwitterEmailClick to copy linkLink copiedCiteU.S. Geological Survey (2024). Mississippi Alluvial Plain (MAP): Surface Confining Layer & Connectivity [Dataset]. https://catalog.data.gov/dataset/mississippi-alluvial-plain-map-surface-confining-layer-amp-connectivityDataset updatedJul 27, 2024Area coveredMississippi River Alluvial PlainDescriptionElectrical resistivity results from four regional airborne electromagnetic (AEM) surveys (Burton et al. 2024, Hoogenboom et al. 2023, Minsley et al. 2021, Burton et al. 2021) over the Mississippi Alluvial Plain (MAP) were combined by the U.S. Geological Survey (USGS) to produce three-dimensional (3D) gridded models and derivative hydrogeologic products. The 3D elevation grid was used to quantify across the MAP region 1) the occurrence and thickness of surficial (< 15 meter (m) depth) confining material, 2) the top and bottom elevation corresponding to the surficial confining material, and 3) a metric representing the degree of surface confinement or connectivity that ranges from fully confining conditions to high potential hydrologic connectivity. These products were generated using the updated 12-class facies classifications of the 3D electrical resistivity model. See child item “Mississippi Alluvial Plain (MAP): Electrical Resistivity & Facies Classification Grids” for more details on the facies classes: https://www.sciencebase.gov/catalog/item/5f03a7bc82ce0afb2446e11f. The final surfaces and hydrogeologic metrics were exported as raster images in Georeferenced Tagged Image File Format (GeoTIFF) format. Burton, B.L., Adams, R.F. Adams, Minsley, B.J., Pace, M.D.M., Kress, W.H., Rigby, J.R., and Bussell, A.M., 2024, Airborne electromagnetic, magnetic, and radiometric survey of the Mississippi Alluvial Plain, March 2018 and May - August 2021: U.S. Geological Survey data release, https://doi.org/10.5066/P9KPK3UJ. Hoogenboom, B.E., Minsley, B.J., James, S.R., and Pace, M.D., 2023, Airborne electromagnetic, magnetic, and radiometric survey of the Mississippi Alluvial Plain, Mississippi Embayment, and Gulf Coastal Plain, September 2021 - January 2022: U.S. Geological Survey data release, https://doi.org/10.5066/P93DO0EO. Burton, B.L., Minsley, B.J., Bloss, B.R., and Kress, W.H., 2021, Airborne electromagnetic, magnetic, and radiometric survey of the Mississippi Alluvial Plain, November 2018 - February 2019: U.S. Geological Survey data release, https://doi.org/10.5066/P9XBBBUU. Minsley, B.J., James, S.R., Bedrosian, P.A., Pace, M.D., Hoogenboom, B.E., and Burton, B.L., 2021, Airborne electromagnetic, magnetic, and radiometric survey of the Mississippi Alluvial Plain, November 2019 - March 2020: U.S. Geological Survey data release, https://doi.org/10.5066/P9E44CTQ.
- N
Multimodal connectivity mapping of the human left anterior and posterior...
- neurovault.org
niftiUpdated Jun 30, 2018+ more versionsShareFacebookTwitterEmailClick to copy linkLink copiedCite(2018). Multimodal connectivity mapping of the human left anterior and posterior lateral prefrontal cortex: Figure 5C [Dataset]. http://identifiers.org/neurovault.image:12181niftiAvailable download formatsUnique identifierhttps://identifiers.org/neurovault.image:12181Dataset updatedJun 30, 2018LicenseCC0 1.0 Universal Public Domain Dedicationhttps://creativecommons.org/publicdomain/zero/1.0/
License information was derived automaticallyDescriptionResting-state BOLD anti-correlations for aLPFC
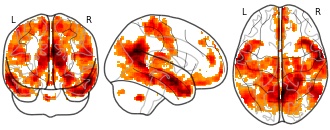
Collection description
In this study, we investigated the connectivity of the anterior and posterior parts of the lateral prefrontal cortex (LPFC). We estimated connectivity using three separate approaches: resting-state BOLD covariance, structural covariance based on cortical thickness, and meta-analytic connectivity modelling (MACM). We found a distinct overlap of all measures, more strongly for aLPFC, with working memory networks defined in a previous study, and a contrast between resting state aLPFC and pLPFC activation that is consistent with the idea of a hierarchical organization of frontoparietal networks. We also found significant anti-correlations of these seed region, with aLPFC but not pLPFC showing a substantial overlap with networks previously associated with social and emotional processing. This dataset was automatically imported from the ANIMA <http://anima.modelgui.org/> database. Version: 1
Subject species
homo sapiens
Modality
fMRI-BOLD
Analysis level
meta-analysis
Cognitive paradigm (task)
None / Other
Map type
T
FacebookTwitterCMap
RRID:SCR_016204, biotools:CMap, CMap (RRID:SCR_016204), LINCS CMap L1000, LINCS L1000, LINCS CMap, ConnectivityMap, Connectivity Map
Dataset of cellular signatures that catalogs transcriptional responses of human cells to chemical and genetic perturbation. CMap contains perturbagens, expression signatures, and small molecules from cell lines.