- e
Borough Council Election Results 2014
- data.europa.eu
excel xls, pdfUpdated Dec 1, 2014+ more versions Share
Share Facebook
 Twitter
 EmailClick to copy linkLink copiedCiteGreater London Authority (2014). Borough Council Election Results 2014 [Dataset]. https://data.europa.eu/data/datasets/borough-council-election-results-2014excel xls, pdfAvailable download formatsDataset updatedDec 1, 2014Dataset authored and provided byGreater London AuthorityDescription
This report includes a great deal of detail on every aspect of the 2014 London Borough council general elections. No other single volume presents the full results and election statistics from the 32 London boroughs enabling the reader to analyse and compare the results across London in one place. The report presents data for every candidate in every ward (excluding the City of London which operates on a different electoral model). The report also contains analysis of the European election results for London that took place on the same day.
Printed Copies We are able to accept orders for hard copies £30. Click here for further details.
Details of all previous elections reports in the series can be found here.
Summary results of the 2014 local elections in London, showing number and percentage of seats won, turnout and political control.
Final 2014 ward results
These results show the number of votes for each candidate in each ward in London. Turnout, number of ballots, postal votes, and breakdown of rejected votes, Mayoral and European voting figures are also included where available.
Map showing political control in each ward.
https://londondatastore-upload.s3.amazonaws.com/images/London-ward-map-borough-election-2014-new-colours-small.png" alt="">
Also, using these ward results, Oliver O'Brien from CASA has created some eye catching interactive ward maps.
The borough map shows the summary results in both the 2010 and 2014 elections.
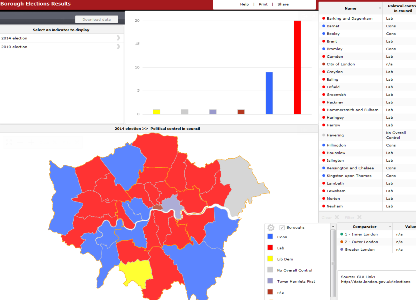
The ward interactive map shows the detailed results for each candidate at ward level for the last three elections between 2006 and 2014.

This motion chart shows the relationship, between share of votes and seats won by the major parties in elections since 1964 at borough level (requires Adobe Flash Player).
 )
) - e
Ward Maps
- data.europa.eu
- ckan.publishing.service.gov.uk
Updated Apr 24, 2023+ more versionsShareFacebookTwitterEmailClick to copy linkLink copiedCiteLondon Borough of Barnet (2023). Ward Maps [Dataset]. https://data.europa.eu/data/datasets/ward-maps?locale=enDataset updatedApr 24, 2023Dataset authored and provided byLondon Borough of BarnetDescriptionThe London Borough of Barnet is divided into 24 electoral Wards. The current warding arrangement came into effect on 5th May 2022. These maps have been created as general resource for the council. The information is sourced from Ordnance Survey Open Data products and may be used more widely subject to the Open Government Licence (v3). Each ward map is available in 2 different sizes, in pdf format and includes an approximate scale and information currency.
Ward boundary information is from OS Boundary-Line™ (normally released in May and October) The A3 base map information is from OS OpenMap - Local (normally released in April and October) The A4 base map information is from OS VectorMap District (normally released in May and November)
Only the latest version of the maps are published and older versions are not retained. Please note: these maps may not reflect the latest information published by Ordnance Survey, see document dates for date last updated.
V1 and V2 impact sites in London
- zenodo.org
bin, csvUpdated Feb 17, 2025ShareFacebookTwitterEmailClick to copy linkLink copiedCiteLiam Shaw; Liam Shaw (2025). V1 and V2 impact sites in London [Dataset]. http://doi.org/10.5281/zenodo.14882696csv, binAvailable download formatsUnique identifierhttps://doi.org/10.5281/zenodo.14882696Dataset updatedFeb 17, 2025AuthorsLiam Shaw; Liam ShawLicenseAttribution 4.0 (CC BY 4.0)https://creativecommons.org/licenses/by/4.0/
License information was derived automaticallyArea coveredLondonDescriptionThe V1 ('flying bomb' or 'doodlebug') and V2 (a ballistic missile) were two new weapons developed by Nazi Germany. In 1944 and 1945 thousands were fired at London. They killed thousands of people and injured many more.
This dataset includes all impact sites for V1s and V2s within the London County Council boundary. These were manually compiled from bomb maps published in 'The London County Council Bomb Damage Maps 1939-1945' by Laurence Ward (Thames and Hudson, 2015). The original LCC Bomb Damage maps are held at the London Archives.
**Please note that this is not a comprehensive dataset of all V1s and V2s. Only those within the London County Council boundary are included.**
File Explanation bomb_map.kml Map layer downloaded from Google Maps in Keyhole Markup Language (KML) formatdata-conversion.R Script used to convert the KML file to tables of impacts. V1-impacts.csv Locations of V1 impact sites with page number (in Ward 2015), longitude, latitude, easting, northing. V2-impacts.csv Locations of V2 impact sites with page number (in Ward 2015), longitude, latitude, easting, northing. We previously analysed this dataset in 'The flying bomb and the actuary', Significance (2019). doi: 10.1111/j.1740-9713.2019.01315.x
The impact sites can also be viewed as a layer on Google Maps. Data is separated into two layers: V1 sites and V2 sites. Each point represents an impact site, with the closest street name (to help with possible cross-reference) and page number in the LCC Bomb Damage Maps: https://www.google.com/maps/d/viewer?mid=1VwyxV_e_LAwzbyJPCAF-C7aCRVNA5W7N&ll=51.509018493447314%2C-0.05324588962980492&z=14
Natural Capital County Atlas Mapping (England) - Dataset - data.gov.uk
- ckan.publishing.service.gov.uk
Updated Oct 10, 2020+ more versionsShareFacebookTwitterEmailClick to copy linkLink copiedCiteckan.publishing.service.gov.uk (2020). Natural Capital County Atlas Mapping (England) - Dataset - data.gov.uk [Dataset]. https://ckan.publishing.service.gov.uk/dataset/natural-capital-county-atlas-mapping-englandDataset updatedOct 10, 2020Area coveredEnglandDescriptionThis spatial dataset is an output of the Natural England County & City Natural Capital Atlas project (July 2020). It shows variation in ecosystem service flow for habitats across England, based on indicators identified by NE in the 2018 Natural Capital Indicators project. The dataset comprises a hexagonal grid which summarises indicator values across the country (each unit = 5km²). Natural Capital is an important aspect of current environmental policy and management. This dataset, in combination with the other project outputs, will support understanding of Natural Capital in England and serve as a valuable engagement tool to communicate concepts of the Natural Capital approach to a wide variety of stakeholders. For full methodology and user guide see documents ‘NCAtlas_Devon’ and ‘NC-Mapping-User-Guidance’ at http://publications.naturalengland.org.uk/publication/6672365834731520. For full metadata documentation see the data package download below. Copyright statement: LCM2015 © NERC (CEH) 2011. Contains Ordnance Survey data © Crown Copyright 2007. © Defra. Contains Defra information © Defra - Project MB0102. © Environment Agency. © Forestry Commission. © Historic England [year]. © Joint Nature Conservation Committee. © Natural England copyright. Contains Ordnance Survey data © Crown copyright and database right [year]. Contains data supplied by © NERC - Centre for Ecology & Hydrology. © Natural England copyright. Natural England Licence No. 2011/052 British Geological Survey © NERC, all rights reserved, © NSRI Cranfield University. Contains National Statistics data © Crown copyright and database right [year]. Contains Ordnance Survey data © Crown copyright and database right [year]. Contains Rural Payments Agency. © Barnsley Metropolitan Borough Council. © Bath & North East Somerset Council. © Bedford Borough Council. © London Borough of Bexley. © Birmingham City Council. © Blackburn with Darwen Borough Council. © Blackpool Council. © Bolton Council. © BCP Council. © Bracknell Forest Council. © City of Bradford Metropolitan District Council. © Brighton & Hove City Council. © Bristol City Council. © London Borough of Bromley. © Buckinghamshire County Council. © Bury Council. © Calderdale Council. © Cambridgeshire County Council. © Central Bedfordshire Council. © Cheshire East Council. © Cheshire West and Chester Council. © Cornwall Council. © Cumbria County Council. © Derbyshire County Council. © Devon County Council. © Doncaster Council. © Dorset Council. © Dudley Metropolitan Borough Council. © Durham County Council. © East Riding of Yorkshire Council. © East Sussex County Council. © Essex County Council. © Gateshead Council. © Gloucestershire County Council. © Hampshire County Council. © Herefordshire Council. © Hertfordshire County Council. © Hull City Council. © Isle of Anglesey County Council. © Isle of Wight Council. © Kent County Council. © Kirklees Council. © Knowsley Metropolitan Borough Council. © Lake District National Park. © Lancashire County Council. © Leicester City Council. © Leicestershire County Council. © Lincolnshire County Council. © Manchester City Council. © Medway Council. © Norfolk County Council. © North Lincolnshire Council. © North Somerset Council. © North Yorkshire County Council. © Northamptonshire County Council. © Northumberland County Council. © Nottingham City Council. © Nottinghamshire County Council. © Oldham Council. © Oxfordshire County Council. © Peterborough City Council. © Plymouth City Council. © Bournemouth, Christchurch and Poole Council. © Portsmouth City Council. © Reading Borough Council. © Redcar and Cleveland Borough Council. © Rochdale Borough Council. © Rotherham Metropolitan Borough Council. © Rutland County Council. © Salford City Council. © Sefton Council. © Sheffield City Council. © Shropshire Council. © Slough Borough Council. © Somerset County Council. © South Gloucestershire Council. © Southampton City Council. © St Helens Council. © Staffordshire County Council. © Stockport Metropolitan Borough Council. © Stockton Council. © Suffolk County Council. © Surrey County Council. © Tameside Metropolitan Borough Council. © Thurrock Council. © Torbay Council. © Trafford Council. © Wakefield Council. © Walsall Council. © Warrington Borough Council. © Warwickshire County Council. © West Berkshire Council. © West Sussex County Council. © Wigan Council. © Wiltshire Council. © Royal Borough of Windsor and Maidenhead Council. © Wirral Council. © Wokingham Borough Council. © Worcestershire County Council. © City of York Council. Attribution statement: © Natural England copyright. Contains Ordnance Survey data © Crown copyright and database right [year].
- w
Opportunity Areas
- data.wu.ac.at
- data.europa.eu
html, wmsUpdated Feb 10, 2016ShareFacebookTwitterEmailClick to copy linkLink copiedCiteSouthwark London Borough Council (2016). Opportunity Areas [Dataset]. https://data.wu.ac.at/schema/data_gov_uk/NjNlZTMzMTYtYjIyYS00ZWRmLTgyMzEtNjY4ZGU5Y2IxZGZmhtml, wmsAvailable download formatsDataset updatedFeb 10, 2016Dataset provided bySouthwark London Borough CouncilArea coveredd6ea1de7c9e541699e5fc63eb55ab1c79751fdecDescriptionOpportunity areas or zones mapped as part of the Authority’s Local Development Framework
- U
2011 Census Geography boundaries (Wards and Electoral Divisions)
- statistics.ukdataservice.ac.uk
zipUpdated Sep 20, 2022ShareFacebookTwitterEmailClick to copy linkLink copiedCiteBoundary (2022). 2011 Census Geography boundaries (Wards and Electoral Divisions) [Dataset]. https://statistics.ukdataservice.ac.uk/dataset/2011-census-geography-boundaries-wards-and-electoral-divisionszipAvailable download formatsDataset updatedSep 20, 2022Dataset authored and provided byBoundaryLicenseOpen Government Licence 3.0http://www.nationalarchives.gov.uk/doc/open-government-licence/version/3/
License information was derived automaticallyDescriptionElectoral Wards/Divisions are the key building blocks of UK administrative geography. They are the spatial units used to elect local government councillors in metropolitan and non-metropolitan districts, unitary authorities and the London boroughs in England; unitary authorities in Wales; council areas in Scotland; and district council areas in Northern Ireland.
The Wards and Electoral Divisions list contains 9,481 areas of the following constituent geographies:
- 7,218 Census Wards in England
- 453 Census Electoral Divisions in England
- 7 Census Merged Wards in England
- 582 Census Wards in Northern Ireland
- 353 Census Wards in Scotland
- 856 Census Electoral Divisions in Wales
- 12 Census Merged Wards in Wales
Please visit ONS Beginner's Guide to UK Geography for more info.
The boundaries are available as either extent of the realm (usually this is the Mean Low Water mark but in some cases boundaries extend beyond this to include off shore islands) or
clipped to the coastline (Mean High Water mark).
- a
Borough Boundary
- lambethopenmappingdata-lambethcouncil.opendata.arcgis.com
Updated Dec 16, 2020ShareFacebookTwitterEmailClick to copy linkLink copiedCitelondon borough of lambeth (2020). Borough Boundary [Dataset]. https://lambethopenmappingdata-lambethcouncil.opendata.arcgis.com/datasets/borough-boundary-1Dataset updatedDec 16, 2020Dataset authored and provided bylondon borough of lambethArea coveredDescriptionshowing boundary of lambeth council

Not seeing a result you expected?
Learn how you can add new datasets to our index.
FacebookTwitterBorough Council Election Results 2014
This report includes a great deal of detail on every aspect of the 2014 London Borough council general elections. No other single volume presents the full results and election statistics from the 32 London boroughs enabling the reader to analyse and compare the results across London in one place. The report presents data for every candidate in every ward (excluding the City of London which operates on a different electoral model). The report also contains analysis of the European election results for London that took place on the same day.
Printed Copies We are able to accept orders for hard copies £30. Click here for further details.
Details of all previous elections reports in the series can be found here.
Summary results of the 2014 local elections in London, showing number and percentage of seats won, turnout and political control.
Final 2014 ward results
These results show the number of votes for each candidate in each ward in London. Turnout, number of ballots, postal votes, and breakdown of rejected votes, Mayoral and European voting figures are also included where available.
Map showing political control in each ward.
https://londondatastore-upload.s3.amazonaws.com/images/London-ward-map-borough-election-2014-new-colours-small.png" alt="">
Also, using these ward results, Oliver O'Brien from CASA has created some eye catching interactive ward maps.
The borough map shows the summary results in both the 2010 and 2014 elections.
The ward interactive map shows the detailed results for each candidate at ward level for the last three elections between 2006 and 2014.
This motion chart shows the relationship, between share of votes and seats won by the major parties in elections since 1964 at borough level (requires Adobe Flash Player). )