- h
Indices-Daily-Price
- huggingface.co
Updated May 29, 2024 Share
Share Facebook
 Twitter
 EmailClick to copy linkLink copiedCitePapers With Backtest (2024). Indices-Daily-Price [Dataset]. https://huggingface.co/datasets/paperswithbacktest/Indices-Daily-PriceDataset updatedMay 29, 2024Dataset authored and provided byPapers With BacktestLicense
https://choosealicense.com/licenses/other/https://choosealicense.com/licenses/other/
DescriptionDataset Information
This dataset includes daily price data for various stock indices.
Instruments IncludedADSMI: United Arab Emirates Stock Market (ADX General) - United Arab Emirates AEX: Netherlands Stock Market (AEX) - Netherlands (NL) AS30: Australian All - Australia (AU) AS51: Australia S&P/ASX 200 Stock Market Index - Australia (AU) AS52: ASX 50 - Australia (AU) ASE: Greece Stock Market (ASE) - Greece (GR) ATX: Austria Stock Market (ATX) - Austria (AT) BEL20:… See the full description on the dataset page: https://huggingface.co/datasets/paperswithbacktest/Indices-Daily-Price.
34-year Daily Stock Data (1990-2024)
- kaggle.com
Updated Dec 10, 2024ShareFacebookTwitterEmailClick to copy linkLink copiedCiteShivesh Prakash (2024). 34-year Daily Stock Data (1990-2024) [Dataset]. https://www.kaggle.com/datasets/shiveshprakash/34-year-daily-stock-dataCroissantCroissant is a format for machine-learning datasets. Learn more about this at mlcommons.org/croissant.Dataset updatedDec 10, 2024AuthorsShivesh PrakashLicenseMIT Licensehttps://opensource.org/licenses/MIT
License information was derived automaticallyDescriptionDataset Description: 34-year Daily Stock Data (1990-2024)
Context and Inspiration
This dataset captures historical financial market data and macroeconomic indicators spanning over three decades, from 1990 onwards. It is designed for financial analysis, time series forecasting, and exploring relationships between market volatility, stock indices, and macroeconomic factors. This dataset is particularly relevant for researchers, data scientists, and enthusiasts interested in studying: - Volatility forecasting (VIX) - Stock market trends (S&P 500, DJIA, HSI) - Macroeconomic influences on markets (joblessness, interest rates, etc.) - The effect of geopolitical and economic uncertainty (EPU, GPRD)
Sources
The data has been aggregated from a mix of historical financial records and publicly available macroeconomic datasets: - VIX (Volatility Index): Chicago Board Options Exchange (CBOE). - Stock Indices (S&P 500, DJIA, HSI): Yahoo Finance and historical financial databases. - Volume Data: Extracted from official exchange reports. - Macroeconomic Indicators: Bureau of Economic Analysis (BEA), Federal Reserve, and other public records. - Uncertainty Metrics (EPU, GPRD): Economic Policy Uncertainty Index and Global Policy Uncertainty Database.
Columns
dt: Date of observation in YYYY-MM-DD format.vix: VIX (Volatility Index), a measure of expected market volatility.sp500: S&P 500 index value, a benchmark of the U.S. stock market.sp500_volume: Daily trading volume for the S&P 500.djia: Dow Jones Industrial Average (DJIA), another key U.S. market index.djia_volume: Daily trading volume for the DJIA.hsi: Hang Seng Index, representing the Hong Kong stock market.ads: Aruoba-Diebold-Scotti (ADS) Business Conditions Index, reflecting U.S. economic activity.us3m: U.S. Treasury 3-month bond yield, a short-term interest rate proxy.joblessness: U.S. unemployment rate, reported as quartiles (1 represents lowest quartile and so on).epu: Economic Policy Uncertainty Index, quantifying policy-related economic uncertainty.GPRD: Geopolitical Risk Index (Daily), measuring geopolitical risk levels.prev_day: Previous day’s S&P 500 closing value, added for lag-based time series analysis.
Key Features
- Cross-Market Analysis: Compare U.S. markets (S&P 500, DJIA) with international benchmarks like HSI.
- Macroeconomic Insights: Assess how external factors like joblessness, interest rates, and economic uncertainty affect markets.
- Temporal Scope: Longitudinal data facilitates trend analysis and machine learning model training.
Potential Use Cases
- Forecasting market indices using machine learning or statistical models.
- Building volatility trading strategies with VIX Futures.
- Economic research on relationships between policy uncertainty and market behavior.
- Educational material for financial data visualization and analysis tutorials.
Feel free to use this dataset for academic, research, or personal projects.
- F
S&P 500
- fred.stlouisfed.org
jsonUpdated Sep 9, 2025ShareFacebookTwitterEmailClick to copy linkLink copiedCite(2025). S&P 500 [Dataset]. https://fred.stlouisfed.org/series/SP500jsonAvailable download formatsDataset updatedSep 9, 2025Licensehttps://fred.stlouisfed.org/legal/#copyright-pre-approvalhttps://fred.stlouisfed.org/legal/#copyright-pre-approval
DescriptionView data of the S&P 500, an index of the stocks of 500 leading companies in the US economy, which provides a gauge of the U.S. equity market.
- d
Indices Data | Stock & Bonds Indices | Benchmark | Constituents
- datarade.ai
.xml, .csv, .txtShareFacebookTwitterEmailClick to copy linkLink copiedCiteExchange Data International, Indices Data | Stock & Bonds Indices | Benchmark | Constituents [Dataset]. https://datarade.ai/data-products/edi-index-benchmark-constituents-components-for-over-300-exchange-data-international.xml, .csv, .txtAvailable download formatsDataset authored and provided byExchange Data InternationalArea coveredBulgaria, Iceland, Venezuela (Bolivarian Republic of), Croatia, Korea (Republic of), Egypt, Sweden, Slovenia, Russian Federation, CanadaDescriptionEDI tracks and collects index notifications from a wide range of index providers and covers many financial market indices, including stock and bond indices as well as economic indicators. Components for over 6000 Indices worldwide
Indices Data. The components are updated daily. Historical components lists are available based on legal advice. Index components weighting are not offered.
Using the EDI SFTP Server, you will receive the daily index composition of the indices that you subscribe to. The files are provided as txt.csv or xls format. EDI provides a free coverage check and samples of the index components that are of interest to you.
Monthly Reference CPI Numbers and Daily Index Ratios Table (TIPS/CPI Data)
- datasets.ai
- res1catalogd-o-tdatad-o-tgov.vcapture.xyz
- +2more
21Updated Sep 16, 2024ShareFacebookTwitterEmailClick to copy linkLink copiedCiteDepartment of the Treasury (2024). Monthly Reference CPI Numbers and Daily Index Ratios Table (TIPS/CPI Data) [Dataset]. https://datasets.ai/datasets/monthly-reference-cpi-numbers-and-daily-index-ratios-table-tips-cpi-data21Available download formatsDataset updatedSep 16, 2024AuthorsDepartment of the TreasuryDescriptionTreasury Inflation-Protected Securities, also known as TIPS, are securities whose principal is tied to the Consumer Price Index. With inflation, the principal increases. With deflation, it decreases. When the security matures, the U.S. Treasury pays the original or adjusted principal, whichever is greater.
- F
Dow Jones Industrial Average
- fred.stlouisfed.org
jsonUpdated Sep 10, 2025+ more versionsShareFacebookTwitterEmailClick to copy linkLink copiedCite(2025). Dow Jones Industrial Average [Dataset]. https://fred.stlouisfed.org/series/DJIAjsonAvailable download formatsDataset updatedSep 10, 2025Licensehttps://fred.stlouisfed.org/legal/#copyright-pre-approvalhttps://fred.stlouisfed.org/legal/#copyright-pre-approval
DescriptionGraph and download economic data for Dow Jones Industrial Average (DJIA) from 2015-09-11 to 2025-09-10 about stock market, average, industry, and USA.
Dow Jones 30 Indices at 1-minute resolution
- kaggle.com
Updated Apr 1, 2022ShareFacebookTwitterEmailClick to copy linkLink copiedCiteSJ (2022). Dow Jones 30 Indices at 1-minute resolution [Dataset]. https://www.kaggle.com/datasets/surajjha101/dow-jones-30-index-at-1minute-resolutionCroissantCroissant is a format for machine-learning datasets. Learn more about this at mlcommons.org/croissant.Dataset updatedApr 1, 2022Dataset provided byKaggleAuthorsSJLicenseAttribution-ShareAlike 4.0 (CC BY-SA 4.0)https://creativecommons.org/licenses/by-sa/4.0/
License information was derived automaticallyDescriptionContext
Dow Jones 30 is a price-weighted measurement stock market index of 30 prominent companies listed on stock exchanges in the United States. It is one of the most concise Indices as compared to other comprehensive ones such as NASDAQ or S&P 500.
The value index can be sum of the stock prices of the companies included in the index, divided by a factor which is currently approximately 0.152. The factor is changed whenever a constituent company undergoes a stock split so that the value of the index is unaffected by the stock split.
Content
In the dataset, You'll find stock prices of 16 major companies which are listed in DOW JONES 30 Index before Apr 1, 1999 (Obviously there are 14 others which they've replaced others over time and were added in the index after the said date)
Date: Simply the data in m/d/yyyy format (which works in the US)
MMM to Walt Disney: Average stock price of the day of the corresponding companies
DJIA: "Dow Jones Industrial Average" which can be said the target column of the dataset. It is the pool in which all the 30 stocks have their influence. Target can be seen as how much impact each and every stock lays on the pool.
Acknowledgement
The data is obtained from the Moneycontrol website.
Inspiration
Predicting the influence of major stocks on one of the most weight carrying indices of the world.
- F
NASDAQ Composite Index
- fred.stlouisfed.org
jsonUpdated Sep 10, 2025+ more versionsShareFacebookTwitterEmailClick to copy linkLink copiedCite(2025). NASDAQ Composite Index [Dataset]. https://fred.stlouisfed.org/series/NASDAQCOMjsonAvailable download formatsDataset updatedSep 10, 2025Licensehttps://fred.stlouisfed.org/legal/#copyright-citation-requiredhttps://fred.stlouisfed.org/legal/#copyright-citation-required
DescriptionGraph and download economic data for NASDAQ Composite Index (NASDAQCOM) from 1971-02-05 to 2025-09-09 about composite, NASDAQ, stock market, indexes, and USA.
- T
United States Stock Market Index Data
- tradingeconomics.com
- ar.tradingeconomics.com
- +12more
csv, excel, json, xmlUpdated Sep 11, 2025ShareFacebookTwitterEmailClick to copy linkLink copiedCiteTRADING ECONOMICS (2025). United States Stock Market Index Data [Dataset]. https://tradingeconomics.com/united-states/stock-marketexcel, xml, json, csvAvailable download formatsDataset updatedSep 11, 2025Dataset authored and provided byTRADING ECONOMICSLicenseAttribution 4.0 (CC BY 4.0)https://creativecommons.org/licenses/by/4.0/
License information was derived automaticallyTime period coveredJan 3, 1928 - Sep 11, 2025Area coveredUnited StatesDescriptionThe main stock market index of United States, the US500, rose to 6537 points on September 11, 2025, gaining 0.08% from the previous session. Over the past month, the index has climbed 1.42% and is up 16.82% compared to the same time last year, according to trading on a contract for difference (CFD) that tracks this benchmark index from United States. United States Stock Market Index - values, historical data, forecasts and news - updated on September of 2025.
- i
China and ASEAN-6 daily indices 2010-2021
- ieee-dataport.org
Updated May 18, 2022ShareFacebookTwitterEmailClick to copy linkLink copiedCiteChen Jiusheng (2022). China and ASEAN-6 daily indices 2010-2021 [Dataset]. https://ieee-dataport.org/documents/china-and-asean-6-daily-indices-2010-2021Dataset updatedMay 18, 2022AuthorsChen JiushengLicenseAttribution 4.0 (CC BY 4.0)https://creativecommons.org/licenses/by/4.0/
License information was derived automaticallyArea coveredChinaDescription2021.
CDC WONDER: Daily Air Temperatures and Heat Index
- catalog.data.gov
- healthdata.gov
- +3more
Updated Jul 26, 2023ShareFacebookTwitterEmailClick to copy linkLink copiedCiteCenters for Disease Control and Prevention, Department of Health & Human Services (2023). CDC WONDER: Daily Air Temperatures and Heat Index [Dataset]. https://catalog.data.gov/dataset/cdc-wonder-daily-air-temperatures-and-heat-indexDataset updatedJul 26, 2023Dataset provided byCenters for Disease Control and Preventionhttp://www.cdc.gov/
United States Department of Health and Human Serviceshttp://www.hhs.gov/DescriptionThe Daily Air Temperature and Heat Index data available on CDC WONDER are county-level daily average air temperatures and heat index measures spanning the years 1979-2010. Temperature data are available in Fahrenheit or Celsius scales. Reported measures are the average temperature, number of observations, and range for the daily maximum and minimum air temperatures, and also percent coverage for the daily maximum heat index. Data are available by place (combined 48 contiguous states, region, division, state, county), time (year, month, day) and specified maximum and minimum air temperature, and heat index value. The data are derived from the North America Land Data Assimilation System (NLDAS) through NLDAS Phase 2, a collaboration project among several groups: the National Oceanic and Atmospheric Administration (NOAA) National Centers for Environmental Prediction (NCEP) Environmental Modeling Center (EMC), the National Aeronautics and Space Administration (NASA) Goddard Space Flight Center (GSFC), Princeton University, the National Weather Service (NWS) Office of Hydrological Development (OHD), the University of Washington, and the NCEP Climate Prediction Center (CPC). In a study funded by the NASA Applied Sciences Program/Public Health Program, scientists at NASA Marshall Space Flight Center/ Universities Space Research Association developed the analysis to produce the data available on CDC WONDER.
Daily Dow Jones Industrial Average index performance 2022-2025
- statista.com
Updated Jul 9, 2025ShareFacebookTwitterEmailClick to copy linkLink copiedCiteStatista (2025). Daily Dow Jones Industrial Average index performance 2022-2025 [Dataset]. https://www.statista.com/statistics/1332259/performance-of-djia-index-daily/Dataset updatedJul 9, 2025Time period coveredJan 3, 2022 - Mar 3, 2025Area coveredUnited StatesDescriptionThe Dow Jones Industrial Average (DJI) index increased overall between January 2022 and April 2024. Between January 4 and June 17, 2022, the index dropped nearly ***** points. It then managed to recover to ********* points as of August 16, 2022, but started a sharp decrease again afterwards. As of March 3, 2025, the index stood at ********* points.
Daily maximum and mean UV indices | DATA.GOV.HK
- data.gov.hk
Updated Dec 23, 2022ShareFacebookTwitterEmailClick to copy linkLink copiedCitedata.gov.hk (2022). Daily maximum and mean UV indices | DATA.GOV.HK [Dataset]. https://data.gov.hk/en-data/dataset/hk-hko-rss-daily-maximum-mean-uv-indexDataset updatedDec 23, 2022Dataset provided bydata.gov.hkDescriptionData on daily maximum and mean UV indices (Please visit the reference link for other climate information). The multiple file formats are available for datasets download in API.
HLS Operational Land Imager Vegetation Indices Daily Global 30 m V2.0 -...
- data.nasa.gov
- data.staging.idas-ds1.appdat.jsc.nasa.gov
Updated Apr 1, 2025+ more versionsShareFacebookTwitterEmailClick to copy linkLink copiedCitenasa.gov (2025). HLS Operational Land Imager Vegetation Indices Daily Global 30 m V2.0 - Dataset - NASA Open Data Portal [Dataset]. https://data.nasa.gov/dataset/hls-operational-land-imager-vegetation-indices-daily-global-30-m-v2-0-87f38Dataset updatedApr 1, 2025DescriptionThe Harmonized Landsat and Sentinel-2 (HLS) project provides consistent data products from the Operational Land Imager (OLI) aboard the joint NASA/USGS Landsat 8 and Landsat 9 satellites and the Multi-Spectral Instrument (MSI) aboard Europe’s Copernicus Sentinel-2A, Sentinel-2B, and Sentinel-2C satellites. The combined measurement enables global observations of the land every 2–3 days at 30 meter (m) spatial resolution. The HLSL30 Vegetation Indices (HLSL30_VI) product is derived from Landsat 8 and Landsat 9 OLI data products. Vegetation indices combine specific bands of satellite data to quantify various aspects of vegetation. Analysis of vegetation indices allows for tracking changes in vegetation over time, identifying areas of stress or deforestation, and assessing crop health. Vegetation indices provide a reliable and efficient means of understanding the complex dynamics of vegetation health. The HLSS30_VI and HLSL30_VI products are gridded to the same resolution and Military Grid Reference System (MGRS) tiling system and thus are “stackable” for time series analysis.The HLSL30_VI product is provided in Cloud Optimized GeoTIFF (COG) format, and each variable is distributed as a separate file. Nine indicators of vegetation health are included in the HLSL30_VI product: Normalized Difference Vegetation Index (NDVI), Enhanced Vegetation Index (EVI), Soil Adjusted Vegetation Index (SAVI), Modified Soil Adjusted Vegetation Index (MSAVI), Normalized Difference Moisture Index (NDMI), Normalized Difference Water Index (NDWI), Normalized Burn Ratio (NBR), Normalized Burn Ratio 2 (NBR2), and Triangular Vegetation Index (TVI). See the User Guide for a more detailed description of the individual vegetation health variables provided in the HLSL30_VI product.
Daily stock price indexes of food commodities 2020-2025
- statista.com
Updated Jun 30, 2025ShareFacebookTwitterEmailClick to copy linkLink copiedCiteStatista (2025). Daily stock price indexes of food commodities 2020-2025 [Dataset]. https://www.statista.com/statistics/1343824/daily-stock-price-indexes-of-food-commodities/Dataset updatedJun 30, 2025Time period coveredJan 2, 2020 - Feb 6, 2025Area coveredWorldwideDescriptionThis statistic shows the stock prices of selected food commodities from January 2, 2020 to February 6, 2025. After the Russian invasion of Ukraine in February 2022, wheat prices increased significantly since both Russia and Ukraine are the key suppliers of the product. With the beginning of 2023, prices of selected food commodities started to decrease, but still stood higher than early-2020 levels.
Daily S&P 500 index performance 2025
- statista.com
Updated Aug 19, 2025ShareFacebookTwitterEmailClick to copy linkLink copiedCiteStatista (2025). Daily S&P 500 index performance 2025 [Dataset]. https://www.statista.com/statistics/1332260/daily-sandp-500-index-performance/Dataset updatedAug 19, 2025Time period coveredJan 3, 2022 - Aug 19, 2024Area coveredUnited StatesDescriptionThe S&P 500 index dropped significantly between January 3 and September 9, 2022. As of January 3, the index stood at ******** points, and it dropped approximately 15 percent by September 2022. In August 2025, the daily value of the S&P 500 increased over 6**** points and reached ********as of August 19 of the same year.
- f
Composition of uninterrupted trends observed in the Nasdaq data sample.
- plos.figshare.com
xlsUpdated Jun 14, 2023ShareFacebookTwitterEmailClick to copy linkLink copiedCiteHéctor Raúl Olivares-Sánchez; Carlos Manuel Rodríguez-Martínez; Héctor Francisco Coronel-Brizio; Enrico Scalas; Thomas Henry Seligman; Alejandro Raúl Hernández-Montoya (2023). Composition of uninterrupted trends observed in the Nasdaq data sample. [Dataset]. http://doi.org/10.1371/journal.pone.0270492.t003xlsAvailable download formatsUnique identifierhttps://doi.org/10.1371/journal.pone.0270492.t003Dataset updatedJun 14, 2023Dataset provided byPLOS ONEAuthorsHéctor Raúl Olivares-Sánchez; Carlos Manuel Rodríguez-Martínez; Héctor Francisco Coronel-Brizio; Enrico Scalas; Thomas Henry Seligman; Alejandro Raúl Hernández-MontoyaLicenseAttribution 4.0 (CC BY 4.0)https://creativecommons.org/licenses/by/4.0/
License information was derived automaticallyDescriptionComposition of uninterrupted trends observed in the Nasdaq data sample.
- R
Russia US Dollar Denominated Indices: RTS Index
- ceicdata.com
Updated Jul 12, 2020ShareFacebookTwitterEmailClick to copy linkLink copiedCiteCEICdata.com (2020). Russia US Dollar Denominated Indices: RTS Index [Dataset]. https://www.ceicdata.com/en/russia/moscow-exchange-indices-denominated-in-usd-dailyDataset updatedJul 12, 2020Dataset provided byCEICdata.comLicenseAttribution 4.0 (CC BY 4.0)https://creativecommons.org/licenses/by/4.0/
License information was derived automaticallyTime period coveredMar 10, 2025 - Mar 25, 2025Area coveredRussiaVariables measuredSecurities Exchange IndexDescriptionUS Dollar Denominated Indices: RTS Index data was reported at 1,107.810 01Sep1995=100 in 16 May 2025. This records a decrease from the previous number of 1,113.980 01Sep1995=100 for 15 May 2025. US Dollar Denominated Indices: RTS Index data is updated daily, averaging 1,176.700 01Sep1995=100 from Sep 1995 (Median) to 16 May 2025, with 7431 observations. The data reached an all-time high of 2,123.560 01Sep1995=100 in 08 Apr 2011 and a record low of 628.410 01Sep1995=100 in 20 Jan 2016. US Dollar Denominated Indices: RTS Index data remains active status in CEIC and is reported by Moscow Exchange. The data is categorized under High Frequency Database’s Financial and Futures Market – Table RU.ZA002: Moscow Exchange: Indices Denominated in USD: Daily. [COVID-19-IMPACT]
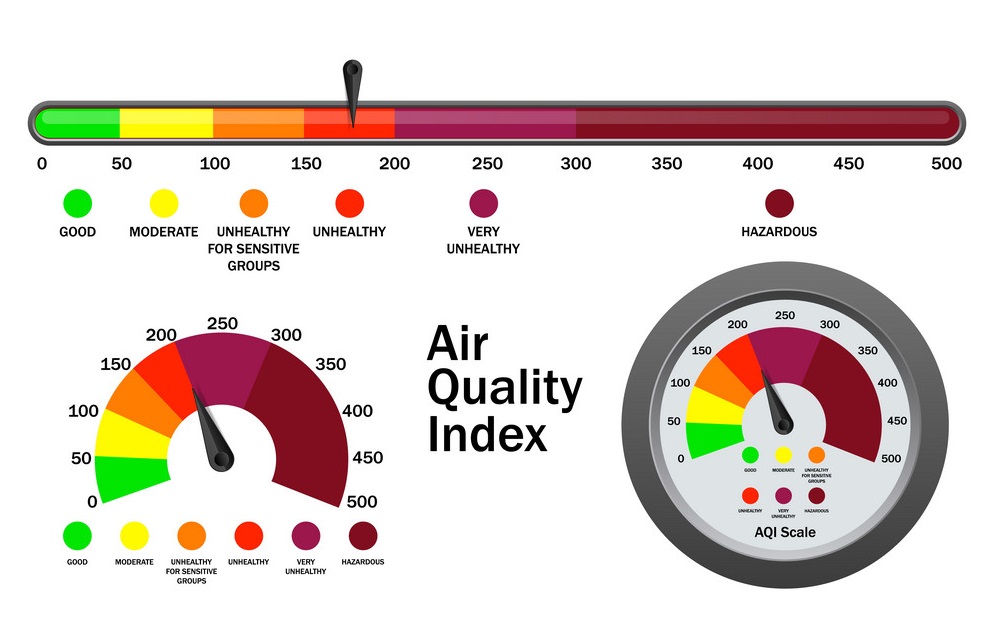
AQI - Air Quality Index
- kaggle.com
Updated Aug 7, 2025ShareFacebookTwitterEmailClick to copy linkLink copiedCiteAzmine Toushik Wasi (2025). AQI - Air Quality Index [Dataset]. http://doi.org/10.34740/kaggle/ds/2354989CroissantCroissant is a format for machine-learning datasets. Learn more about this at mlcommons.org/croissant.Unique identifierhttps://doi.org/10.34740/kaggle/ds/2354989Dataset updatedAug 7, 2025AuthorsAzmine Toushik WasiLicenseOpen Database License (ODbL) v1.0https://www.opendatacommons.org/licenses/odbl/1.0/
License information was derived automaticallyDescriptionContext
This dataset contains Air Quality Index of most the countries of the world.
Challenges
- Time Series Analysis and Prediction
- Seasonality finding
- Geospatial Analysis
About Air Quality Index (AQI
The Air Quality Index (AQI) is used for reporting daily air quality. It tells you how clean or polluted your air is, and what associated health effects might be a concern for you. The AQI focuses on health effects you may experience within a few hours or days after breathing polluted air.
Content
- data_date.csv - date wise organised
Related Notebooks
Download
- kaggle API Command
!kaggle datasets download -d azminetoushikwasi/aqi-air-quality-index-scheduled-daily-update
Disclaimer
- The data collected are all publicly available and it's intended for educational purposes only.
Acknowledgement
- Cover image taken from internet.
Appreciate, Support, Share
- h
daily-papers-abstract-index
- huggingface.co
Updated Apr 25, 2024+ more versionsShareFacebookTwitterEmailClick to copy linkLink copiedCitehysts-bot-data (2024). daily-papers-abstract-index [Dataset]. https://huggingface.co/datasets/hysts-bot-data/daily-papers-abstract-indexCroissantCroissant is a format for machine-learning datasets. Learn more about this at mlcommons.org/croissant.Dataset updatedApr 25, 2024Dataset authored and provided byhysts-bot-dataDescriptionhysts-bot-data/daily-papers-abstract-index dataset hosted on Hugging Face and contributed by the HF Datasets community
FacebookTwitterIndices-Daily-Price
paperswithbacktest/Indices-Daily-Price
https://choosealicense.com/licenses/other/https://choosealicense.com/licenses/other/
Dataset Information
This dataset includes daily price data for various stock indices.
Instruments Included
ADSMI: United Arab Emirates Stock Market (ADX General) - United Arab Emirates AEX: Netherlands Stock Market (AEX) - Netherlands (NL) AS30: Australian All - Australia (AU) AS51: Australia S&P/ASX 200 Stock Market Index - Australia (AU) AS52: ASX 50 - Australia (AU) ASE: Greece Stock Market (ASE) - Greece (GR) ATX: Austria Stock Market (ATX) - Austria (AT) BEL20:… See the full description on the dataset page: https://huggingface.co/datasets/paperswithbacktest/Indices-Daily-Price.