- R
Car Highway Dataset
- universe.roboflow.com
zipUpdated Sep 13, 2023 Share
Share Facebook
 Twitter
 EmailClick to copy linkLink copiedCiteSallar (2023). Car Highway Dataset [Dataset]. https://universe.roboflow.com/sallar/car-highway/dataset/1zipAvailable download formatsDataset updatedSep 13, 2023Dataset authored and provided bySallarLicense
Attribution 4.0 (CC BY 4.0)https://creativecommons.org/licenses/by/4.0/
License information was derived automaticallyVariables measuredVehicles Bounding BoxesDescriptionCar-Highway Data Annotation Project
Introduction
In this project, we aim to annotate car images captured on highways. The annotated data will be used to train machine learning models for various computer vision tasks, such as object detection and classification.
Project Goals
- Collect a diverse dataset of car images from highway scenes.
- Annotate the dataset to identify and label cars within each image.
- Organize and format the annotated data for machine learning model training.
Tools and Technologies
For this project, we will be using Roboflow, a powerful platform for data annotation and preprocessing. Roboflow simplifies the annotation process and provides tools for data augmentation and transformation.
Annotation Process
- Upload the raw car images to the Roboflow platform.
- Use the annotation tools in Roboflow to draw bounding boxes around each car in the images.
- Label each bounding box with the corresponding class (e.g., car).
- Review and validate the annotations for accuracy.
Data Augmentation
Roboflow offers data augmentation capabilities, such as rotation, flipping, and resizing. These augmentations can help improve the model's robustness.
Data Export
Once the data is annotated and augmented, Roboflow allows us to export the dataset in various formats suitable for training machine learning models, such as YOLO, COCO, or TensorFlow Record.
Milestones
- Data Collection and Preprocessing
- Annotation of Car Images
- Data Augmentation
- Data Export
- Model Training
Conclusion
By completing this project, we will have a well-annotated dataset ready for training machine learning models. This dataset can be used for a wide range of applications in computer vision, including car detection and tracking on highways.
- u
Data from: X-ray CT data with semantic annotations for the paper "A workflow...
- agdatacommons.nal.usda.gov
- datasetcatalog.nlm.nih.gov
- +1more
zipUpdated Nov 21, 2025ShareFacebookTwitterEmailClick to copy linkLink copiedCiteDevin Rippner; Mina Momayyezi; Kenneth Shackel; Pranav Raja; Alexander Buchko; Fiona Duong; Dilworth Y. Parkinson; J. Mason Earles; Elisabeth J. Forrestel; Andrew J. McElrone (2025). X-ray CT data with semantic annotations for the paper "A workflow for segmenting soil and plant X-ray CT images with deep learning in Google’s Colaboratory" [Dataset]. http://doi.org/10.15482/USDA.ADC/1524793zipAvailable download formatsUnique identifierhttps://doi.org/10.15482/USDA.ADC/1524793Dataset updatedNov 21, 2025Dataset provided byAg Data CommonsAuthorsDevin Rippner; Mina Momayyezi; Kenneth Shackel; Pranav Raja; Alexander Buchko; Fiona Duong; Dilworth Y. Parkinson; J. Mason Earles; Elisabeth J. Forrestel; Andrew J. McElroneLicenseAttribution 4.0 (CC BY 4.0)https://creativecommons.org/licenses/by/4.0/
License information was derived automaticallyDescriptionLeaves from genetically unique Juglans regia plants were scanned using X-ray micro-computed tomography (microCT) on the X-ray μCT beamline (8.3.2) at the Advanced Light Source (ALS) in Lawrence Berkeley National Laboratory (LBNL), Berkeley, CA USA). Soil samples were collected in Fall of 2017 from the riparian oak forest located at the Russell Ranch Sustainable Agricultural Institute at the University of California Davis. The soil was sieved through a 2 mm mesh and was air dried before imaging. A single soil aggregate was scanned at 23 keV using the 10x objective lens with a pixel resolution of 650 nanometers on beamline 8.3.2 at the ALS. Additionally, a drought stressed almond flower bud (Prunus dulcis) from a plant housed at the University of California, Davis, was scanned using a 4x lens with a pixel resolution of 1.72 µm on beamline 8.3.2 at the ALS Raw tomographic image data was reconstructed using TomoPy. Reconstructions were converted to 8-bit tif or png format using ImageJ or the PIL package in Python before further processing. Images were annotated using Intel’s Computer Vision Annotation Tool (CVAT) and ImageJ. Both CVAT and ImageJ are free to use and open source. Leaf images were annotated in following Théroux-Rancourt et al. (2020). Specifically, Hand labeling was done directly in ImageJ by drawing around each tissue; with 5 images annotated per leaf. Care was taken to cover a range of anatomical variation to help improve the generalizability of the models to other leaves. All slices were labeled by Dr. Mina Momayyezi and Fiona Duong.To annotate the flower bud and soil aggregate, images were imported into CVAT. The exterior border of the bud (i.e. bud scales) and flower were annotated in CVAT and exported as masks. Similarly, the exterior of the soil aggregate and particulate organic matter identified by eye were annotated in CVAT and exported as masks. To annotate air spaces in both the bud and soil aggregate, images were imported into ImageJ. A gaussian blur was applied to the image to decrease noise and then the air space was segmented using thresholding. After applying the threshold, the selected air space region was converted to a binary image with white representing the air space and black representing everything else. This binary image was overlaid upon the original image and the air space within the flower bud and aggregate was selected using the “free hand” tool. Air space outside of the region of interest for both image sets was eliminated. The quality of the air space annotation was then visually inspected for accuracy against the underlying original image; incomplete annotations were corrected using the brush or pencil tool to paint missing air space white and incorrectly identified air space black. Once the annotation was satisfactorily corrected, the binary image of the air space was saved. Finally, the annotations of the bud and flower or aggregate and organic matter were opened in ImageJ and the associated air space mask was overlaid on top of them forming a three-layer mask suitable for training the fully convolutional network. All labeling of the soil aggregate and soil aggregate images was done by Dr. Devin Rippner. These images and annotations are for training deep learning models to identify different constituents in leaves, almond buds, and soil aggregates Limitations: For the walnut leaves, some tissues (stomata, etc.) are not labeled and only represent a small portion of a full leaf. Similarly, both the almond bud and the aggregate represent just one single sample of each. The bud tissues are only divided up into buds scales, flower, and air space. Many other tissues remain unlabeled. For the soil aggregate annotated labels are done by eye with no actual chemical information. Therefore particulate organic matter identification may be incorrect. Resources in this dataset:Resource Title: Annotated X-ray CT images and masks of a Forest Soil Aggregate. File Name: forest_soil_images_masks_for_testing_training.zipResource Description: This aggregate was collected from the riparian oak forest at the Russell Ranch Sustainable Agricultural Facility. The aggreagate was scanned using X-ray micro-computed tomography (microCT) on the X-ray μCT beamline (8.3.2) at the Advanced Light Source (ALS) in Lawrence Berkeley National Laboratory (LBNL), Berkeley, CA USA) using the 10x objective lens with a pixel resolution of 650 nanometers. For masks, the background has a value of 0,0,0; pores spaces have a value of 250,250, 250; mineral solids have a value= 128,0,0; and particulate organic matter has a value of = 000,128,000. These files were used for training a model to segment the forest soil aggregate and for testing the accuracy, precision, recall, and f1 score of the model.Resource Title: Annotated X-ray CT images and masks of an Almond bud (P. Dulcis). File Name: Almond_bud_tube_D_P6_training_testing_images_and_masks.zipResource Description: Drought stressed almond flower bud (Prunis dulcis) from a plant housed at the University of California, Davis, was scanned by X-ray micro-computed tomography (microCT) on the X-ray μCT beamline (8.3.2) at the Advanced Light Source (ALS) in Lawrence Berkeley National Laboratory (LBNL), Berkeley, CA USA) using the 4x lens with a pixel resolution of 1.72 µm using. For masks, the background has a value of 0,0,0; air spaces have a value of 255,255, 255; bud scales have a value= 128,0,0; and flower tissues have a value of = 000,128,000. These files were used for training a model to segment the almond bud and for testing the accuracy, precision, recall, and f1 score of the model.Resource Software Recommended: Fiji (ImageJ),url: https://imagej.net/software/fiji/downloads Resource Title: Annotated X-ray CT images and masks of Walnut leaves (J. Regia) . File Name: 6_leaf_training_testing_images_and_masks_for_paper.zipResource Description: Stems were collected from genetically unique J. regia accessions at the 117 USDA-ARS-NCGR in Wolfskill Experimental Orchard, Winters, California USA to use as scion, and were grafted by Sierra Gold Nursery onto a commonly used commercial rootstock, RX1 (J. microcarpa × J. regia). We used a common rootstock to eliminate any own-root effects and to simulate conditions for a commercial walnut orchard setting, where rootstocks are commonly used. The grafted saplings were repotted and transferred to the Armstrong lathe house facility at the University of California, Davis in June 2019, and kept under natural light and temperature. Leaves from each accession and treatment were scanned using X-ray micro-computed tomography (microCT) on the X-ray μCT beamline (8.3.2) at the Advanced Light Source (ALS) in Lawrence Berkeley National Laboratory (LBNL), Berkeley, CA USA) using the 10x objective lens with a pixel resolution of 650 nanometers. For masks, the background has a value of 170,170,170; Epidermis value= 85,85,85; Mesophyll value= 0,0,0; Bundle Sheath Extension value= 152,152,152; Vein value= 220,220,220; Air value = 255,255,255.Resource Software Recommended: Fiji (ImageJ),url: https://imagej.net/software/fiji/downloads
Self-Annotated Wearable Activity Data
- zenodo.org
- data-staging.niaid.nih.gov
- +1more
zipUpdated Sep 18, 2024ShareFacebookTwitterEmailClick to copy linkLink copiedCiteAlexander Hölzemann; Alexander Hölzemann; Kristof Van Laerhoven; Kristof Van Laerhoven (2024). Self-Annotated Wearable Activity Data [Dataset]. http://doi.org/10.3389/fcomp.2024.1379788zipAvailable download formatsUnique identifierhttps://doi.org/10.3389/fcomp.2024.1379788Dataset updatedSep 18, 2024AuthorsAlexander Hölzemann; Alexander Hölzemann; Kristof Van Laerhoven; Kristof Van LaerhovenLicenseAttribution 4.0 (CC BY 4.0)https://creativecommons.org/licenses/by/4.0/
License information was derived automaticallyDescriptionOur dataset contains 2 weeks of approx. 8-9 hours of acceleration data per day from 11 participants wearing a Bangle.js Version 1 smartwatch with our firmware installed.
The dataset contains annotations from 4 different commonly used annotation methods utilized in user studies that focus on in-the-wild data. These methods can be grouped in user-driven, in situ annotations - which are performed before or during the activity is recorded - and recall methods - where participants annotate their data in hindsight at the end of the day.
The participants had the task to label their activities using (1) a button located on the smartwatch, (2) the activity tracking app Strava, (3) a (hand)written diary and (4) a tool to visually inspect and label activity data, called MAD-GUI. Methods (1)-(3) are used in both weeks, however method (4) is introduced in the beginning of the second study week.
The accelerometer data is recorded with 25 Hz, a sensitivity of ±8g and is stored in a csv format. Labels and raw data are not yet combined. You can either write your own script to label the data or follow the instructions in our corresponding Github repository.
The following unique classes are included in our dataset:
laying, sitting, walking, running, cycling, bus_driving, car_driving, vacuum_cleaning, laundry, cooking, eating, shopping, showering, yoga, sport, playing_games, desk_work, guitar_playing, gardening, table_tennis, badminton, horse_riding.
However, many activities are very participant specific and therefore only performed by one of the participants.
The labels are also stored as a .csv file and have the following columns:
week_day, start, stop, activity, layer
Example:
week2_day2,10:30:00,11:00:00,vacuum_cleaning,d
The layer columns specifies which annotation method was used to set this label.
The following identifiers can be found in the column:
b: in situ button
a: in situ app
d: self-recall diary
g: time-series recall labelled with a the MAD-GUI
The corresponding publication is currently under review.
- d
Data from: The Distributed Annotation System
- catalog.data.gov
- data.virginia.gov
- +2more
Updated Sep 6, 2025+ more versionsShareFacebookTwitterEmailClick to copy linkLink copiedCiteNational Institutes of Health (2025). The Distributed Annotation System [Dataset]. https://catalog.data.gov/dataset/the-distributed-annotation-systemDataset updatedSep 6, 2025Dataset provided byNational Institutes of HealthDescriptionBackground Currently, most genome annotation is curated by centralized groups with limited resources. Efforts to share annotations transparently among multiple groups have not yet been satisfactory. Results Here we introduce a concept called the Distributed Annotation System (DAS). DAS allows sequence annotations to be decentralized among multiple third-party annotators and integrated on an as-needed basis by client-side software. The communication between client and servers in DAS is defined by the DAS XML specification. Annotations are displayed in layers, one per server. Any client or server adhering to the DAS XML specification can participate in the system; we describe a simple prototype client and server example. Conclusions The DAS specification is being used experimentally by Ensembl, WormBase, and the Berkeley Drosophila Genome Project. Continued success will depend on the readiness of the research community to adopt DAS and provide annotations. All components are freely available from the project website .
- T
Guidelines for Data Annotation
- dataverse.tdl.org
pdfUpdated Sep 15, 2020ShareFacebookTwitterEmailClick to copy linkLink copiedCiteKate Mesh; Kate Mesh (2020). Guidelines for Data Annotation [Dataset]. http://doi.org/10.18738/T8/FWOOJQpdf(167426), pdf(2472574)Available download formatsUnique identifierhttps://doi.org/10.18738/T8/FWOOJQDataset updatedSep 15, 2020Dataset provided byTexas Data RepositoryAuthorsKate Mesh; Kate MeshLicenseCC0 1.0 Universal Public Domain Dedicationhttps://creativecommons.org/publicdomain/zero/1.0/
License information was derived automaticallyDescriptionIncluded here are a coding manual and supplementary examples of gesture forms (in still images and video recordings) that informed the coding of the first author (Kate Mesh) and four project reliability coders.
Portuguese Sentiment Corpus for Twitter and
- kaggle.com
zipUpdated Feb 18, 2023ShareFacebookTwitterEmailClick to copy linkLink copiedCiteThe Devastator (2023). Portuguese Sentiment Corpus for Twitter and [Dataset]. https://www.kaggle.com/datasets/thedevastator/portuguese-sentiment-corpus-for-twitter-and-busczip(934 bytes)Available download formatsDataset updatedFeb 18, 2023AuthorsThe DevastatorLicensehttps://creativecommons.org/publicdomain/zero/1.0/https://creativecommons.org/publicdomain/zero/1.0/
DescriptionPortuguese Sentiment Corpus for Twitter and Buscapé Reviews
Accurately Labeled Word-Level Annotations
By [source]
About this dataset
This dataset consists of a comprehensive list of Portuguese words and the corresponding sentiment labels attached to them. By providing finer-grained annotation and labeling, this dataset allows for comparative sentiment analysis in Portuguese from Twitter and Buscapé reviews. With humans assigned to annotate this data, it provides an accurate measure of the sentiment of Portuguese words in multiple contexts. The labels range from positive to negative with numeric values, allowing for more nuanced categorization and comparison between different subcategories within reviews. Whether you’re mining social media conversations or utilizing customer feedback for analytics purposes, this labeled corpus provides an invaluable resource that can help inform your decision making process
More Datasets
For more datasets, click here.
Featured Notebooks
- 🚨 Your notebook can be here! 🚨!
How to use the dataset
This dataset, comprised of Twitter and Buscapé reviews from Portuguese-speaking areas, provides sentiment labels at the word level. This makes it easy to apply to natural language processing models for analysis. The corpus is composed of 3,457 tweets and 476 Buscapé reviews, with a total of 114 unique words in the lexicon along with associated human-annotated sentiment scores for each word.
To properly utilize this resource for comparative sentiment analysis, you need an environment that can read CSV files containing both text and numerical data. With such setting, users can use machine learning algorithms to compare words or phrases within texts or across different datasets and gain an understanding of the opinion expressed towards various topics so far as they have been labeled in this corpus. This data has been annotated according to 3 possible sentiment labels: negative (–1), neutral (0) or positive (+1).
In order to work with this dataset effectively here are some tips:
- Familiarize yourself with the data which contains a list of Portuguese words and their associated sentiment labels – by reading through a full content list you will be able to understand how it works better;
- Create a visualization tool that allows you not only see the weight assigned for each word but also do comparative analyses such as finding differences between same nouns used in different sentences;
- Analyzing text holistically by taking into account contextual information;
Experimenting on different methods that may increase accuracy when dealing with unequal distribution of examples due to class imbalance;
By applying these above measures one should easily achieve reliable results by making use of this linguistically labeled database generated from two distinct corpora including tweets and Buscapé reviews which have previously never been bridged together like this before! With its help it is now easier than ever before gain insights into people’s opinion on various products based on their textual expressions in real time!
Research Ideas
- Comparing the sentiment of Twitter and Buscapé reviews to identify trends in customer opinions over time.
- Understanding how the sentiment of customer reviews compares between different Portuguese languages and dialects.
- Utilizing the labeled corpus for training machine learning models in natural language processing tasks such as sentiment analysis, text classification, and automated opinion summarization
Acknowledgements
If you use this dataset in your research, please credit the original authors. Data Source
License
License: CC0 1.0 Universal (CC0 1.0) - Public Domain Dedication No Copyright - You can copy, modify, distribute and perform the work, even for commercial purposes, all without asking permission. See Other Information.
Columns
File: portuguese_lexicon.csv
Acknowledgements
If you use this dataset in your research, please credit the original authors. If you use this dataset in your research, please credit .
- R
Training and development dataset for information extraction in plant...
- entrepot.recherche.data.gouv.fr
zipUpdated Feb 20, 2025ShareFacebookTwitterEmailClick to copy linkLink copiedCiteMaIAGE; Plateforme ESV; MaIAGE; Plateforme ESV (2025). Training and development dataset for information extraction in plant epidemiomonitoring [Dataset]. http://doi.org/10.57745/ZDNOGFzip(479001)Available download formatsUnique identifierhttps://doi.org/10.57745/ZDNOGFDataset updatedFeb 20, 2025Dataset provided byRecherche Data GouvAuthorsMaIAGE; Plateforme ESV; MaIAGE; Plateforme ESVLicensehttps://entrepot.recherche.data.gouv.fr/api/datasets/:persistentId/versions/1.0/customlicense?persistentId=doi:10.57745/ZDNOGFhttps://entrepot.recherche.data.gouv.fr/api/datasets/:persistentId/versions/1.0/customlicense?persistentId=doi:10.57745/ZDNOGF
Dataset funded byINRAE
Agence nationale de la recherche
PIA DATAIADescriptionThe “Training and development dataset for information extraction in plant epidemiomonitoring” is the annotation set of the “Corpus for the epidemiomonitoring of plant”. The annotations include seven entity types (e.g. species, locations, disease), their normalisation by the NCBI taxonomy and GeoNames and binary (seven) and ternary relationships. The annotations refer to character positions within the documents of the corpus. The annotation guidelines give their definitions and representative examples. Both datasets are intended for the training and validation of information extraction methods.
Chinese-OCR
- kaggle.com
- huggingface.co
zipUpdated Oct 11, 2024ShareFacebookTwitterEmailClick to copy linkLink copiedCitelongmaodata (2024). Chinese-OCR [Dataset]. https://www.kaggle.com/datasets/longmaodata/chinese-ocrzip(19176523 bytes)Available download formatsDataset updatedOct 11, 2024AuthorslongmaodataDescriptionA complete 3.1GB dataset has been uploaded to Hugging Face. Click to jump to:https://huggingface.co/datasets/longmaodata/Chinese-OCR
🔔Due to the platform's upload size restrictions and the extensive nature of our numerous public datasets, we can only provide samples of the datasets here. If you need the full public dataset, please join our official group to access it;
🔔It is entirely free!
🔔This helps promote open-source development!
Complete data size
3.1GB
Join the group
🚀🚀🚀🚀https://t.me/+Y5kL2iHis9A0ZWI1
✅ Obtain a complete dataset
✅ Mutual communication within the industry
✅ Get more information and consultation
✅ Timely dataset update notifications
Dataset Introduction
Chinese-OCR
Version
v1.0
Release Date
2024-10-12
Data Description
Scene Types: Natural, Reshot, Screenshots
Collection Environments: Magazines, Newspapers, Books, Signage, Receipts, Maps, PPTs, Menus, Product Packaging, Train Tickets, Banners, Bulletin Boards, Cards Lighting
Distribution: Normal Lighting Conditions Collection
Devices: Web Scraping, Smartphone Photography Collection
Distance: 20cm to 500cm
Shooting Angles: Scenes with the phone placed flat on a table (front, left front, right front), handheld scenes, scenes taken with the phone mounted on a tripod (with different tilting angles) Portrait and Landscape
Mode: Includes vertical video shooting and horizontal picture taking
Data Characteristics: Rich shooting scenes covering multiple angles and lighting conditions Data
Formats: .jpg, .png
Image Resolution: 1280x720, 1496x720, 1920x1080, 2560x1440, 2244x1080
Dataset Size: 5027 images
Directory Structure
root_directory/ ├── annotations/ # Data annotation files │ ├── annotation1.json │ ├── annotation2.json ├── image/ │ ├── image1.jpg │ ├── image2.jpg ## Example 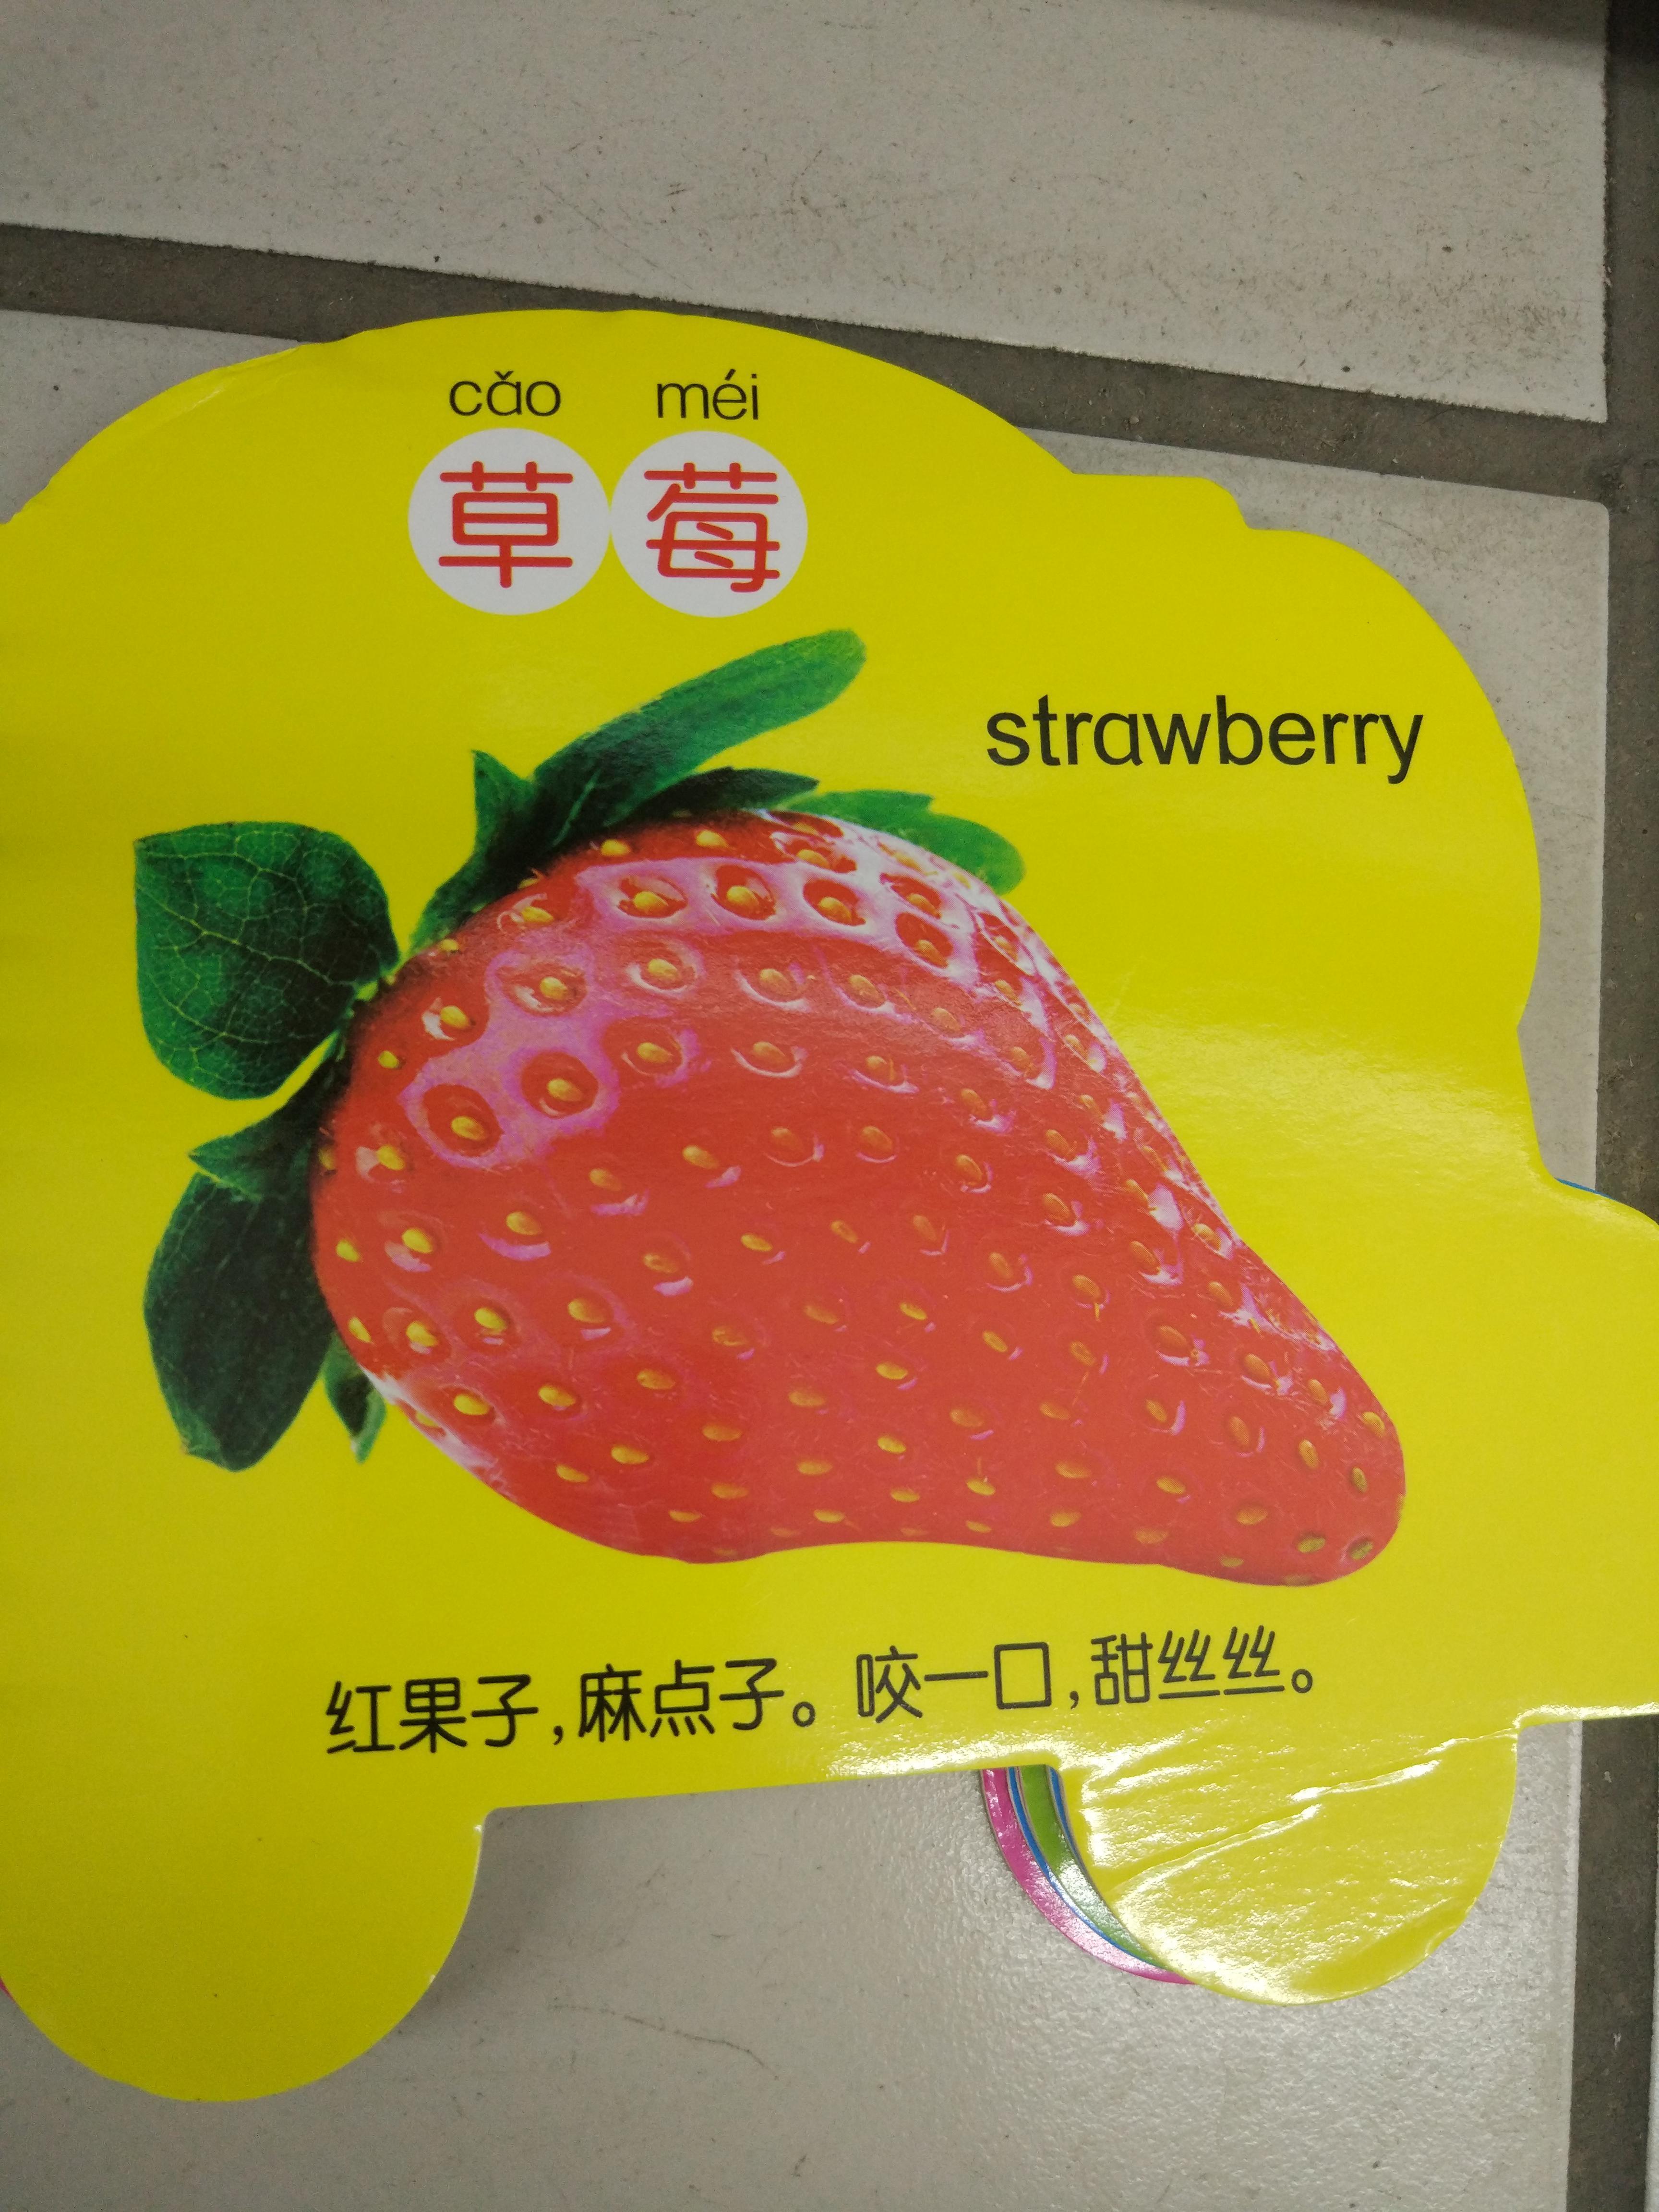 { "question": { }, "answer": { "markData": { "rotate": 0, "notes": [ ], "src": "http://task.totoro.cdn.shandianshua.com/lme531ecf89d8582ab5af8e27b3aaabeeelm/yuantu/%E4%B8%AD%E6%96%87/%E8%87%AA%E7%84%B6%E5%85%89/%E5%B9%BF%E5%91%8A%E7%89%8C/zhongwenziranguang1016-000032.jpg", "counts": [ ], "allLabel": true, "annotations": [ { "transferText": "###", "isfillOverlay": 1, "labelType": " ", "orderNum": 1, "fixedNum": 0, "labelIndex": 0, "type": "outline", "points": [ { "x": 1364, "y": 873 }, { "x": 1366, "y": 768 }, { "x": 1583, "y": 765 }, { "x": 1586, "y": 877 } ], "privateStyle": "rgba(255,0,0,0.3)" }, { "transferText": "###", "isfillOverlay": 1, "labelType": " ", "orderNum": 2, "fixedNum": 0, "labelIndex": 0, "type": "outline", "points": [ { "x": 933, "y": 770 }, { "x": 1172, "y": 770 }, { "x": 1169, "y": 870 }, { "x": 933, "y": 871 } ], "privateStyle": "rgba(255,0,0,0.3)" }, { "transferText": "莓", "isfillOverlay": 1, "labelType": " ", "orderNum": 3, "fixedNum": 0, "labelIndex": 0, "type": "outline", "points": [ { "x": 1338, "y": 961 }, { "x": 1625, ...- q
St Bees acoustic sensor data annotations
- researchdatafinder.qut.edu.au
- researchdata.edu.au
Updated Dec 6, 2010ShareFacebookTwitterEmailClick to copy linkLink copiedCitePaul Roe (2010). St Bees acoustic sensor data annotations [Dataset]. https://researchdatafinder.qut.edu.au/individual/q82Dataset updatedDec 6, 2010Dataset provided byQueensland University of Technology (QUT)AuthorsPaul RoeDescriptionThis dataset is the tagged csv file resulting from a study investigating the vocalisations of Koala populations on St Bees island. Audio data can be retrieved by date and time period and by searching annotation tags which have been applied to the audio recordings (for example it is possible to search for all audio samples tagged with Kookaburra). Researchers can download audio files and csv files containing information about the tags specified in the search. The 'tag' file includes: Tag Name,Start Time,End Time,Max Frequency (hz), Min Frequency (hz),Project Site, Sensor Name, Score and a link to the specific audio sample associated with the individual tag.
Dataset for the paper: "Monant Medical Misinformation Dataset: Mapping...
- zenodo.org
- data.niaid.nih.gov
- +1more
Updated Oct 21, 2025ShareFacebookTwitterEmailClick to copy linkLink copiedCiteIvan Srba; Ivan Srba; Branislav Pecher; Branislav Pecher; Matus Tomlein; Matus Tomlein; Robert Moro; Robert Moro; Elena Stefancova; Elena Stefancova; Jakub Simko; Jakub Simko; Maria Bielikova; Maria Bielikova (2025). Dataset for the paper: "Monant Medical Misinformation Dataset: Mapping Articles to Fact-Checked Claims" [Dataset]. http://doi.org/10.5281/zenodo.5996864Unique identifierhttps://doi.org/10.5281/zenodo.5996864Dataset updatedOct 21, 2025AuthorsIvan Srba; Ivan Srba; Branislav Pecher; Branislav Pecher; Matus Tomlein; Matus Tomlein; Robert Moro; Robert Moro; Elena Stefancova; Elena Stefancova; Jakub Simko; Jakub Simko; Maria Bielikova; Maria BielikovaDescriptionOverview
This dataset of medical misinformation was collected and is published by Kempelen Institute of Intelligent Technologies (KInIT). It consists of approx. 317k news articles and blog posts on medical topics published between January 1, 1998 and February 1, 2022 from a total of 207 reliable and unreliable sources. The dataset contains full-texts of the articles, their original source URL and other extracted metadata. If a source has a credibility score available (e.g., from Media Bias/Fact Check), it is also included in the form of annotation. Besides the articles, the dataset contains around 3.5k fact-checks and extracted verified medical claims with their unified veracity ratings published by fact-checking organisations such as Snopes or FullFact. Lastly and most importantly, the dataset contains 573 manually and more than 51k automatically labelled mappings between previously verified claims and the articles; mappings consist of two values: claim presence (i.e., whether a claim is contained in the given article) and article stance (i.e., whether the given article supports or rejects the claim or provides both sides of the argument).
The dataset is primarily intended to be used as a training and evaluation set for machine learning methods for claim presence detection and article stance classification, but it enables a range of other misinformation related tasks, such as misinformation characterisation or analyses of misinformation spreading.
Its novelty and our main contributions lie in (1) focus on medical news article and blog posts as opposed to social media posts or political discussions; (2) providing multiple modalities (beside full-texts of the articles, there are also images and videos), thus enabling research of multimodal approaches; (3) mapping of the articles to the fact-checked claims (with manual as well as predicted labels); (4) providing source credibility labels for 95% of all articles and other potential sources of weak labels that can be mined from the articles' content and metadata.
The dataset is associated with the research paper "Monant Medical Misinformation Dataset: Mapping Articles to Fact-Checked Claims" accepted and presented at ACM SIGIR Conference on Research and Development in Information Retrieval (SIGIR '22).
The accompanying Github repository provides a small static sample of the dataset and the dataset's descriptive analysis in a form of Jupyter notebooks.
In order to obtain an access to the full dataset (in the CSV format), please, request the access by following the instructions provided below.
Note: Please, check also our MultiClaim Dataset that provides a more recent, a larger, and a highly multilingual dataset of fact-checked claims, social media posts and relations between them.
References
If you use this dataset in any publication, project, tool or in any other form, please, cite the following papers:
@inproceedings{SrbaMonantPlatform,
  author = {Srba, Ivan and Moro, Robert and Simko, Jakub and Sevcech, Jakub and Chuda, Daniela and Navrat, Pavol and Bielikova, Maria},
  booktitle = {Proceedings of Workshop on Reducing Online Misinformation Exposure (ROME 2019)},
  pages = {1--7},
  title = {Monant: Universal and Extensible Platform for Monitoring, Detection and Mitigation of Antisocial Behavior},
  year = {2019}
}
@inproceedings{SrbaMonantMedicalDataset, author = {Srba, Ivan and Pecher, Branislav and Tomlein Matus and Moro, Robert and Stefancova, Elena and Simko, Jakub and Bielikova, Maria}, booktitle = {Proceedings of the 45th International ACM SIGIR Conference on Research and Development in Information Retrieval (SIGIR '22)}, numpages = {11}, title = {Monant Medical Misinformation Dataset: Mapping Articles to Fact-Checked Claims}, year = {2022}, doi = {10.1145/3477495.3531726}, publisher = {Association for Computing Machinery}, address = {New York, NY, USA}, url = {https://doi.org/10.1145/3477495.3531726}, }
Dataset creation processIn order to create this dataset (and to continuously obtain new data), we used our research platform Monant. The Monant platform provides so called data providers to extract news articles/blogs from news/blog sites as well as fact-checking articles from fact-checking sites. General parsers (from RSS feeds, Wordpress sites, Google Fact Check Tool, etc.) as well as custom crawler and parsers were implemented (e.g., for fact checking site Snopes.com). All data is stored in the unified format in a central data storage.
Ethical considerationsThe dataset was collected and is published for research purposes only. We collected only publicly available content of news/blog articles. The dataset contains identities of authors of the articles if they were stated in the original source; we left this information, since the presence of an author's name can be a strong credibility indicator. However, we anonymised the identities of the authors of discussion posts included in the dataset.
The main identified ethical issue related to the presented dataset lies in the risk of mislabelling of an article as supporting a false fact-checked claim and, to a lesser extent, in mislabelling an article as not containing a false claim or not supporting it when it actually does. To minimise these risks, we developed a labelling methodology and require an agreement of at least two independent annotators to assign a claim presence or article stance label to an article. It is also worth noting that we do not label an article as a whole as false or true. Nevertheless, we provide partial article-claim pair veracities based on the combination of claim presence and article stance labels.
As to the veracity labels of the fact-checked claims and the credibility (reliability) labels of the articles' sources, we take these from the fact-checking sites and external listings such as Media Bias/Fact Check as they are and refer to their methodologies for more details on how they were established.
Lastly, the dataset also contains automatically predicted labels of claim presence and article stance using our baselines described in the next section. These methods have their limitations and work with certain accuracy as reported in this paper. This should be taken into account when interpreting them.
Reporting mistakes in the dataset
The mean to report considerable mistakes in raw collected data or in manual annotations is by creating a new issue in the accompanying Github repository. Alternately, general enquiries or requests can be sent at info [at] kinit.sk.
Dataset structureRaw data
At first, the dataset contains so called raw data (i.e., data extracted by the Web monitoring module of Monant platform and stored in exactly the same form as they appear at the original websites). Raw data consist of articles from news sites and blogs (e.g. naturalnews.com), discussions attached to such articles, fact-checking articles from fact-checking portals (e.g. snopes.com). In addition, the dataset contains feedback (number of likes, shares, comments) provided by user on social network Facebook which is regularly extracted for all news/blogs articles.
Raw data are contained in these CSV files:
- sources.csv
- articles.csv
- article_media.csv
- article_authors.csv
- discussion_posts.csv
- discussion_post_authors.csv
- fact_checking_articles.csv
- fact_checking_article_media.csv
- claims.csv
- feedback_facebook.csv
Note: Personal information about discussion posts' authors (name, website, gravatar) are anonymised.
AnnotationsSecondly, the dataset contains so called annotations. Entity annotations describe the individual raw data entities (e.g., article, source). Relation annotations describe relation between two of such entities.
Each annotation is described by the following attributes:
- category of annotation (`annotation_category`). Possible values: label (annotation corresponds to ground truth, determined by human experts) and prediction (annotation was created by means of AI method).
- type of annotation (`annotation_type_id`). Example values: Source reliability (binary), Claim presence. The list of possible values can be obtained from enumeration in annotation_types.csv.
- method which created annotation (`method_id`). Example values: Expert-based source reliability evaluation, Fact-checking article to claim transformation method. The list of possible values can be obtained from enumeration methods.csv.
- its value (`value`). The value is stored in JSON format and its structure differs according to particular annotation type.
At the same time, annotations are associated with a particular object identified by:- entity type (parameter `entity_type` in case of entity annotations, or `source_entity_type` and `target_entity_type` in case of relation annotations). Possible values: sources, articles, fact-checking-articles.
- entity id (parameter `entity_id` in case of entity annotations, or `source_entity_id` and `target_entity_id` in case of relation annotations).
The dataset provides specifically these entity- m
Sample scRNA-seq Data for Cell Type Annotation
- mllmcelltype.com
csv, xlsUpdated Jan 8, 2025+ more versionsShareFacebookTwitterEmailClick to copy linkLink copiedCitemLLMCelltype Research Team (2025). Sample scRNA-seq Data for Cell Type Annotation [Dataset]. http://doi.org/10.5281/zenodo.mllmcelltype-samplecsv, xlsAvailable download formatsUnique identifierhttps://doi.org/10.5281/zenodo.mllmcelltype-sampleDataset updatedJan 8, 2025Dataset provided bymLLMCelltypeAuthorsmLLMCelltype Research TeamLicenseMIT Licensehttps://opensource.org/licenses/MIT
License information was derived automaticallyTime period covered2024 - 2025Area coveredGlobalVariables measuredGene Expression, Cell Type MarkersMeasurement techniqueSingle-cell RNA sequencing (scRNA-seq)DescriptionComprehensive example single-cell RNA sequencing dataset with marker genes specifically designed for testing and demonstrating AI-powered cell type annotation capabilities. This dataset includes representative cell clusters with known markers for validation purposes.
AOP-Wiki Event Component Annotation
- catalog.data.gov
- datasets.ai
Updated Nov 12, 2020ShareFacebookTwitterEmailClick to copy linkLink copiedCiteU.S. EPA Office of Research and Development (ORD) (2020). AOP-Wiki Event Component Annotation [Dataset]. https://catalog.data.gov/dataset/aop-wiki-event-component-annotationDataset updatedNov 12, 2020DescriptionThis dataset contains ontology terms associated with key events from the AOP-Wiki. This information was used to seed the AOP-Wiki with a carefully selected set of ontology terms prior to opening up the option for authors to tag their own AOPs. This is intended to provide existing examples for authors and improve consistency when assigning terms to the key events. This dataset is associated with the following publication: Ives, C., I. Campia, R. Wang, C. Wittwehr, and S. Edwards. Creating a Structured Adverse Outcome Pathway Knowledgebase via Ontology-Based Annotations. Applied In Vitro Toxicology. Mary Ann Liebert, Inc., Larchmont, NY, USA, 3(4): 298-311, (2017).
- f
Data from: Biologically Consistent Annotation of Metabolomics Data
- acs.figshare.com
zipUpdated Jun 1, 2023ShareFacebookTwitterEmailClick to copy linkLink copiedCiteNicholas Alden; Smitha Krishnan; Vladimir Porokhin; Ravali Raju; Kyle McElearney; Alan Gilbert; Kyongbum Lee (2023). Biologically Consistent Annotation of Metabolomics Data [Dataset]. http://doi.org/10.1021/acs.analchem.7b02162.s002zipAvailable download formatsUnique identifierhttps://doi.org/10.1021/acs.analchem.7b02162.s002Dataset updatedJun 1, 2023Dataset provided byACS PublicationsAuthorsNicholas Alden; Smitha Krishnan; Vladimir Porokhin; Ravali Raju; Kyle McElearney; Alan Gilbert; Kyongbum LeeLicenseAttribution-NonCommercial 4.0 (CC BY-NC 4.0)https://creativecommons.org/licenses/by-nc/4.0/
License information was derived automaticallyDescriptionAnnotation of metabolites remains a major challenge in liquid chromatography–mass spectrometry (LC–MS) based untargeted metabolomics. The current gold standard for metabolite identification is to match the detected feature with an authentic standard analyzed on the same equipment and using the same method as the experimental samples. However, there are substantial practical challenges in applying this approach to large data sets. One widely used annotation approach is to search spectral libraries in reference databases for matching metabolites; however, this approach is limited by the incomplete coverage of these libraries. An alternative computational approach is to match the detected features to candidate chemical structures based on their mass and predicted fragmentation pattern. Unfortunately, both of these approaches can match multiple identities with a single feature. Another issue is that annotations from different tools often disagree. This paper presents a novel LC–MS data annotation method, termed Biologically Consistent Annotation (BioCAn), that combines the results from database searches and in silico fragmentation analyses and places these results into a relevant biological context for the sample as captured by a metabolic model. We demonstrate the utility of this approach through an analysis of CHO cell samples. The performance of BioCAn is evaluated against several currently available annotation tools, and the accuracy of BioCAn annotations is verified using high-purity analytical standards.
- n
Dataset of Pairs of an Image and Tags for Cataloging Image-based Records
- narcis.nl
- data.mendeley.com
Updated Apr 19, 2022ShareFacebookTwitterEmailClick to copy linkLink copiedCiteSuzuki, T (via Mendeley Data) (2022). Dataset of Pairs of an Image and Tags for Cataloging Image-based Records [Dataset]. http://doi.org/10.17632/msyc6mzvhg.2Unique identifierhttps://doi.org/10.17632/msyc6mzvhg.2Dataset updatedApr 19, 2022Dataset provided byData Archiving and Networked Services (DANS)AuthorsSuzuki, T (via Mendeley Data)DescriptionBrief ExplanationThis dataset is created to develop and evaluate a cataloging system which assigns appropriate metadata to an image record for database management in digital libraries. That is assumed for evaluating a task, in which given an image and assigned tags, an appropriate Wikipedia page is selected for each of the given tags.A main characteristic of the dataset is including ambiguous tags. Thus, visual contents of images are not unique to their tags. For example, it includes a tag 'mouse' which has double meaning of not a mammal but a computer controller device. The annotations are corresponding Wikipedia articles for tags as correct entities by human judgement.The dataset offers both data and programs that reproduce experiments of the above-mentioned task. Its data consist of sources of images and annotations. The image sources are URLs of 420 images uploaded to Flickr. The annotations are a total 2,464 relevant Wikipedia pages manually judged for tags of the images. The dataset also provides programs in Jupiter notebook (scripts.ipynb) to conduct a series of experiments running some baseline methods for the designated task and evaluating the results. ## Structure of the Dataset1. data directory 1.1. image_URL.txt This file lists URLs of image files. 1.2. rels.txt This file lists collect Wikipedia pages for each topic in topics.txt 1.3. topics.txt This file lists a target pair, which is called a topic in this dataset, of an image and a tag to be disambiguated. 1.4. enwiki_20171001.xml This file is extracted texts from the title and body parts of English Wikipedia articles as of 1st October 2017. This is a modified data of Wikipedia dump data (https://archive.org/download/enwiki-20171001).2. img directory This directory is a placeholder directory to fetch image files for downloading.3. results directory This directory is a placeholder directory to store results files for evaluation. It maintains three results of baseline methods in sub-directories. They contain json files each of which is a result of one topic, and are ready to be evaluated using an evaluation scripts in scripts.ipynb for reference of both usage and performance. 4. scripts.ipynb The scripts for running baseline methods and evaluation are ready in this Jupyter notebook file.
bdd100k Yolo-Format Dataset
- kaggle.com
zipUpdated Oct 30, 2025ShareFacebookTwitterEmailClick to copy linkLink copiedCiteAhmad Mostafa (2025). bdd100k Yolo-Format Dataset [Dataset]. https://www.kaggle.com/datasets/a7madmostafa/bdd100k-yolozip(5718281611 bytes)Available download formatsDataset updatedOct 30, 2025AuthorsAhmad MostafaLicenseAttribution-ShareAlike 4.0 (CC BY-SA 4.0)https://creativecommons.org/licenses/by-sa/4.0/
License information was derived automaticallyDescription🛣️ BDD100K in YOLO Format
Ready-to-Use Object Detection Dataset for Autonomous Driving
📘 Overview
The BDD100K YOLO Format Dataset is a reformatted version of the original Berkeley DeepDrive (BDD100K) dataset, converted into YOLO-compatible annotations.
It’s designed for quick integration with YOLOv5, YOLOv8, YOLOv11, and other modern object detection frameworks.This dataset provides real-world driving scenes with bounding box annotations for common traffic objects — ideal for research, training, and benchmarking models for autonomous driving and road safety applications.
📂 Dataset Structure
bdd100k_yolo/
│
├── train/
│  ├── images/  # 70,000 images
│  └── labels/  # Corresponding YOLO .txt annotations
│
├── val/
│  ├── images/  # 10,000 images
│  └── labels/
│
├── test/
│  ├── images/
│  └── labels/
│
└── data.yaml   # Dataset configuration file for YOLO
🏷️ Classes (10)
| ID | Class Name | | -- | ------------- | | 0 | person | | 1 | rider | | 2 | car | | 3 | bus | | 4 | truck | | 5 | bike | | 6 | motor | | 7 | traffic light | | 8 | traffic sign | | 9 | train |
🚀 Usage
Train your YOLO model directly using the provided data.yaml file.
🧩 YOLOv8 Example
yolo detect train data=data.yaml model=yolov8n.pt epochs=50 imgsz=640✅ Validate
yolo detect val data=data.yaml model=path/to/best.pt🔍 Predict
yolo detect predict model=path/to/best.ptRafanoSet: Dataset of raw, manual and automatically annotated Raphanus...
- zenodo.org
- data.niaid.nih.gov
zipUpdated Apr 8, 2024ShareFacebookTwitterEmailClick to copy linkLink copiedCiteShubham Rana; Shubham Rana; Salvatore Gerbino; Salvatore Gerbino; Domenico Barretta; Domenico Barretta; Petronia Carillo; Petronia Carillo; Mariano Crimaldi; Mariano Crimaldi; Valerio Cirillo; Valerio Cirillo; Albino Maggio; Albino Maggio; Fabrizio Sarghini; Fabrizio Sarghini (2024). RafanoSet: Dataset of raw, manual and automatically annotated Raphanus Raphanistrum weed images for object detection and segmentation in Heterogenous Agriculture Environment [Dataset]. http://doi.org/10.5281/zenodo.10567784zipAvailable download formatsUnique identifierhttps://doi.org/10.5281/zenodo.10567784Dataset updatedApr 8, 2024AuthorsShubham Rana; Shubham Rana; Salvatore Gerbino; Salvatore Gerbino; Domenico Barretta; Domenico Barretta; Petronia Carillo; Petronia Carillo; Mariano Crimaldi; Mariano Crimaldi; Valerio Cirillo; Valerio Cirillo; Albino Maggio; Albino Maggio; Fabrizio Sarghini; Fabrizio SarghiniLicenseAttribution 4.0 (CC BY 4.0)https://creativecommons.org/licenses/by/4.0/
License information was derived automaticallyDescriptionThis dataset is a collection of raw and annotated Multispectral (MS) images acquired in a heterogenous agricultural environment with MicaSense RedEdge-M camera. The spectra particularly Green, Blue, Red, Red Edge and Near Infrared (NIR) were acquired at sub-metre level..
The MS images were labelled manually using VIA and automatically using Grounding DINO in combination with Segment Anything Model. The segmentation masks obtained using these two annotation techniqes over as well as the source code to perform necessary image processing operations are provided in the repository. The images are focussed over Horseradish (Raphanus Raphanistrum) infestations in Triticum Aestivum (wheat) crops.The nomenclature of sequecncing and naming images and annotations has been in this format: IMG_
This dataset 'RafanoSet'is categorized in 6 directories namely 'Raw Images', 'Manual Annotations', 'Automated Annotations', 'Binary Masks - Manual', 'Binary Masks - Automated' and 'Codes'. The sub-directory 'Raw Images' consists of manually acquired 85 images in .PNG format. over 17 different scenes. The sub-directory 'Manual Annotations' consists of annotation file 'region_data' in COCO segmentation format. The sub-directory 'Automated Annotations' consists of 80 automatically annotated images in .JPG format and 80 .XML files in Pascal VOC annotation format.
The scientific framework of image acquisition and annotations are explained in the Data in Brief paper which is the course of peer review. This is just a prerequisite to the data article.
Field experimentation roles:The image acquisition was performed by Mariano Crimaldi, a researcher, on behalf of Department of Agriculture and the hosting institution University of Naples Federico II, Italy.
Shubham Rana has been the curator and analyst for the data under the supervision of his PhD supervisor Prof. Salvatore Gerbino. They are affiliated with Department of Engineering, University of Campania 'Luigi Vanvitelli'.
Domenico Barretta, Department of Engineering has been associated in consulting and brainstorming role particularly with data validation, annotation management and litmus testing of the datasets.
Example of a sentence from the dataset, annotated by 5 independent...
- plos.figshare.com
- figshare.com
xlsUpdated May 31, 2023ShareFacebookTwitterEmailClick to copy linkLink copiedCiteAndrey Rzhetsky; Hagit Shatkay; W. John Wilbur (2023). Example of a sentence from the dataset, annotated by 5 independent annotators (sentence 10835394_70). [Dataset]. http://doi.org/10.1371/journal.pcbi.1000391.t001xlsAvailable download formatsUnique identifierhttps://doi.org/10.1371/journal.pcbi.1000391.t001Dataset updatedMay 31, 2023AuthorsAndrey Rzhetsky; Hagit Shatkay; W. John WilburLicenseAttribution 4.0 (CC BY 4.0)https://creativecommons.org/licenses/by/4.0/
License information was derived automaticallyDescriptionAnnotations in the context of the real sentence are as follows:The phenotypes of mxp19 (Fig 1B) |A2:**1SP3E3| and mxp170 (data not shown) homozygotes and hemizygotes (data not shown) are identical, |A3:**1SP3E3| |A4:**1SP3E3| |A5:**1GP3E3| suggesting that mxp19 and mxp170 are null alleles. |A1:**1SP3E3| |A2:**2SP3E1| |A3:**1SP2E0| |A4:**2SP2E0| |A5:**2GP2E3|The minimum number of sentence fragments required to represent these annotations is three:A = “The phenotypes of mxp19 (Fig 1B)”B = “and mxp170 (data not shown) homozygotes and hemizygotes (data not shown) are identical,”C = “suggesting that mxp19 and mxp170 are null alleles.”Annotators' identities are concealed with codes A1, A2, A3, A4, and A5.
- h
SeaDronesSee-Annotations-DataSlabs
- huggingface.co
ShareFacebookTwitterEmailClick to copy linkLink copiedCiteData Slabs, SeaDronesSee-Annotations-DataSlabs [Dataset]. https://huggingface.co/datasets/Data-Slabs/SeaDronesSee-Annotations-DataSlabsAuthorsData SlabsDescriptionSeaDronesSee-Annotations-DataSlabs 🌊🚁
Created by Muzzammil Siddiqui under Data-Slabs
This dataset is a partial subset of SeaDronesSee, reformatted and annotated in COCO format for public use.It is designed to aid Search and Rescue (SAR) research by helping models identify drowning victims and boats in aerial drone footage.📦 Contentsimages/train/ – Training image set (375 samples)
images/valid/ – Validation image set (145 samples)
annotations/train.json… See the full description on the dataset page: https://huggingface.co/datasets/Data-Slabs/SeaDronesSee-Annotations-DataSlabs. - d
AI Training Data | Annotated Checkout Flows for Retail, Restaurant, and...
- datarade.ai
Updated Dec 18, 2024ShareFacebookTwitterEmailClick to copy linkLink copiedCiteMealMe (2024). AI Training Data | Annotated Checkout Flows for Retail, Restaurant, and Marketplace Websites [Dataset]. https://datarade.ai/data-products/ai-training-data-annotated-checkout-flows-for-retail-resta-mealmeDataset updatedDec 18, 2024Dataset authored and provided byMealMeArea coveredUnited States of AmericaDescriptionAI Training Data | Annotated Checkout Flows for Retail, Restaurant, and Marketplace Websites Overview
Unlock the next generation of agentic commerce and automated shopping experiences with this comprehensive dataset of meticulously annotated checkout flows, sourced directly from leading retail, restaurant, and marketplace websites. Designed for developers, researchers, and AI labs building large language models (LLMs) and agentic systems capable of online purchasing, this dataset captures the real-world complexity of digital transactions—from cart initiation to final payment.
Key Features
Breadth of Coverage: Over 10,000 unique checkout journeys across hundreds of top e-commerce, food delivery, and service platforms, including but not limited to Walmart, Target, Kroger, Whole Foods, Uber Eats, Instacart, Shopify-powered sites, and more.
Actionable Annotation: Every flow is broken down into granular, step-by-step actions, complete with timestamped events, UI context, form field details, validation logic, and response feedback. Each step includes:
Page state (URL, DOM snapshot, and metadata)
User actions (clicks, taps, text input, dropdown selection, checkbox/radio interactions)
System responses (AJAX calls, error/success messages, cart/price updates)
Authentication and account linking steps where applicable
Payment entry (card, wallet, alternative methods)
Order review and confirmation
Multi-Vertical, Real-World Data: Flows sourced from a wide variety of verticals and real consumer environments, not just demo stores or test accounts. Includes complex cases such as multi-item carts, promo codes, loyalty integration, and split payments.
Structured for Machine Learning: Delivered in standard formats (JSONL, CSV, or your preferred schema), with every event mapped to action types, page features, and expected outcomes. Optional HAR files and raw network request logs provide an extra layer of technical fidelity for action modeling and RLHF pipelines.
Rich Context for LLMs and Agents: Every annotation includes both human-readable and model-consumable descriptions:
“What the user did” (natural language)
“What the system did in response”
“What a successful action should look like”
Error/edge case coverage (invalid forms, OOS, address/payment errors)
Privacy-Safe & Compliant: All flows are depersonalized and scrubbed of PII. Sensitive fields (like credit card numbers, user addresses, and login credentials) are replaced with realistic but synthetic data, ensuring compliance with privacy regulations.
Each flow tracks the user journey from cart to payment to confirmation, including:
Adding/removing items
Applying coupons or promo codes
Selecting shipping/delivery options
Account creation, login, or guest checkout
Inputting payment details (card, wallet, Buy Now Pay Later)
Handling validation errors or OOS scenarios
Order review and final placement
Confirmation page capture (including order summary details)
Why This Dataset?
Building LLMs, agentic shopping bots, or e-commerce automation tools demands more than just page screenshots or API logs. You need deeply contextualized, action-oriented data that reflects how real users interact with the complex, ever-changing UIs of digital commerce. Our dataset uniquely captures:
The full intent-action-outcome loop
Dynamic UI changes, modals, validation, and error handling
Nuances of cart modification, bundle pricing, delivery constraints, and multi-vendor checkouts
Mobile vs. desktop variations
Diverse merchant tech stacks (custom, Shopify, Magento, BigCommerce, native apps, etc.)
Use Cases
LLM Fine-Tuning: Teach models to reason through step-by-step transaction flows, infer next-best-actions, and generate robust, context-sensitive prompts for real-world ordering.
Agentic Shopping Bots: Train agents to navigate web/mobile checkouts autonomously, handle edge cases, and complete real purchases on behalf of users.
Action Model & RLHF Training: Provide reinforcement learning pipelines with ground truth “what happens if I do X?” data across hundreds of real merchants.
UI/UX Research & Synthetic User Studies: Identify friction points, bottlenecks, and drop-offs in modern checkout design by replaying flows and testing interventions.
Automated QA & Regression Testing: Use realistic flows as test cases for new features or third-party integrations.
What’s Included
10,000+ annotated checkout flows (retail, restaurant, marketplace)
Step-by-step event logs with metadata, DOM, and network context
Natural language explanations for each step and transition
All flows are depersonalized and privacy-compliant
Example scripts for ingesting, parsing, and analyzing the dataset
Flexible licensing for research or commercial use
Sample Categories Covered
Grocery delivery (Instacart, Walmart, Kroger, Target, etc.)
Restaurant takeout/delivery (Ub...
Data from: BreCaHAD: A Dataset for Breast Cancer Histopathological...
- figshare.com
pngUpdated Jan 28, 2019ShareFacebookTwitterEmailClick to copy linkLink copiedCiteAlper Aksac; Douglas J. Demetrick; Tansel Özyer; Reda Alhajj (2019). BreCaHAD: A Dataset for Breast Cancer Histopathological Annotation and Diagnosis [Dataset]. http://doi.org/10.6084/m9.figshare.7379186.v3pngAvailable download formatsUnique identifierhttps://doi.org/10.6084/m9.figshare.7379186.v3Dataset updatedJan 28, 2019AuthorsAlper Aksac; Douglas J. Demetrick; Tansel Özyer; Reda AlhajjLicenseAttribution 4.0 (CC BY 4.0)https://creativecommons.org/licenses/by/4.0/
License information was derived automaticallyDescriptionThis dataset consists of 1 .xlsx file, 2 .png files, 1 .json file and 1 .zip file:annotation_details.xlsx: The distribution of annotations in the previously mentioned six classes (mitosis, apoptosis, tumor nuclei, non-tumor nuclei, tubule, and non-tubule) is presented in a Excel spreadsheet.original.png: The input image.annotated.png: An example from the dataset. In the annotated image, blue circles indicate the tumor nuclei, pink circles show non-tumor nuclei such as blood cells, stroma nuclei, and lymphocytes; orange and green circles are mitosis and apoptosis, respectively; light blue circles are true lumen for tubules, and yellow circles represent white regions (non-lumen) such as fat, blood vessel, and broken tissues.data.json: The annotations for the BreCaHAD dataset are provided in JSON (JavaScript Object Notation) format. In the given example, the JSON file (ground truth) contains two mitosis and only one tumor nuclei annotations. Here, x and y are the coordinates of the centroid of the annotated object, and the values are between 0, 1.BreCaHAD.zip: An archive file containing dataset. Three folders are included: images (original images), groundTruth (json files), and groundTruth_display (groundTruth applied on original images)
 FacebookTwitter
Attribution 4.0 (CC BY 4.0)https://creativecommons.org/licenses/by/4.0/
License information was derived automatically
Car-Highway Data Annotation Project
Introduction
In this project, we aim to annotate car images captured on highways. The annotated data will be used to train machine learning models for various computer vision tasks, such as object detection and classification.
Project Goals
- Collect a diverse dataset of car images from highway scenes.
- Annotate the dataset to identify and label cars within each image.
- Organize and format the annotated data for machine learning model training.
Tools and Technologies
For this project, we will be using Roboflow, a powerful platform for data annotation and preprocessing. Roboflow simplifies the annotation process and provides tools for data augmentation and transformation.
Annotation Process
- Upload the raw car images to the Roboflow platform.
- Use the annotation tools in Roboflow to draw bounding boxes around each car in the images.
- Label each bounding box with the corresponding class (e.g., car).
- Review and validate the annotations for accuracy.
Data Augmentation
Roboflow offers data augmentation capabilities, such as rotation, flipping, and resizing. These augmentations can help improve the model's robustness.
Data Export
Once the data is annotated and augmented, Roboflow allows us to export the dataset in various formats suitable for training machine learning models, such as YOLO, COCO, or TensorFlow Record.
Milestones
- Data Collection and Preprocessing
- Annotation of Car Images
- Data Augmentation
- Data Export
- Model Training
Conclusion
By completing this project, we will have a well-annotated dataset ready for training machine learning models. This dataset can be used for a wide range of applications in computer vision, including car detection and tracking on highways.