Meta Kaggle Code
- kaggle.com
zipUpdated Jul 31, 2025 Share
Share Facebook
 Twitter
 EmailClick to copy linkLink copiedCiteKaggle (2025). Meta Kaggle Code [Dataset]. https://www.kaggle.com/datasets/kaggle/meta-kaggle-code/codezip(151045619431 bytes)Available download formatsDataset updatedJul 31, 2025License
Apache License, v2.0https://www.apache.org/licenses/LICENSE-2.0
License information was derived automaticallyDescriptionExplore our public notebook content!
Meta Kaggle Code is an extension to our popular Meta Kaggle dataset. This extension contains all the raw source code from hundreds of thousands of public, Apache 2.0 licensed Python and R notebooks versions on Kaggle used to analyze Datasets, make submissions to Competitions, and more. This represents nearly a decade of data spanning a period of tremendous evolution in the ways ML work is done.
Why we’re releasing this dataset
By collecting all of this code created by Kaggle’s community in one dataset, we hope to make it easier for the world to research and share insights about trends in our industry. With the growing significance of AI-assisted development, we expect this data can also be used to fine-tune models for ML-specific code generation tasks.
Meta Kaggle for Code is also a continuation of our commitment to open data and research. This new dataset is a companion to Meta Kaggle which we originally released in 2016. On top of Meta Kaggle, our community has shared nearly 1,000 public code examples. Research papers written using Meta Kaggle have examined how data scientists collaboratively solve problems, analyzed overfitting in machine learning competitions, compared discussions between Kaggle and Stack Overflow communities, and more.
The best part is Meta Kaggle enriches Meta Kaggle for Code. By joining the datasets together, you can easily understand which competitions code was run against, the progression tier of the code’s author, how many votes a notebook had, what kinds of comments it received, and much, much more. We hope the new potential for uncovering deep insights into how ML code is written feels just as limitless to you as it does to us!
Sensitive data
While we have made an attempt to filter out notebooks containing potentially sensitive information published by Kaggle users, the dataset may still contain such information. Research, publications, applications, etc. relying on this data should only use or report on publicly available, non-sensitive information.
Joining with Meta Kaggle
The files contained here are a subset of the
KernelVersionsin Meta Kaggle. The file names match the ids in theKernelVersionscsv file. Whereas Meta Kaggle contains data for all interactive and commit sessions, Meta Kaggle Code contains only data for commit sessions.File organization
The files are organized into a two-level directory structure. Each top level folder contains up to 1 million files, e.g. - folder 123 contains all versions from 123,000,000 to 123,999,999. Each sub folder contains up to 1 thousand files, e.g. - 123/456 contains all versions from 123,456,000 to 123,456,999. In practice, each folder will have many fewer than 1 thousand files due to private and interactive sessions.
The ipynb files in this dataset hosted on Kaggle do not contain the output cells. If the outputs are required, the full set of ipynbs with the outputs embedded can be obtained from this public GCS bucket:
kaggle-meta-kaggle-code-downloads. Note that this is a "requester pays" bucket. This means you will need a GCP account with billing enabled to download. Learn more here: https://cloud.google.com/storage/docs/requester-paysQuestions / Comments
We love feedback! Let us know in the Discussion tab.
Happy Kaggling!
- h
Kaggle-post-and-comments-question-answer-topic
- huggingface.co
ShareFacebookTwitterEmailClick to copy linkLink copiedCiteDuverne Mathieu, Kaggle-post-and-comments-question-answer-topic [Dataset]. https://huggingface.co/datasets/Raaxx/Kaggle-post-and-comments-question-answer-topicCroissantCroissant is a format for machine-learning datasets. Learn more about this at mlcommons.org/croissant.AuthorsDuverne MathieuDescriptionThis is a dataset containing 10,000 posts from Kaggle and 60,000 comments related to those posts in the question-answer topic.
  Data Fields


  kaggle_post
'pseudo', The question authors. 'title', Title of the Post. 'question', The question's body. 'vote', Voting on Kaggle is similar to liking. 'medal', I will share with you the Kaggle medal system, which can be found at https://www.kaggle.com/progression. The system awards medals to users based on… See the full description on the dataset page: https://huggingface.co/datasets/Raaxx/Kaggle-post-and-comments-question-answer-topic.
Job Offers Web Scraping Search
- kaggle.com
Updated Feb 11, 2023ShareFacebookTwitterEmailClick to copy linkLink copiedCiteThe Devastator (2023). Job Offers Web Scraping Search [Dataset]. https://www.kaggle.com/datasets/thedevastator/job-offers-web-scraping-searchCroissantCroissant is a format for machine-learning datasets. Learn more about this at mlcommons.org/croissant.Dataset updatedFeb 11, 2023AuthorsThe DevastatorLicensehttps://creativecommons.org/publicdomain/zero/1.0/https://creativecommons.org/publicdomain/zero/1.0/
DescriptionJob Offers Web Scraping Search
Targeted Results to Find the Optimal Work Solution
By [source]
About this dataset
This dataset collects job offers from web scraping which are filtered according to specific keywords, locations and times. This data gives users rich and precise search capabilities to uncover the best working solution for them. With the information collected, users can explore options that match with their personal situation, skillset and preferences in terms of location and schedule. The columns provide detailed information around job titles, employer names, locations, time frames as well as other necessary parameters so you can make a smart choice for your next career opportunity
More Datasets
For more datasets, click here.
Featured Notebooks
- 🚨 Your notebook can be here! 🚨!
How to use the dataset
This dataset is a great resource for those looking to find an optimal work solution based on keywords, location and time parameters. With this information, users can quickly and easily search through job offers that best fit their needs. Here are some tips on how to use this dataset to its fullest potential:
Start by identifying what type of job offer you want to find. The keyword column will help you narrow down your search by allowing you to search for job postings that contain the word or phrase you are looking for.
Next, consider where the job is located – the Location column tells you where in the world each posting is from so make sure it’s somewhere that suits your needs!
Finally, consider when the position is available – look at the Time frame column which gives an indication of when each posting was made as well as if it’s a full-time/ part-time role or even if it’s a casual/temporary position from day one so make sure it meets your requirements first before applying!
Additionally, if details such as hours per week or further schedule information are important criteria then there is also info provided under Horari and Temps Oferta columns too! Now that all three criteria have been ticked off - key words, location and time frame - then take a look at Empresa (Company Name) and Nom_Oferta (Post Name) columns too in order to get an idea of who will be employing you should you land the gig!
All these pieces of data put together should give any motivated individual all they need in order to seek out an optimal work solution - keep hunting good luck!
Research Ideas
- Machine learning can be used to groups job offers in order to facilitate the identification of similarities and differences between them. This could allow users to specifically target their search for a work solution.
- The data can be used to compare job offerings across different areas or types of jobs, enabling users to make better informed decisions in terms of their career options and goals.
- It may also provide an insight into the local job market, enabling companies and employers to identify where there is potential for new opportunities or possible trends that simply may have previously gone unnoticed
Acknowledgements
If you use this dataset in your research, please credit the original authors. Data Source
License
License: CC0 1.0 Universal (CC0 1.0) - Public Domain Dedication No Copyright - You can copy, modify, distribute and perform the work, even for commercial purposes, all without asking permission. See Other Information.
Columns
File: web_scraping_information_offers.csv | Column name | Description | |:-----------------|:------------------------------------| | Nom_Oferta | Name of the job offer. (String) | | Empresa | Company offering the job. (String) | | Ubicació | Location of the job offer. (String) | | Temps_Oferta | Time of the job offer. (String) | | Horari | Schedule of the job offer. (String) |
Acknowledgements
If you use this dataset in your research, please credit the original authors. If you use this dataset in your research, please credit .
Data from: DistilKaggle: a distilled dataset of Kaggle Jupyter notebooks
- zenodo.org
application/gzip, bin +1Updated Jan 27, 2024ShareFacebookTwitterEmailClick to copy linkLink copiedCiteMojtaba Mostafavi Ghahfarokhi; Mojtaba Mostafavi Ghahfarokhi; Arash Asgari; Arash Asgari; Mohammad Abolnejadian; Mohammad Abolnejadian; Abbas Heydarnoori; Abbas Heydarnoori (2024). DistilKaggle: a distilled dataset of Kaggle Jupyter notebooks [Dataset]. http://doi.org/10.5281/zenodo.10317389bin, csv, application/gzipAvailable download formatsUnique identifierhttps://doi.org/10.5281/zenodo.10317389Dataset updatedJan 27, 2024AuthorsMojtaba Mostafavi Ghahfarokhi; Mojtaba Mostafavi Ghahfarokhi; Arash Asgari; Arash Asgari; Mohammad Abolnejadian; Mohammad Abolnejadian; Abbas Heydarnoori; Abbas HeydarnooriLicenseAttribution 4.0 (CC BY 4.0)https://creativecommons.org/licenses/by/4.0/
License information was derived automaticallyDescriptionOverview
DistilKaggle is a curated dataset extracted from Kaggle Jupyter notebooks spanning from September 2015 to October 2023. This dataset is a distilled version derived from the download of over 300GB of Kaggle kernels, focusing on essential data for research purposes. The dataset exclusively comprises publicly available Python Jupyter notebooks from Kaggle. The essential information for retrieving the data needed to download the dataset is obtained from the MetaKaggle dataset provided by Kaggle.
Contents
The DistilKaggle dataset consists of three main CSV files:
code.csv: Contains over 12 million rows of code cells extracted from the Kaggle kernels. Each row is identified by the kernel's ID and cell index for reproducibility.
markdown.csv: Includes over 5 million rows of markdown cells extracted from Kaggle kernels. Similar to code.csv, each row is identified by the kernel's ID and cell index.
notebook_metrics.csv: This file provides notebook features described in the accompanying paper released with this dataset. It includes metrics for over 517,000 Python notebooks.
Directory Structure
The kernels directory is organized based on Kaggle's Performance Tiers (PTs), a ranking system in Kaggle that classifies users. The structure includes PT-specific directories, each containing user ids that belong to this PT, download logs, and the essential data needed for downloading the notebooks.
The utility directory contains two important files:
aggregate_data.py: A Python script for aggregating data from different PTs into the mentioned CSV files.
application.ipynb: A Jupyter notebook serving as a simple example application using the metrics dataframe. It demonstrates predicting the PT of the author based on notebook metrics.
DistilKaggle.tar.gz: It is just the compressed version of the whole dataset. If you downloaded all of the other files independently already, there is no need to download this file.
Usage
Researchers can leverage this distilled dataset for various analyses without dealing with the bulk of the original 300GB dataset. For access to the raw, unprocessed Kaggle kernels, researchers can request the dataset directly.
Note
The original dataset of Kaggle kernels is substantial, exceeding 300GB, making it impractical for direct upload to Zenodo. Researchers interested in the full dataset can contact the dataset maintainers for access.
Citation
If you use this dataset in your research, please cite the accompanying paper or provide appropriate acknowledgment as outlined in the documentation.
If you have any questions regarding the dataset, don't hesitate to contact me at mohammad.abolnejadian@gmail.com
Thank you for using DistilKaggle!
issues-kaggle-notebooks
- huggingface.co
Updated Jul 8, 2025ShareFacebookTwitterEmailClick to copy linkLink copiedCiteHugging Face Smol Models Research (2025). issues-kaggle-notebooks [Dataset]. https://huggingface.co/datasets/HuggingFaceTB/issues-kaggle-notebooksDataset updatedJul 8, 2025AuthorsHugging Face Smol Models ResearchDescriptionGitHub Issues & Kaggle Notebooks
DescriptionGitHub Issues & Kaggle Notebooks is a collection of two code datasets intended for language models training, they are sourced from GitHub issues and notebooks in Kaggle platform. These datasets are a modified part of the StarCoder2 model training corpus, precisely the bigcode/StarCoder2-Extras dataset. We reformat the samples to remove StarCoder2's special tokens and use natural text to delimit comments in issues and display… See the full description on the dataset page: https://huggingface.co/datasets/HuggingFaceTB/issues-kaggle-notebooks.
LLM prompts in the context of machine learning
- kaggle.com
Updated Jul 1, 2024ShareFacebookTwitterEmailClick to copy linkLink copiedCiteJordan Nelson (2024). LLM prompts in the context of machine learning [Dataset]. https://www.kaggle.com/datasets/jordanln/llm-prompts-in-the-context-of-machine-learningCroissantCroissant is a format for machine-learning datasets. Learn more about this at mlcommons.org/croissant.Dataset updatedJul 1, 2024Dataset provided byKaggleAuthorsJordan NelsonLicensehttps://creativecommons.org/publicdomain/zero/1.0/https://creativecommons.org/publicdomain/zero/1.0/
DescriptionThis dataset is an extension of my previous work on creating a dataset for natural language processing tasks. It leverages binary representation to characterise various machine learning models. The attributes in the dataset are derived from a dictionary, which was constructed from a corpus of prompts typically provided to a large language model (LLM). These prompts reference specific machine learning algorithms and their implementations. For instance, consider a user asking an LLM or a generative AI to create a Multi-Layer Perceptron (MLP) model for a particular application. By applying this concept to multiple machine learning models, we constructed our corpus. This corpus was then transformed into the current dataset using a bag-of-words approach. In this dataset, each attribute corresponds to a word from our dictionary, represented as a binary value: 1 indicates the presence of the word in a given prompt, and 0 indicates its absence. At the end of each entry, there is a label. Each entry in the dataset pertains to a single class, where each class represents a distinct machine learning model or algorithm. This dataset is intended for multi-class classification tasks, not multi-label classification, as each entry is associated with only one label and does not belong to multiple labels simultaneously. This dataset has been utilised with a Convolutional Neural Network (CNN) using the Keras Automodel API, achieving impressive training and testing accuracy rates exceeding 97%. Post-training, the model's predictive performance was rigorously evaluated in a production environment, where it continued to demonstrate exceptional accuracy. For this evaluation, we employed a series of questions, which are listed below. These questions were intentionally designed to be similar to ensure that the model can effectively distinguish between different machine learning models, even when the prompts are closely related.
KNN How would you create a KNN model to classify emails as spam or not spam based on their content and metadata? How could you implement a KNN model to classify handwritten digits using the MNIST dataset? How would you use a KNN approach to build a recommendation system for suggesting movies to users based on their ratings and preferences? How could you employ a KNN algorithm to predict the price of a house based on features such as its location, size, and number of bedrooms etc? Can you create a KNN model for classifying different species of flowers based on their petal length, petal width, sepal length, and sepal width? How would you utilise a KNN model to predict the sentiment (positive, negative, or neutral) of text reviews or comments? Can you create a KNN model for me that could be used in malware classification? Can you make me a KNN model that can detect a network intrusion when looking at encrypted network traffic? Can you make a KNN model that would predict the stock price of a given stock for the next week? Can you create a KNN model that could be used to detect malware when using a dataset relating to certain permissions a piece of software may have access to?
Decision Tree Can you describe the steps involved in building a decision tree model to classify medical images as malignant or benign for cancer diagnosis and return a model for me? How can you utilise a decision tree approach to develop a model for classifying news articles into different categories (e.g., politics, sports, entertainment) based on their textual content? What approach would you take to create a decision tree model for recommending personalised university courses to students based on their academic strengths and weaknesses? Can you describe how to create a decision tree model for identifying potential fraud in financial transactions based on transaction history, user behaviour, and other relevant data? In what ways might you apply a decision tree model to classify customer complaints into different categories determining the severity of language used? Can you create a decision tree classifier for me? Can you make me a decision tree model that will help me determine the best course of action across a given set of strategies? Can you create a decision tree model for me that can recommend certain cars to customers based on their preferences and budget? How can you make a decision tree model that will predict the movement of star constellations in the sky based on data provided by the NASA website? How do I create a decision tree for time-series forecasting?
Random Forest Can you describe the steps involved in building a random forest model to classify different types of anomalies in network traffic data for cybersecurity purposes and return the code for me? In what ways could you implement a random forest model to predict the severity of traffic congestion in urban areas based on historical traffic patterns, weather...
- A
‘School Dataset’ analyzed by Analyst-2
- analyst-2.ai
Updated Feb 13, 2022ShareFacebookTwitterEmailClick to copy linkLink copiedCiteAnalyst-2 (analyst-2.ai) / Inspirient GmbH (inspirient.com) (2022). ‘School Dataset’ analyzed by Analyst-2 [Dataset]. https://analyst-2.ai/analysis/kaggle-school-dataset-3c70/2a80983f/?iid=004-128&v=presentationDataset updatedFeb 13, 2022Dataset authored and provided byAnalyst-2 (analyst-2.ai) / Inspirient GmbH (inspirient.com)LicenseAttribution 4.0 (CC BY 4.0)https://creativecommons.org/licenses/by/4.0/
License information was derived automaticallyDescriptionAnalysis of ‘School Dataset’ provided by Analyst-2 (analyst-2.ai), based on source dataset retrieved from https://www.kaggle.com/smeilisa07/number of school teacher student class on 13 February 2022.
--- Dataset description provided by original source is as follows ---
Context
This is my first analyst data. This dataset i got from open data Jakarta website (http://data.jakarta.go.id/), so mostly the dataset is in Indonesian. But i have try describe it that you can find it on VARIABLE DESCRIPTION.txt file.
Content
The title of this dataset is jumlah-sekolah-guru-murid-dan-ruang-kelas-menurut-jenis-sekolah-2011-2016, with type is CSV, so you can easily access it. If you not understand, the title means the number of school, teacher, student, and classroom according to the type of school 2011 - 2016. I think, if you just read from the title, you can imagine the contents. So this dataset have 50 observations and 8 variables, taken from 2011 until 2016.
In general, this dataset is about the quality of education in Jakarta, which each year some of school level always decreasing and some is increase, but not significant.
Acknowledgements
This dataset comes from Indonesian education authorities, which is already established in the CSV file by Open Data Jakarta.
Inspiration
Althought this data given from Open Data Jakarta publicly, i want always continue to improve my Data Scientist skill, especially in R programming, because i think R programming is easy to learn and really help me to be always curious about Data Scientist. So, this dataset that I am still struggle with below problem, and i need solution.
Question :
How can i cleaning this dataset ? I have try cleaning this dataset, but i still not sure. You can check on
my_hypothesis.txt file, when i try cleaning and visualize this dataset.How can i specify the model for machine learning ? What recommended steps i should take ?
How should i cluster my dataset, if i want the label is not number but tingkat_sekolah for every tahun and
jenis_sekolah ? You can check on my_hypothesis.txt file.
--- Original source retains full ownership of the source dataset ---
- A
‘🍺 The cost of a beer at MLB stadiums by Year,City’ analyzed by Analyst-2
- analyst-2.ai
Updated Jan 25, 2022ShareFacebookTwitterEmailClick to copy linkLink copiedCiteAnalyst-2 (analyst-2.ai) / Inspirient GmbH (inspirient.com) (2022). ‘🍺 The cost of a beer at MLB stadiums by Year,City’ analyzed by Analyst-2 [Dataset]. https://analyst-2.ai/analysis/kaggle-the-cost-of-a-beer-at-mlb-stadiums-by-year-city-cb30/91a918c5/?iid=003-425&v=presentationDataset updatedJan 25, 2022Dataset authored and provided byAnalyst-2 (analyst-2.ai) / Inspirient GmbH (inspirient.com)LicenseAttribution 4.0 (CC BY 4.0)https://creativecommons.org/licenses/by/4.0/
License information was derived automaticallyDescriptionAnalysis of ‘🍺 The cost of a beer at MLB stadiums by Year,City’ provided by Analyst-2 (analyst-2.ai), based on source dataset retrieved from https://www.kaggle.com/yamqwe/2018-w43-the-cost-of-a-beer-at-mlb-stadiumse on 13 February 2022.
--- Dataset description provided by original source is as follows ---
About this dataset
Original Visualization
https://media.data.world/f4ft32PQCGRBTGWezGS7_Screen%20Shot%202018-10-17%20at%208.15.36%20pm.png" alt="Screen Shot 2018-10-17 at 8.15.36 pm.png">
About this Dataset
- ORIGINAL VISUALIZATION: VizWiz
- SOURCE: Team Marketing Report
Objectives
- What works and what doesn't work with this chart?
- How can you make it better?
- Post your alternative on the discussions page.
This dataset was created by Andy Kriebel and contains around 200 samples along with City, Year, technical information and other features such as: - Size - Nickname - and more.
How to use this dataset
- Analyze Price in relation to Price Per Ounce
- Study the influence of Team on City
- More datasets
Acknowledgements
If you use this dataset in your research, please credit Andy Kriebel
Start A New Notebook!
--- Original source retains full ownership of the source dataset ---
- A
‘🍫 What is the UK's favorite chocolate’ analyzed by Analyst-2
- analyst-2.ai
Updated Jan 25, 2022ShareFacebookTwitterEmailClick to copy linkLink copiedCiteAnalyst-2 (analyst-2.ai) / Inspirient GmbH (inspirient.com) (2022). ‘🍫 What is the UK's favorite chocolate’ analyzed by Analyst-2 [Dataset]. https://analyst-2.ai/analysis/kaggle-what-is-the-uk-s-favorite-chocolate-77ba/latestDataset updatedJan 25, 2022Dataset authored and provided byAnalyst-2 (analyst-2.ai) / Inspirient GmbH (inspirient.com)LicenseAttribution 4.0 (CC BY 4.0)https://creativecommons.org/licenses/by/4.0/
License information was derived automaticallyArea coveredUnited KingdomDescriptionAnalysis of ‘🍫 What is the UK's favorite chocolate’ provided by Analyst-2 (analyst-2.ai), based on source dataset retrieved from https://www.kaggle.com/yamqwe/2018-w13-what-is-the-uk-s-favorite-chocolate-bare on 13 February 2022.
--- Dataset description provided by original source is as follows ---
About this dataset
The Easter Bunny is coming this week, so let's have a great debate! What is the UK's favorite chocolate?
Original Visualization
https://media.data.world/VKLPxYYFRyUeeoCc6Jgj_Screen%20Shot%202018-03-25%20at%2010.32.12%20am.png" alt="Image" style="">
About this Dataset
SOURCE: CDA
Objectives
- What works and what doesn't work with this chart?
- How can you make it better?
- Post your alternative on the discussions page.
This dataset was created by Andy Kriebel and contains around 0 samples along with Rank, Brand, technical information and other features such as: - Age Group - Rank - and more.
How to use this dataset
- Analyze Brand in relation to Age Group
- Study the influence of Rank on Brand
- More datasets
Acknowledgements
If you use this dataset in your research, please credit Andy Kriebel
Start A New Notebook!
--- Original source retains full ownership of the source dataset ---
- R
Cherry Tomato Kaggle Dataset
- universe.roboflow.com
zipUpdated Jun 3, 2024ShareFacebookTwitterEmailClick to copy linkLink copiedCite(2024). Cherry Tomato Kaggle Dataset [Dataset]. https://universe.roboflow.com/project-6jvsr/cherry-tomato-kagglezipAvailable download formatsDataset updatedJun 3, 2024LicenseAttribution 4.0 (CC BY 4.0)https://creativecommons.org/licenses/by/4.0/
License information was derived automaticallyVariables measuredCherry Tomato GicD Bounding BoxesDescriptionCherry Tomato Kaggle
## Overview Cherry Tomato Kaggle is a dataset for object detection tasks - it contains Cherry Tomato GicD annotations for 962 images. ## Getting Started You can download this dataset for use within your own projects, or fork it into a workspace on Roboflow to create your own model. ## License This dataset is available under the [CC BY 4.0 license](https://creativecommons.org/licenses/CC BY 4.0). - A
‘Amazon Product Reviews Dataset’ analyzed by Analyst-2
- analyst-2.ai
Updated Feb 13, 2022ShareFacebookTwitterEmailClick to copy linkLink copiedCiteAnalyst-2 (analyst-2.ai) / Inspirient GmbH (inspirient.com) (2022). ‘Amazon Product Reviews Dataset’ analyzed by Analyst-2 [Dataset]. https://analyst-2.ai/analysis/kaggle-amazon-product-reviews-dataset-7933/latestDataset updatedFeb 13, 2022Dataset authored and provided byAnalyst-2 (analyst-2.ai) / Inspirient GmbH (inspirient.com)LicenseAttribution 4.0 (CC BY 4.0)https://creativecommons.org/licenses/by/4.0/
License information was derived automaticallyDescriptionAnalysis of ‘Amazon Product Reviews Dataset’ provided by Analyst-2 (analyst-2.ai), based on source dataset retrieved from https://www.kaggle.com/yamqwe/amazon-product-reviews-datasete on 13 February 2022.
--- Dataset description provided by original source is as follows ---
About this dataset
This dataset contains 30K records of product reviews from amazon.com.
This dataset was created by PromptCloud and DataStock
Content
This dataset contains the following:
-
Total Records Count: 43729
-
Domain Name: amazon.com
-
Date Range: 01st Jan 2020 - 31st Mar 2020
-
File Extension: CSV
-
Available Fields:
-- Uniq Id,
-- Crawl Timestamp,
-- Billing Uniq Id,
-- Rating,
-- Review Title,
-- Review Rating,
-- Review Date,
-- User Id,
-- Brand,
-- Category,
-- Sub Category,
-- Product Description,
-- Asin,
-- Url,
-- Review Content,
-- Verified Purchase,
-- Helpful Review Count,
-- Manufacturer Response
Acknowledgements
We wouldn't be here without the help of our in house teams at PromptCloud and DataStock. Who has put their heart and soul into this project like all other projects? We want to provide the best quality data and we will continue to do so.
Inspiration
The inspiration for these datasets came from research. Reviews are something that is important wit everybody across the globe. So we decided to come up with this dataset that shows us exactly how the user reviews help companies to better their products.
This dataset was created by PromptCloud and contains around 0 samples along with Billing Uniq Id, Verified Purchase, technical information and other features such as: - Crawl Timestamp - Manufacturer Response - and more.
How to use this dataset
- Analyze Helpful Review Count in relation to Sub Category
- Study the influence of Review Date on Product Description
- More datasets
Acknowledgements
If you use this dataset in your research, please credit PromptCloud
Start A New Notebook!
--- Original source retains full ownership of the source dataset ---
- Z
Doodleverse/Segmentation Zoo/Seg2Map Res-UNet models for DeepGlobe/7-class...
- data.niaid.nih.gov
- zenodo.org
Updated Jul 12, 2024ShareFacebookTwitterEmailClick to copy linkLink copiedCiteBuscombe, Daniel (2024). Doodleverse/Segmentation Zoo/Seg2Map Res-UNet models for DeepGlobe/7-class segmentation of RGB 512x512 high-res. images [Dataset]. https://data.niaid.nih.gov/resources?id=zenodo_7576897Dataset updatedJul 12, 2024Dataset authored and provided byBuscombe, DanielLicenseAttribution 4.0 (CC BY 4.0)https://creativecommons.org/licenses/by/4.0/
License information was derived automaticallyDescriptionDoodleverse/Segmentation Zoo/Seg2Map Res-UNet models for DeepGlobe/7-class segmentation of RGB 512x512 high-res. images
These Residual-UNet model data are based on the DeepGlobe dataset
Models have been created using Segmentation Gym* using the following dataset**: https://www.kaggle.com/datasets/balraj98/deepglobe-land-cover-classification-dataset
Image size used by model: 512 x 512 x 3 pixels
classes: 1. urban 2. agricultural 3. rangeland 4. forest 5. water 6. bare 7. unknown
File descriptions
For each model, there are 5 files with the same root name:
'.json' config file: this is the file that was used by Segmentation Gym* to create the weights file. It contains instructions for how to make the model and the data it used, as well as instructions for how to use the model for prediction. It is a handy wee thing and mastering it means mastering the entire Doodleverse.
'.h5' weights file: this is the file that was created by the Segmentation Gym* function
train_model.py. It contains the trained model's parameter weights. It can called by the Segmentation Gym* functionseg_images_in_folder.py. Models may be ensembled.'_modelcard.json' model card file: this is a json file containing fields that collectively describe the model origins, training choices, and dataset that the model is based upon. There is some redundancy between this file and the
configfile (described above) that contains the instructions for the model training and implementation. The model card file is not used by the program but is important metadata so it is important to keep with the other files that collectively make the model and is such is considered part of the model'_model_history.npz' model training history file: this numpy archive file contains numpy arrays describing the training and validation losses and metrics. It is created by the Segmentation Gym function
train_model.py'.png' model training loss and mean IoU plot: this png file contains plots of training and validation losses and mean IoU scores during model training. A subset of data inside the .npz file. It is created by the Segmentation Gym function
train_model.py
Additionally, BEST_MODEL.txt contains the name of the model with the best validation loss and mean IoU
References *Segmentation Gym: Buscombe, D., & Goldstein, E. B. (2022). A reproducible and reusable pipeline for segmentation of geoscientific imagery. Earth and Space Science, 9, e2022EA002332. https://doi.org/10.1029/2022EA002332 See: https://github.com/Doodleverse/segmentation_gym
**Demir, I., Koperski, K., Lindenbaum, D., Pang, G., Huang, J., Basu, S., Hughes, F., Tuia, D. and Raskar, R., 2018. Deepglobe 2018: A challenge to parse the earth through satellite images. In Proceedings of the IEEE Conference on Computer Vision and Pattern Recognition Workshops (pp. 172-181).
- A
‘Women's International Football Results’ analyzed by Analyst-2
- analyst-2.ai
ShareFacebookTwitterEmailClick to copy linkLink copiedCiteAnalyst-2 (analyst-2.ai) / Inspirient GmbH (inspirient.com), ‘Women's International Football Results’ analyzed by Analyst-2 [Dataset]. https://analyst-2.ai/analysis/kaggle-women-s-international-football-results-bda3/531389dd/?iid=005-704&v=presentationDataset authored and provided byAnalyst-2 (analyst-2.ai) / Inspirient GmbH (inspirient.com)LicenseAttribution 4.0 (CC BY 4.0)https://creativecommons.org/licenses/by/4.0/
License information was derived automaticallyDescriptionAnalysis of ‘Women's International Football Results’ provided by Analyst-2 (analyst-2.ai), based on source dataset retrieved from https://www.kaggle.com/martj42/womens-international-football-results on 28 January 2022.
--- Dataset description provided by original source is as follows ---
Context
This is a work-in-progress sister data set to the men's international football results dataset. If you're interested in helping out, submit a pull request here.
Content
Currently, the dataset includes 4,169 women's international football results. All major tournament results should be complete. Some international friendlies, particularly tournaments, are included. A LOT of results are not yet in the dataset.
results.csvincludes the following columns:date- date of the matchhome_team- the name of the home teamaway_team- the name of the away teamhome_score- full-time home team score including extra time, not including penalty-shootoutsaway_score- full-time away team score including extra time, not including penalty-shootoutstournament- the name of the tournamentcity- the name of the city/town/administrative unit where the match was playedcountry- the name of the country where the match was playedneutral- TRUE/FALSE column indicating whether the match was played at a neutral venue
Acknowledgements
The data is gathered from several sources including but not limited to Wikipedia, fifa.com, rsssf.com and individual football associations' websites.
Inspiration
Some directions to take when exploring the data:
- Who is the best team of all time
- Which teams dominated different eras of football
- What trends have there been in international football throughout the ages - home advantage, total goals scored, distribution of teams' strength etc
- Can we say anything about geopolitics from football fixtures - how has the number of countries changed, which teams like to play each other
- Which countries host the most matches where they themselves are not participating in
- How much, if at all, does hosting a major tournament help a country's chances in the tournament
- Which teams are the most active in playing friendlies and friendly tournaments - does it help or hurt them
The world's your oyster, my friend.
Contribute
If you notice a mistake or the results are being updated fast enough for your liking, you can fix that by submitting a pull request on github.
✌🏼✌🏼✌🏼
--- Original source retains full ownership of the source dataset ---
Synthetic Dyslexia Handwriting Dataset (YOLO-Format)
- zenodo.org
zipUpdated Feb 11, 2025ShareFacebookTwitterEmailClick to copy linkLink copiedCiteNora Fink; Nora Fink (2025). Synthetic Dyslexia Handwriting Dataset (YOLO-Format) [Dataset]. http://doi.org/10.5281/zenodo.14852659zipAvailable download formatsUnique identifierhttps://doi.org/10.5281/zenodo.14852659Dataset updatedFeb 11, 2025AuthorsNora Fink; Nora FinkLicenseAttribution 4.0 (CC BY 4.0)https://creativecommons.org/licenses/by/4.0/
License information was derived automaticallyDescriptionDescription
This synthetic dataset has been generated to facilitate object detection (in YOLO format) for research on dyslexia-related handwriting patterns. It builds upon an original corpus of uppercase and lowercase letters obtained from multiple sources: the NIST Special Database 19 111, the Kaggle dataset “A-Z Handwritten Alphabets in .csv format” 222, as well as handwriting samples from dyslexic primary school children of Seberang Jaya, Penang (Malaysia).In the original dataset, uppercase letters originated from NIST Special Database 19, while lowercase letters came from the Kaggle dataset curated by S. Patel. Additional images (categorized as Normal, Reversal, and Corrected) were collected and labeled based on handwriting samples of dyslexic and non-dyslexic students, resulting in:
- 78,275 images labeled as Normal
- 52,196 images labeled as Reversal
- 8,029 images labeled as Corrected
Building upon this foundation, the Synthetic Dyslexia Handwriting Dataset presented here was programmatically generated to produce labeled examples suitable for training and validating object detection models. Each synthetic image arranges multiple letters of various classes (Normal, Reversal, Corrected) in a “text line” style on a black background, providing YOLO-compatible
.txtannotations that specify bounding boxes for each letter.Key Points of the Synthetic Generation Process
- Letter-Level Source Data
Individual characters were sampled from the original image sets. - Randomized Layout
Letters are randomly assembled into words and lines, ensuring a wide variety of visual arrangements. - Bounding Box Labels
Each character is assigned a bounding box with(x, y, width, height)in YOLO format. - Class Annotations
Classes include0 = Normal,1 = Reversal, and2 = Corrected. - Preservation of Visual Characteristics
Letters retain their key dyslexia-relevant features (e.g., reversals).
Historical References & Credits
If you are using this synthetic dataset or the original Dyslexia Handwriting Dataset, please cite the following papers:
- M. S. A. B. Rosli, I. S. Isa, S. A. Ramlan, S. N. Sulaiman and M. I. F. Maruzuki, "Development of CNN Transfer Learning for Dyslexia Handwriting Recognition," 2021 11th IEEE International Conference on Control System, Computing and Engineering (ICCSCE), 2021, pp. 194–199, doi: 10.1109/ICCSCE52189.2021.9530971.
- N. S. L. Seman, I. S. Isa, S. A. Ramlan, W. Li-Chih and M. I. F. Maruzuki, "Notice of Removal: Classification of Handwriting Impairment Using CNN for Potential Dyslexia Symptom," 2021 11th IEEE International Conference on Control System, Computing and Engineering (ICCSCE), 2021, pp. 188–193, doi: 10.1109/ICCSCE52189.2021.9530989.
- Isa, Iza Sazanita. CNN Comparisons Models On Dyslexia Handwriting Classification / Iza Sazanita Isa … [et Al.]. Universiti Teknologi MARA Cawangan Pulau Pinang, 2021.
- Isa, I. S., Rahimi, W. N. S., Ramlan, S. A., & Sulaiman, S. N. (2019). Automated detection of dyslexia symptom based on handwriting image for primary school children. Procedia Computer Science, 163, 440–449.
References to Original Data Sources
111 P. J. Grother, “NIST Special Database 19,” NIST, 2016. [Online]. Available:
https://www.nist.gov/srd/nist-special-database-19222 S. Patel, “A-Z Handwritten Alphabets in .csv format,” Kaggle, 2017. [Online]. Available:
https://www.kaggle.com/sachinpatel21/az-handwritten-alphabets-in-csv-formatUsage & Citation
Researchers and practitioners are encouraged to integrate this synthetic dataset into their computer vision pipelines for tasks such as dyslexia pattern analysis, character recognition, and educational technology development. Please cite the original authors and publications if you utilize this synthetic dataset in your work.
Password Note (Original Data)
The original RAR file was password-protected with the password: WanAsy321. This synthetic dataset, however, is provided openly for streamlined usage.
- A
‘E-Learning Student Reactions’ analyzed by Analyst-2
- analyst-2.ai
Updated Jul 15, 2019ShareFacebookTwitterEmailClick to copy linkLink copiedCiteAnalyst-2 (analyst-2.ai) / Inspirient GmbH (inspirient.com) (2019). ‘E-Learning Student Reactions’ analyzed by Analyst-2 [Dataset]. https://analyst-2.ai/analysis/kaggle-e-learning-student-reactions-78e7/latestDataset updatedJul 15, 2019Dataset authored and provided byAnalyst-2 (analyst-2.ai) / Inspirient GmbH (inspirient.com)LicenseAttribution 4.0 (CC BY 4.0)https://creativecommons.org/licenses/by/4.0/
License information was derived automaticallyDescriptionAnalysis of ‘E-Learning Student Reactions’ provided by Analyst-2 (analyst-2.ai), based on source dataset retrieved from https://www.kaggle.com/marlonferrari/elearning-student-reactions on 14 February 2022.
--- Dataset description provided by original source is as follows ---
Understanding student's online behavior and their relations inside real class gradings
This Dataset was compiled after 4 months of an Algorithm Introductory Class at a Brazilian University.
A traditional grading system was adopted for evaluation of the students performance, and, at the same time, an online environment let students share posts, answers and classify productions with emojis-based reactions.
The Class was project-based and the evaluation of the skills followed the so-called "21th Century Skills", in a scale from 0 to 10 each Skill:
* Critical Thinking and Problem Solving Skills - named as SK1; * Criativity and Inovation Skills - named as SK2; * Constant and Self Learning Skills - named as SK3; * Collaboration and Self-Direction Skills - named as SK4; * Social and Cultural Responsability - named as SK5.At the online learning environment, the students could post and classify colleagues postings with some reactions. The next image show a post with the reactions given by other students about a coding solution:
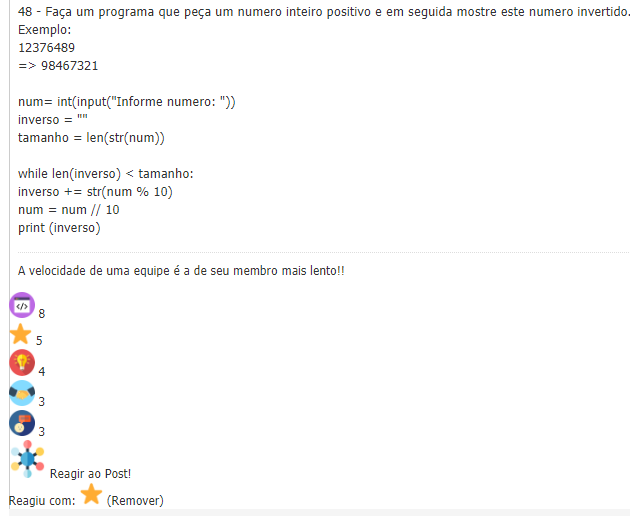Our main question is: What is link between the reactions and the skill levels shown by the student? Is there some sort of interesting findings? Good luck and share your work!
Reactions
Each student was allowed to classify up to 10 reactions/day, one reaction type per post, in posts created by other colleagues. There was available the following reactions (as wink-like image format):
 * Confusing post * Amazing post * Bad post * Creative post * Collaborative post * Nice Code post * Helpful postThis way, one student could give all the 7 reactions in one post, but there was a limit of 10 reactions per day.
Final Student Result
The last column of the dataset brings if the student was approved or not at the class. The final result was a simple average between the 5 skills.
Inspiration
Our inspiration was based under some researches discussing the use of social features inside real classroom projects and its contributions to the student identity and active behavior.
--- Original source retains full ownership of the source dataset ---
- A
‘🎗️ Cancer Rates by U.S. State’ analyzed by Analyst-2
- analyst-2.ai
Updated Feb 13, 2022ShareFacebookTwitterEmailClick to copy linkLink copiedCiteAnalyst-2 (analyst-2.ai) / Inspirient GmbH (inspirient.com) (2022). ‘🎗️ Cancer Rates by U.S. State’ analyzed by Analyst-2 [Dataset]. https://analyst-2.ai/analysis/kaggle-cancer-rates-by-u-s-state-5f6a/af56eb24/?iid=000-919&v=presentationDataset updatedFeb 13, 2022Dataset authored and provided byAnalyst-2 (analyst-2.ai) / Inspirient GmbH (inspirient.com)LicenseAttribution 4.0 (CC BY 4.0)https://creativecommons.org/licenses/by/4.0/
License information was derived automaticallyArea coveredUnited StatesDescriptionAnalysis of ‘🎗️ Cancer Rates by U.S. State’ provided by Analyst-2 (analyst-2.ai), based on source dataset retrieved from https://www.kaggle.com/yamqwe/cancer-rates-by-u-s-statee on 13 February 2022.
--- Dataset description provided by original source is as follows ---
About this dataset
In the following maps, the U.S. states are divided into groups based on the rates at which people developed or died from cancer in 2013, the most recent year for which incidence data are available.
The rates are the numbers out of 100,000 people who developed or died from cancer each year.
Incidence Rates by State
The number of people who get cancer is called cancer incidence. In the United States, the rate of getting cancer varies from state to state.-
*Rates are per 100,000 and are age-adjusted to the 2000 U.S. standard population.
-
‡Rates are not shown if the state did not meet USCS publication criteria or if the state did not submit data to CDC.
-
†Source: U.S. Cancer Statistics Working Group. United States Cancer Statistics: 1999–2013 Incidence and Mortality Web-based Report. Atlanta (GA): Department of Health and Human Services, Centers for Disease Control and Prevention, and National Cancer Institute; 2016. Available at: http://www.cdc.gov/uscs.
Death Rates by State
Rates of dying from cancer also vary from state to state.-
*Rates are per 100,000 and are age-adjusted to the 2000 U.S. standard population.
-
†Source: U.S. Cancer Statistics Working Group. United States Cancer Statistics: 1999–2013 Incidence and Mortality Web-based Report. Atlanta (GA): Department of Health and Human Services, Centers for Disease Control and Prevention, and National Cancer Institute; 2016. Available at: http://www.cdc.gov/uscs.
Source: https://www.cdc.gov/cancer/dcpc/data/state.htm
This dataset was created by Adam Helsinger and contains around 100 samples along with Range, Rate, technical information and other features such as: - Range - Rate - and more.
How to use this dataset
- Analyze Range in relation to Rate
- Study the influence of Range on Rate
- More datasets
Acknowledgements
If you use this dataset in your research, please credit Adam Helsinger
Start A New Notebook!
--- Original source retains full ownership of the source dataset ---
- A
‘College Football Bowl Games’ analyzed by Analyst-2
- analyst-2.ai
Updated Feb 13, 2022ShareFacebookTwitterEmailClick to copy linkLink copiedCiteAnalyst-2 (analyst-2.ai) / Inspirient GmbH (inspirient.com) (2022). ‘College Football Bowl Games’ analyzed by Analyst-2 [Dataset]. https://analyst-2.ai/analysis/kaggle-college-football-bowl-games-efe5/9866ff9c/Dataset updatedFeb 13, 2022Dataset authored and provided byAnalyst-2 (analyst-2.ai) / Inspirient GmbH (inspirient.com)LicenseAttribution 4.0 (CC BY 4.0)https://creativecommons.org/licenses/by/4.0/
License information was derived automaticallyDescriptionAnalysis of ‘College Football Bowl Games’ provided by Analyst-2 (analyst-2.ai), based on source dataset retrieved from https://www.kaggle.com/yamqwe/college-football-bowl-gamese on 13 February 2022.
--- Dataset description provided by original source is as follows ---
About this dataset
Background
Home field advantage is always the most desirable, but does data back it up? I’ve pulled stats on college football bowl games to see if having the home field advantage is all it is cracked up to be.
Methodology
The data collected was scraped from www.foxsports.com.
Source
The research and blog post can be found at The Concept Center
This dataset was created by Chase Willden and contains around 20000 samples along with Receiving Receiving Yards, Kicking Pat Made, technical information and other features such as: - Kick Return Kick Return Touchdowns - Passing Completions - and more.
How to use this dataset
- Analyze Kick Return Kick Return Avg in relation to Punt Return Punt Return Long
- Study the influence of Kicking Kicking Points on Kick Return Kick Return Long
- More datasets
Acknowledgements
If you use this dataset in your research, please credit Chase Willden
Start A New Notebook!
--- Original source retains full ownership of the source dataset ---
- A
‘Predicting Facebook Posts Impact ’ analyzed by Analyst-2
- analyst-2.ai
Updated Feb 13, 2022ShareFacebookTwitterEmailClick to copy linkLink copiedCiteAnalyst-2 (analyst-2.ai) / Inspirient GmbH (inspirient.com) (2022). ‘Predicting Facebook Posts Impact ’ analyzed by Analyst-2 [Dataset]. https://analyst-2.ai/analysis/kaggle-predicting-facebook-posts-impact-9ed2/9996b9b0/?iid=010-811&v=presentationDataset updatedFeb 13, 2022Dataset authored and provided byAnalyst-2 (analyst-2.ai) / Inspirient GmbH (inspirient.com)LicenseAttribution 4.0 (CC BY 4.0)https://creativecommons.org/licenses/by/4.0/
License information was derived automaticallyDescriptionAnalysis of ‘Predicting Facebook Posts Impact ’ provided by Analyst-2 (analyst-2.ai), based on source dataset retrieved from https://www.kaggle.com/yamqwe/predicting-facebook-posts-impact on 13 February 2022.
--- Dataset description provided by original source is as follows ---
About this dataset
- The data is related to posts' published during the year of 2014 on the Facebook's page of a renowned cosmetics brand. This dataset contains 500 of the 790 rows and part of the features analyzed by Moro et al. (2016). It includes 7 features known prior to post-publication and 12 features for evaluating post-impact along with other Techincal information such as:
- Is it an Image or a Status
- Time & Date
- and more.
How to use this dataset
- Estimate how to post the most impactful facebook post
- More datasets
Acknowledgements
If you use this dataset in your research, please credit The Author
--- Original source retains full ownership of the source dataset ---
- A
‘What The World Thinks Of Trump?’ analyzed by Analyst-2
- analyst-2.ai
Updated Aug 4, 2020ShareFacebookTwitterEmailClick to copy linkLink copiedCiteAnalyst-2 (analyst-2.ai) / Inspirient GmbH (inspirient.com) (2020). ‘What The World Thinks Of Trump?’ analyzed by Analyst-2 [Dataset]. https://analyst-2.ai/analysis/kaggle-what-the-world-thinks-of-trump-9a66/ef5d3ea5/?iid=007-925&v=presentationDataset updatedAug 4, 2020Dataset authored and provided byAnalyst-2 (analyst-2.ai) / Inspirient GmbH (inspirient.com)LicenseAttribution 4.0 (CC BY 4.0)https://creativecommons.org/licenses/by/4.0/
License information was derived automaticallyArea coveredWorldDescriptionAnalysis of ‘What The World Thinks Of Trump?’ provided by Analyst-2 (analyst-2.ai), based on source dataset retrieved from https://www.kaggle.com/yamqwe/trump-world-truste on 28 January 2022.
--- Dataset description provided by original source is as follows ---
About this dataset
See Readme for more details.
This repository contains a selection of the data -- and the data-processing scripts -- behind the articles, graphics and interactives at FiveThirtyEight.2017-09-18What The World Thinks Of Trump
We hope you'll use it to check our work and to create stories and visualizations of your own. The data is available under the Creative Commons Attribution 4.0 International License and the code is available under the MIT License. If you do find it useful, please let us know.
Source: https://github.com/fivethirtyeight/data
This dataset was created by FiveThirtyEight and contains around 0 samples along with Hungary, South Africa, technical information and other features such as: - Brazil - Kenya - and more.
How to use this dataset
- Analyze Russia in relation to Japan
- Study the influence of Uk on Spain
- More datasets
Acknowledgements
If you use this dataset in your research, please credit FiveThirtyEight
Start A New Notebook!
--- Original source retains full ownership of the source dataset ---
- A
‘Population by Country - 2020’ analyzed by Analyst-2
- analyst-2.ai
Updated Feb 13, 2020ShareFacebookTwitterEmailClick to copy linkLink copiedCiteAnalyst-2 (analyst-2.ai) / Inspirient GmbH (inspirient.com) (2020). ‘Population by Country - 2020’ analyzed by Analyst-2 [Dataset]. https://analyst-2.ai/analysis/kaggle-population-by-country-2020-c8b7/latestDataset updatedFeb 13, 2020Dataset authored and provided byAnalyst-2 (analyst-2.ai) / Inspirient GmbH (inspirient.com)LicenseAttribution 4.0 (CC BY 4.0)https://creativecommons.org/licenses/by/4.0/
License information was derived automaticallyDescriptionAnalysis of ‘Population by Country - 2020’ provided by Analyst-2 (analyst-2.ai), based on source dataset retrieved from https://www.kaggle.com/tanuprabhu/population-by-country-2020 on 28 January 2022.
--- Dataset description provided by original source is as follows ---
Context
I always wanted to access a data set that was related to the world’s population (Country wise). But I could not find a properly documented data set. Rather, I just created one manually.
Content
Now I knew I wanted to create a dataset but I did not know how to do so. So, I started to search for the content (Population of countries) on the internet. Obviously, Wikipedia was my first search. But I don't know why the results were not acceptable. And also there were only I think 190 or more countries. So then I surfed the internet for quite some time until then I stumbled upon a great website. I think you probably have heard about this. The name of the website is Worldometer. This is exactly the website I was looking for. This website had more details than Wikipedia. Also, this website had more rows I mean more countries with their population.
Once I got the data, now my next hard task was to download it. Of course, I could not get the raw form of data. I did not mail them regarding the data. Now I learned a new skill which is very important for a data scientist. I read somewhere that to obtain the data from websites you need to use this technique. Any guesses, keep reading you will come to know in the next paragraph.
https://fiverr-res.cloudinary.com/images/t_main1,q_auto,f_auto/gigs/119580480/original/68088c5f588ec32a6b3a3a67ec0d1b5a8a70648d/do-web-scraping-and-data-mining-with-python.png" alt="alt text">
You are right its, Web Scraping. Now I learned this so that I could convert the data into a CSV format. Now I will give you the scraper code that I wrote and also I somehow found a way to directly convert the pandas data frame to a CSV(Comma-separated fo format) and store it on my computer. Now just go through my code and you will know what I'm talking about.
Below is the code that I used to scrape the code from the website
https://www.googleapis.com/download/storage/v1/b/kaggle-user-content/o/inbox%2F3200273%2Fe814c2739b99d221de328c72a0b2571e%2FCapture.PNG?generation=1581314967227445&alt=media" alt="">
Acknowledgements
Now I couldn't have got the data without Worldometer. So special thanks to the website. It is because of them I was able to get the data.
Inspiration
As far as I know, I don't have any questions to ask. You guys can let me know by finding your ways to use the data and let me know via kernel if you find something interesting
--- Original source retains full ownership of the source dataset ---
 FacebookTwitter
Apache License, v2.0https://www.apache.org/licenses/LICENSE-2.0
License information was derived automatically
Explore our public notebook content!
Meta Kaggle Code is an extension to our popular Meta Kaggle dataset. This extension contains all the raw source code from hundreds of thousands of public, Apache 2.0 licensed Python and R notebooks versions on Kaggle used to analyze Datasets, make submissions to Competitions, and more. This represents nearly a decade of data spanning a period of tremendous evolution in the ways ML work is done.
Why we’re releasing this dataset
By collecting all of this code created by Kaggle’s community in one dataset, we hope to make it easier for the world to research and share insights about trends in our industry. With the growing significance of AI-assisted development, we expect this data can also be used to fine-tune models for ML-specific code generation tasks.
Meta Kaggle for Code is also a continuation of our commitment to open data and research. This new dataset is a companion to Meta Kaggle which we originally released in 2016. On top of Meta Kaggle, our community has shared nearly 1,000 public code examples. Research papers written using Meta Kaggle have examined how data scientists collaboratively solve problems, analyzed overfitting in machine learning competitions, compared discussions between Kaggle and Stack Overflow communities, and more.
The best part is Meta Kaggle enriches Meta Kaggle for Code. By joining the datasets together, you can easily understand which competitions code was run against, the progression tier of the code’s author, how many votes a notebook had, what kinds of comments it received, and much, much more. We hope the new potential for uncovering deep insights into how ML code is written feels just as limitless to you as it does to us!
Sensitive data
While we have made an attempt to filter out notebooks containing potentially sensitive information published by Kaggle users, the dataset may still contain such information. Research, publications, applications, etc. relying on this data should only use or report on publicly available, non-sensitive information.
Joining with Meta Kaggle
The files contained here are a subset of the KernelVersions in Meta Kaggle. The file names match the ids in the KernelVersions csv file. Whereas Meta Kaggle contains data for all interactive and commit sessions, Meta Kaggle Code contains only data for commit sessions.
File organization
The files are organized into a two-level directory structure. Each top level folder contains up to 1 million files, e.g. - folder 123 contains all versions from 123,000,000 to 123,999,999. Each sub folder contains up to 1 thousand files, e.g. - 123/456 contains all versions from 123,456,000 to 123,456,999. In practice, each folder will have many fewer than 1 thousand files due to private and interactive sessions.
The ipynb files in this dataset hosted on Kaggle do not contain the output cells. If the outputs are required, the full set of ipynbs with the outputs embedded can be obtained from this public GCS bucket: kaggle-meta-kaggle-code-downloads. Note that this is a "requester pays" bucket. This means you will need a GCP account with billing enabled to download. Learn more here: https://cloud.google.com/storage/docs/requester-pays
Questions / Comments
We love feedback! Let us know in the Discussion tab.
Happy Kaggling!