Enforcement and Compliance History Online (ECHO) Facilities
- catalog.data.gov
- s.cnmilf.com
- +1more
Updated Nov 4, 2025 Share
Share Facebook
 Twitter
 EmailClick to copy linkLink copiedCiteU.S. Environmental Protection Agency, Office of Enforcment and Compliance Assurance (Point of Contact) (2025). Enforcement and Compliance History Online (ECHO) Facilities [Dataset]. https://catalog.data.gov/dataset/enforcement-and-compliance-history-online-echo-facilities8Dataset updatedNov 4, 2025Description
ECHO provides integrated compliance and enforcement information for about 800,000 regulated facilities nationwide. Its features range from simple to advanced, catering to users who want to conduct broad analyses as well as those who need to perform complex searches. Enforcement and compliance data are available for air emissions, surface water discharges, hazardous waste, and drinking water systems. ECHO includes EPA, state, local and tribal environmental agency compliance and enforcement records that are contained in EPA national databases. ECHO also incorporates many EPA environmental data sets to provide additional context for analyses.
EPA Enforcement and Compliance History Online
- catalog.data.gov
- s.cnmilf.com
- +2more
Updated Jun 19, 2021+ more versionsShareFacebookTwitterEmailClick to copy linkLink copiedCiteU.S. Environmental Protection Agency (2021). EPA Enforcement and Compliance History Online [Dataset]. https://catalog.data.gov/dataset/epa-enforcement-and-compliance-history-onlineDataset updatedJun 19, 2021DescriptionThe Environmental Protection Agency's Enforcement and Compliance History Online (ECHO) website provides customizable and downloadable information about environmental inspections, violations, and enforcement actions for EPA-regulated facilities related to the Clean Air Act, Clean Water Act, Resource Conservation and Recovery Act, and Safe Drinking Water Act. These data are updated weekly as part of the ECHO data refresh, and ECHO offers many user-friendly options to explore data, including: • Facility Search: ECHO information is searchable by varied criteria, including location, facility type, and compliance status. Search results are customizable and downloadable. • Comparative Maps and State Dashboards: These tools offer aggregated information about facility compliance status, regulatory agency compliance monitoring, and enforcement activity at the national and state level. • Bulk Data Downloads: One of ECHO’s most popular features is the ability to work offline by downloading large data sets. Users can take advantage of the ECHO Exporter, which provides summary information about each facility in comma-separated values (csv) file format, or download data sets by program as zip files.
- p
Data from: EchoNotes Structured Database derived from MIMIC-III...
- physionet.org
Updated Feb 23, 2024ShareFacebookTwitterEmailClick to copy linkLink copiedCiteGloria Hyunjung Kwak; Dana Moukheiber; Mira Moukheiber; Lama Moukheiber; Sulaiman Moukheiber; Neel Butala; Leo Anthony Celi; Christina Chen (2024). EchoNotes Structured Database derived from MIMIC-III (ECHO-NOTE2NUM) [Dataset]. http://doi.org/10.13026/xhrz-ht59Unique identifierhttps://doi.org/10.13026/xhrz-ht59Dataset updatedFeb 23, 2024AuthorsGloria Hyunjung Kwak; Dana Moukheiber; Mira Moukheiber; Lama Moukheiber; Sulaiman Moukheiber; Neel Butala; Leo Anthony Celi; Christina ChenLicensehttps://github.com/MIT-LCP/license-and-dua/tree/master/draftshttps://github.com/MIT-LCP/license-and-dua/tree/master/drafts
DescriptionThe EchoNotes Structured Database derived from MIMIC-III (ECHO-NOTE2NUM) is a structured echocardiogram database derived from 43,472 observational notes obtained during echocardiogram studies conducted in the intensive care unit at the Beth Israel Deaconess Medical Center between 2001 and 2012. The database encompasses various aspects of cardiac structure and function, including cavity size, wall thickness, systolic and diastolic function, valve regurgitation and stenosis, as well as pulmonary pressures. To facilitate extensive data analysis, the clinical notes were transformed into a structured numerical format. Within each echocardiogram report sentence, specific words or phrases were identified to describe abnormal findings, and a severity staging system using numeric categories was established. This large publicly-accessible database of structured echocardiogram data holds significant potential as a tool to investigate cardiovascular disease in the intensive care unit.
EPA Facility Registry Service - Integrated Compliance Information System...
- edg-epa.hub.arcgis.com
- hub.arcgis.com
- +1more
Updated Mar 13, 2020+ more versionsShareFacebookTwitterEmailClick to copy linkLink copiedCiteU.S. EPA (2020). EPA Facility Registry Service - Integrated Compliance Information System Federal Enforcement and Compliance (ICIS FE&C) [Dataset]. https://edg-epa.hub.arcgis.com/items/a117d02cdbfc4bcbad5abb7c9bf94982Dataset updatedMar 13, 2020AuthorsU.S. EPALicenseMIT Licensehttps://opensource.org/licenses/MIT
License information was derived automaticallyArea coveredDescriptionThe Facility Registry Service (FRS) provides quality facility data to support EPA's mission of protecting human health and the environment by identifying and geospatially locating facilities, sites, or places subject to environmental regulations of environmental interest. Facility data is improved with geospatial processing of incoming data and data curation tools to provide an integrated, dataset to partners and the public through a variety of methods and products. For more detailed information about these facilities, use the FRS Query tool.This layer provides location and facility information for sites regulated under the Integrated Compliance Information System Federal Enforcement and Compliance (ICIS FE&C). The ICIS databases provide information on companies which have been issued permits to discharge wastewater into rivers. ICIS FE&C contains all Federal Administrative and Judicial enforcement actions and a subset of the Permit Compliance System (PCS), which supports the National Pollutant Discharge Elimination System (NPDES). To learn more about ICIS click here or use the Enforcement and Compliance History Online (ECHO) database.
EPA Enforcement and Compliance History Online: Hazardous Waste Sites Data...
- catalog.data.gov
- datasets.ai
- +1more
Updated Jun 19, 2021ShareFacebookTwitterEmailClick to copy linkLink copiedCiteU.S. Environmental Protection Agency (2021). EPA Enforcement and Compliance History Online: Hazardous Waste Sites Data Set [Dataset]. https://catalog.data.gov/dataset/epa-enforcement-and-compliance-history-online-hazardous-waste-sites-data-setDataset updatedJun 19, 2021DescriptionThe Enforcement and Compliance History Online (ECHO) data sets have been compiled for access to larger sets of national data to ensure that ECHO meets your data retrieval needs: Resource Conservation and Recovery Act (RCRA) data sets for hazardous waste sites.
- w
Echo, Inc. Whois Database | Whois Data Center
- whoisdatacenter.com
csvShareFacebookTwitterEmailClick to copy linkLink copiedCiteAllHeart Web Inc, Echo, Inc. Whois Database | Whois Data Center [Dataset]. https://whoisdatacenter.com/registrar/250/csvAvailable download formatsDataset authored and provided byAllHeart Web IncLicensehttps://whoisdatacenter.com/terms-of-use/https://whoisdatacenter.com/terms-of-use/
Time period coveredOct 16, 2025 - Dec 31, 2025DescriptionEcho, Inc. Whois Database, discover comprehensive ownership details, registration dates, and more for Echo, Inc. with Whois Data Center.
- D
HIFLD OPEN Integrated Compliance Information System (ICIS) Wastewater...
- datalumos.org
Updated Oct 27, 2025+ more versionsShareFacebookTwitterEmailClick to copy linkLink copiedCiteEnvironmental Protection Agency (2025). HIFLD OPEN Integrated Compliance Information System (ICIS) Wastewater Treatment Plants [Dataset]. http://doi.org/10.3886/E239262V1Unique identifierhttps://doi.org/10.3886/E239262V1Dataset updatedOct 27, 2025Dataset provided byEnvironmental Protection Agency
United States Department of Homeland SecurityLicensehttps://creativecommons.org/share-your-work/public-domain/pdmhttps://creativecommons.org/share-your-work/public-domain/pdm
Time period coveredFeb 27, 2019 - Aug 10, 2025Area coveredUnited States of AmericaDescriptionThe Facility Registry Service (FRS) provides quality facility data to support EPA's mission of protecting human health and the environment by identifying and geospatially locating facilities, sites, or places subject to environmental regulations of environmental interest. Facility data is improved with geospatial processing of incoming data and data curation tools to provide an integrated, dataset to partners and the public through a variety of methods and products. For more detailed information about these facilities, use the FRS Query tool. This layer provides location and facility information for wastewater treatment plants from the Integrated Compliance Information System (ICIS). The data are presented with three different view options at the facility level: 1.) display of Publicly Owned Treatment Works and Federal facilities, 2.) Display of all facilities, categorized as Major, Minor and Other/Nonclassified, and 3.) Display of facilities with Combined Sewer Outfalls. ICIS contains all Federal Administrative and Judicial enforcement actions and a subset of the Permit Compliance System (PCS), which supports the National Pollutant Discharge Elimination System (NPDES). To learn more about ICIS use the Enforcement and Compliance History Online (ECHO) database.
- p
Data from: MIMIC-IV-ECHO-Ext-MIMICEchoQA: A Benchmark Dataset for...
- physionet.org
Updated Oct 7, 2025ShareFacebookTwitterEmailClick to copy linkLink copiedCiteRahul Thapa; Andrew Li; Qingyang Wu; Bryan He; Yuki Sahashi; Christina Binder-Rodriguez; Angela Zhang; David Ouyang; James Zou (2025). MIMIC-IV-ECHO-Ext-MIMICEchoQA: A Benchmark Dataset for Echocardiogram-Based Visual Question Answering [Dataset]. http://doi.org/10.13026/rndk-4s36Unique identifierhttps://doi.org/10.13026/rndk-4s36Dataset updatedOct 7, 2025AuthorsRahul Thapa; Andrew Li; Qingyang Wu; Bryan He; Yuki Sahashi; Christina Binder-Rodriguez; Angela Zhang; David Ouyang; James ZouLicensehttps://github.com/MIT-LCP/license-and-dua/tree/master/draftshttps://github.com/MIT-LCP/license-and-dua/tree/master/drafts
DescriptionWe present MIMICEchoQA, a benchmark dataset for echocardiogram-based question answering, built from the publicly available MIMIC-IV-ECHO database. Each echocardiographic study was paired with the closest discharge summary within a 7-day window, and the transthoracic echocardiography (TTE) and ECHO sections were extracted to serve as proxies for cardiologist-authored diagnostic reports. DICOM videos were converted to .mp4 format, and a language model was used to generate multi-turn, closed-ended Q/A pairs grounded in these reports. To ensure anatomical consistency, a view classification model was used to label each video by its echocardiographic view (e.g., A4C, A3C), enabling the filtering of questions referencing structures not visible in the corresponding video. All generated Q/A pairs were manually reviewed by two board-certified cardiologists to ensure clinical validity. The final dataset consists of 622 high-quality, view-consistent Q/A pairs aligned with real-world echocardiogram videos, offering a valuable resource for developing and evaluating models in echocardiographic visual question answering.
Echo Reservoir and Dam Water Operations Monitoring Data from Upper Colorado...
- data.usbr.gov
Updated May 18, 2025ShareFacebookTwitterEmailClick to copy linkLink copiedCiteUnited States Bureau of Reclamation (2025). Echo Reservoir and Dam Water Operations Monitoring Data from Upper Colorado Hydrologic Database [Dataset]. https://data.usbr.gov/catalog/2290Dataset updatedMay 18, 2025Area coveredDescriptionUpper Colorado Region Water Operations Data for Echo Reservoir and Dam.
- G
MED-ECHO — S10 Report - Breakdown of departures by type of admission by...
- open.canada.ca
- ouvert.canada.ca
csv, html, pdfUpdated Nov 12, 2025+ more versionsShareFacebookTwitterEmailClick to copy linkLink copiedCiteGovernment and Municipalities of Québec (2025). MED-ECHO — S10 Report - Breakdown of departures by type of admission by treatment region [Dataset]. https://open.canada.ca/data/en/dataset/c8cdfeb5-4360-4687-a9dd-eadf673435e3csv, pdf, htmlAvailable download formatsDataset updatedNov 12, 2025Dataset provided byGovernment and Municipalities of QuébecLicenseOpen Government Licence - Canada 2.0https://open.canada.ca/en/open-government-licence-canada
License information was derived automaticallyTime period coveredApr 1, 2011 - Mar 31, 2025DescriptionThis table gives, by health region of treatment, the number of urgent, semi-urgent, non-urgent departures, a partial total as well as the departures of newborns. The MED-ÉCHO bank contains data relating to hospital stays that occurred in Quebec hospitals providing general and specialized care. These data, compiled by hospitals, concern short-term care (physical and psychiatric) and day surgeries. This data is produced by the Régie de l'assurance Maladie du Québec from the MED-ECHO database. They cover the whole of Quebec.
The dEchorate dataset
- zenodo.org
binUpdated May 25, 2022ShareFacebookTwitterEmailClick to copy linkLink copiedCiteDiego Di Carlo; Diego Di Carlo; Pinchas Tandeitnik; Cedric Foy; Nancy Bertin; Antoine Deleforge; Antoine Deleforge; Sharon Gannot; Pinchas Tandeitnik; Cedric Foy; Nancy Bertin; Sharon Gannot (2022). The dEchorate dataset [Dataset]. http://doi.org/10.5281/zenodo.4626590binAvailable download formatsUnique identifierhttps://doi.org/10.5281/zenodo.4626590Dataset updatedMay 25, 2022AuthorsDiego Di Carlo; Diego Di Carlo; Pinchas Tandeitnik; Cedric Foy; Nancy Bertin; Antoine Deleforge; Antoine Deleforge; Sharon Gannot; Pinchas Tandeitnik; Cedric Foy; Nancy Bertin; Sharon GannotLicenseAttribution 4.0 (CC BY 4.0)https://creativecommons.org/licenses/by/4.0/
License information was derived automaticallyDescriptionThis work presents a new dataset of measured multichannel Room Impulse Responses (RIRs) named dEchorate. It includes annotations of early echo timings and 3D positions of microphones, real sources and image sources under different wall configurations in a cuboid room.
These data provide a tool for benchmarking recent methods in echo-aware speech enhancement, room geometry estimation, RIR estimation, acoustic echo retrieval, microphone calibration, echo labelling and reflectors position estimation.
The dataset is provided with software utilities to easily access, manipulate and visualize the data as well as baseline methods for echo-related tasks.- G
MED-ECHO - Report S01 - Data on main and associated diagnoses by stay and...
- open.canada.ca
csv, html, pdfUpdated Nov 12, 2025+ more versionsShareFacebookTwitterEmailClick to copy linkLink copiedCiteGovernment and Municipalities of Québec (2025). MED-ECHO - Report S01 - Data on main and associated diagnoses by stay and sex [Dataset]. https://open.canada.ca/data/dataset/103148dd-6efe-4413-9dc7-bb52d9b279e1pdf, csv, htmlAvailable download formatsDataset updatedNov 12, 2025Dataset provided byGovernment and Municipalities of QuébecLicenseOpen Government Licence - Canada 2.0https://open.canada.ca/en/open-government-licence-canada
License information was derived automaticallyTime period coveredApr 1, 2011 - Mar 31, 2025DescriptionThis table lists, in ascending order of category (ICD-10-CA), the frequency of primary and associated diagnoses. For each main diagnosis, it gives the number of departures, the total stay, the average stay, and for each associated diagnosis, the number of cases. It contains the data of all the installations forming the MED-ÉCHO clientele. The MED-ÉCHO bank contains data relating to hospital stays that occurred in Quebec hospitals providing general and specialized care. These data, compiled by hospitals, concern short-term care (physical and psychiatric) and day surgeries. This data is produced by the Régie de l'assurance Maladie du Québec from the MED-ECHO database. They cover the whole of Quebec.
- N
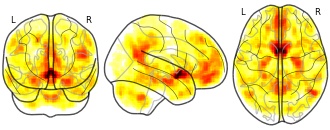
Segregation of the human basal forebrain using resting state functional MRI:...
- neurovault.org
niftiUpdated Jun 30, 2018+ more versionsShareFacebookTwitterEmailClick to copy linkLink copiedCite(2018). Segregation of the human basal forebrain using resting state functional MRI: Multi-echo: MS/DB [Dataset]. http://identifiers.org/neurovault.image:53444niftiAvailable download formatsUnique identifierhttps://identifiers.org/neurovault.image:53444Dataset updatedJun 30, 2018LicenseCC0 1.0 Universal Public Domain Dedicationhttps://creativecommons.org/publicdomain/zero/1.0/
License information was derived automaticallyDescriptionFunctional correlations of the medial septum/diagonal band of Broca (MS/DB, Ch123; Zaborszky et al., 2008). Image derived (via one sample t-test) from single-subject functional correlation Z-maps; single subject maps were derived from multi-echo data using multi-echo independent components regression (ME-ICR, Kundu et al., 2013). This is a partial correlation map -- data at the subject level were orthogonalized with respect to the nucleus basalis of Meynert (NBM, Ch4; Zaborszky et al., 2008).
Collection description
Functional connectivity (Z-maps) for anatomical sub-divisions of the basal forebrain using ROIs from the SPM Toolbox (Eickhoff et al., 2007; Zaborszky et al., 2008). Both single- and multi-echo maps are included for comparison.
Subject species
homo sapiens
Modality
fMRI-BOLD
Analysis level
single-subject
Cognitive paradigm (task)
rest eyes open
Map type
Z
- G
MED-ECHO — Report S13 - Interregional mobility, number of departures by...
- open.canada.ca
- datasets.ai
csv, html, pdfUpdated Nov 12, 2025+ more versionsShareFacebookTwitterEmailClick to copy linkLink copiedCiteGovernment and Municipalities of Québec (2025). MED-ECHO — Report S13 - Interregional mobility, number of departures by region, treatment and residence [Dataset]. https://open.canada.ca/data/en/dataset/d684fe3e-d082-4d31-93da-18cdbf9597d2pdf, csv, htmlAvailable download formatsDataset updatedNov 12, 2025Dataset provided byGovernment and Municipalities of QuébecLicenseOpen Government Licence - Canada 2.0https://open.canada.ca/en/open-government-licence-canada
License information was derived automaticallyTime period coveredApr 1, 2011 - Mar 31, 2024DescriptionThis table represents a cross between the treatment region and the region of residence in relation to the number of departures. The MED-ÉCHO bank contains data relating to hospital stays that occurred in Quebec hospitals providing general and specialized care. These data, compiled by hospitals, concern short-term care (physical and psychiatric) and day surgeries. This data is produced by the Régie de l'assurance Maladie du Québec from the MED-ECHO database. They cover the whole of Quebec.
- g
MED-ECHO - Report S02 - Frequency of interventions by sex | gimi9.com
- gimi9.com
Updated Sep 30, 2022+ more versionsShareFacebookTwitterEmailClick to copy linkLink copiedCite(2022). MED-ECHO - Report S02 - Frequency of interventions by sex | gimi9.com [Dataset]. https://gimi9.com/dataset/ca_26399105-f483-48cd-b3de-28fcdeecabc7/Dataset updatedSep 30, 2022DescriptionThis table shows, in ascending order of section, the number of cases and the average stay of the intervention codes. The MED-ÉCHO bank contains data relating to hospital stays that occurred in Quebec hospitals providing general and specialized care. These data, compiled by hospitals, concern short-term care (physical and psychiatric) and day surgeries. This data is produced by the Quebec Health Insurance Board from the MED-ECHO database. They cover all of Quebec.
EPA Facility Registry Service - Integrated Compliance Information System for...
- hub.arcgis.com
Updated Jan 9, 2020+ more versionsShareFacebookTwitterEmailClick to copy linkLink copiedCiteU.S. EPA (2020). EPA Facility Registry Service - Integrated Compliance Information System for Air (AIR) [Dataset]. https://hub.arcgis.com/datasets/2ec5c12c263c45b9a800f48666bdf4f2Dataset updatedJan 9, 2020AuthorsU.S. EPALicenseMIT Licensehttps://opensource.org/licenses/MIT
License information was derived automaticallyArea coveredDescriptionThe Facility Registry Service (FRS) provides quality facility data to support EPA's mission of protecting human health and the environment by identifying and geospatially locating facilities, sites, or places subject to environmental regulations of environmental interest. Facility data is improved with geospatial processing of incoming data and data curation tools to provide an integrated, dataset to partners and the public through a variety of methods and products. For more detailed information about these facilities, use the FRS Query tool. This layer provides location and facility information for sites found in the Integrated Compliance Information System for Air (AIR). ICIS-Air (AIR) – AIR is the modernization of multiple systems, Air Facility System (AFS) and the Integrated Compliance Information System (ICIS). AIR contains enforcement, compliance, and permit data for stationary sources of air pollution regulated by the EPA, State, and Local air pollution agencies. To learn more about ICIS-AIR visit the overview webpage. To learn more about ICIS click here or use the Enforcement and Compliance History Online (ECHO) database.
- u
MED-ECHO — Report S16 - Summary of departures according to the main...
- data.urbandatacentre.ca
Updated Oct 19, 2025+ more versionsShareFacebookTwitterEmailClick to copy linkLink copiedCite(2025). MED-ECHO — Report S16 - Summary of departures according to the main diagnosis by group of categories [Dataset]. https://data.urbandatacentre.ca/dataset/gov-canada-0b926a9e-38be-4a17-b70e-42cdab937738Dataset updatedOct 19, 2025DescriptionThis table gives, by category group, information on departures, stays, departures by age group, deaths, autopsies, the number of surgeries and the percentage of beneficiaries admitted by the emergency department, for all hospital centers serving MED-ECHO clients. The MED-ÉCHO bank contains data relating to hospital stays that occurred in Quebec hospitals providing general and specialized care. These data, compiled by hospitals, concern short-term care (physical and psychiatric) and day surgeries. This data is produced by the Quebec Health Insurance Board from the MED-ECHO database. They cover all of Quebec.
- g
MED-ECHO — Report S03 - Number of departures and days of hospitalization by...
- gimi9.com
Updated Sep 30, 2022+ more versionsShareFacebookTwitterEmailClick to copy linkLink copiedCite(2022). MED-ECHO — Report S03 - Number of departures and days of hospitalization by place of residence of users | gimi9.com [Dataset]. https://gimi9.com/dataset/ca_ef221e2e-ca1d-4fd6-8c7a-9d46dc5e4acbDataset updatedSep 30, 2022DescriptionThis table shows the number of departures and days of hospitalization according to the place of residence of the users. The MED-ÉCHO bank contains data relating to hospital stays that occurred in Quebec hospitals providing general and specialized care. These data, compiled by hospitals, concern short-term care (physical and psychiatric) and day surgeries. This data is produced by the Quebec Health Insurance Board from the MED-ECHO database. They cover all of Quebec.
- g
Data from: Data for the Potomac River Watershed Accumulated Wastewater...
- gimi9.com
- data.usgs.gov
- +1more
Updated Apr 23, 2025+ more versionsShareFacebookTwitterEmailClick to copy linkLink copiedCite(2025). Data for the Potomac River Watershed Accumulated Wastewater Viewer [Dataset]. https://gimi9.com/dataset/data-gov_data-for-the-potomac-river-watershed-accumulated-wastewater-viewer/Dataset updatedApr 23, 2025Area coveredPotomac RiverDescriptionThis data release contains measured streamflow data from U.S. Geological Survey (USGS) streamgages and reported wastewater data from wastewater treatment plants (WWTP) discharge monitoring reports (DMRs) within the Potomac River watershed between October 1, 2021 and September 30, 2024. Mean monthly streamflow data was obtained from 117 USGS streamgages (Table1_Streamgages.csv). Average monthly reported wastewater discharge volumes to surface water were obtained from National Pollutant Discharge Elimination System (NPDES) permits using the United States Environmental Protection Agency’s (USEPA) Environment and Compliance History Online (ECHO) database to obtain DMRs from the Integrated Compliance Information System National Pollutant Discharge Elimination System (ICIS-NPDES). Quality assurance procedures that were used to avoid inclusion of inaccurate data that can be reported on DMRs (Table2_WWTP_DMRs.csv) are documented within the Process Step fields of the metadata. At each streamgage the average monthly accumulated wastewater percentage (ACCWW) was calculated by dividing the total amount of reported wastewater upstream of the streamgage by the measured amount of streamflow (Table3_Streamgage_ACCWW.csv) following similar methods described in Miller and others (2024) and Barber and others (2025). The ACCWW calculations were computed monthly at each streamgage using reported total wastewater discharge, municipal wastewater discharge, and municipal-plus-industrial per- and polyfluoroalkyl substances (PFAS) wastewater discharge which includes municipal wastewater in addition to wastewater from industrial WWTPs that are potential PFAS handling industry sectors defined by the USEPA (2023). The term ‘municipal’ is used here to represent NPDES-permitted facilities with the Standard Industrial Classification code 4952 (‘sewerage systems’) and 'industrial' refers to permitted facilities with Standard Industrial Classification codes other than 4952. Monthly predicted environmental concentrations and constituent loads (i.e. mass fluxes) of eight PFAS and 14 pesticides were estimated at each streamgage following methodology presented by Barber and others (2025) and Miller and others (2024). Monthly PFAS loads were computed by multiplying the discharge volumes from municipal and industrial WWTPs that are potential PFAS handling industry sectors by the median PFAS concentrations measured and reported in Barber and others (2025). Monthly pesticide loads were computed by multiplying the discharge volumes from municipal WWTPs by the median pesticide concentrations reported in Miller and others (2024). Wastewater effluent concentrations from Miller and others (2024) and Barber and others (2025) are provided in Table4_Parameters.csv. Monthly predicted constituent loads from wastewater were summed from WWTPs that discharged to every National Hydrography Dataset Version 2.1 (NHDPlus V2; USEPA, 2012) stream segment Common Identifier (COMID) upstream of each streamgage, not including the COMID where the streamgage was located, to calculate the predicted monthly load at each streamgage (Table5_Streamgage_Parameter_Predictions.csv). Predicted monthly concentrations from wastewater were calculated by dividing the predicted monthly load by measured monthly streamflow at each streamgage (Table5_Streamgage_Parameter_Predictions.csv).
- m
Echo Analytics | Mobility Data & Insights 58M+ Locations Worldwide
- app.mobito.io
Updated Feb 3, 2023ShareFacebookTwitterEmailClick to copy linkLink copiedCite(2023). Echo Analytics | Mobility Data & Insights 58M+ Locations Worldwide [Dataset]. https://app.mobito.io/data-product/echo-analytics-%7C-mobility-data-&-insights-55m+-locations-worldwideDataset updatedFeb 3, 2023Area coveredAFRICA, ASIA, NORTH_AMERICA, SOUTH_AMERICA, EUROPE, OCEANIADescriptionEcho’s Mobility Data package includes attributes that allow it to map the activity around more than 58M+ Points-of-Interest. Visits & visitors are matched to physical locations, enabling companies to gain an in-depth understanding of: - New movement trends - Popular locations - The customers’ journey - Frequency of visits & repeat visitors - And more…
Thanks to these insights, it is possible to: - Assess an area’s growth potential by evaluating its’ Foot Traffic - Identify cross-visitation trends - Evaluate customer loyalty to a specific brand - The length of the buying journey
We run monthly or quarterly maintenance and updates on our existing database to ensure ongoing data accuracy and precision. This data is Non-PII and GDPR- compliant.
It is possible to request Activity Analyses to get further contextualisation of the mobility around a POI. Ask one of our data experts for our: - Cross Visitation Analysis - Customer Journey Analysis
FacebookTwitterECHO provides integrated compliance and enforcement information for about 800,000 regulated facilities nationwide. Its features range from simple to advanced, catering to users who want to conduct broad analyses as well as those who need to perform complex searches. Enforcement and compliance data are available for air emissions, surface water discharges, hazardous waste, and drinking water systems. ECHO includes EPA, state, local and tribal environmental agency compliance and enforcement records that are contained in EPA national databases. ECHO also incorporates many EPA environmental data sets to provide additional context for analyses.