Data Table for Map of ECM Counties
- gis.dhcs.ca.gov
- data.ca.gov
- +8more
Updated Jan 24, 2024+ more versions Share
Share Facebook
 Twitter
 EmailClick to copy linkLink copiedCiteCalifornia Department of Health Care Services (2024). Data Table for Map of ECM Counties [Dataset]. https://gis.dhcs.ca.gov/maps/CADHCS::data-table-for-map-of-ecm-countiesDataset updatedJan 24, 2024Dataset authored and provided byCalifornia Department of Health Care Serviceshttp://www.dhcs.ca.gov/Description
ECM Community Support Services tables for a Quarterly Implementation Report. Including the County and Plan Details for both ECM and Community Support.This Medi-Cal Enhanced Care Management (ECM) and Community Supports Calendar Year Quarterly Implementation Report provides a comprehensive overview of ECM and Community Supports implementation in the programs' first year. It includes data at the state, county, and plan levels on total members served, utilization, and provider networks.ECM is a statewide MCP benefit that provides person-centered, community-based care management to the highest need members. The Department of Health Care Services (DHCS) and its MCP partners began implementing ECM in phases by Populations of Focus (POFs), with the first three POFs launching statewide in CY 2022.Community Supports are services that address members’ health-related social needs and help them avoid higher, costlier levels of care. Although it is optional for MCPs to offer these services, every Medi-Cal MCP offered Community Supports in 2022, and at least two Community Supports services were offered and available in every county by the end of the year.
- g
Data Table for Map of ECM Counties | gimi9.com
- gimi9.com
Updated Feb 5, 2024+ more versionsShareFacebookTwitterEmailClick to copy linkLink copiedCite(2024). Data Table for Map of ECM Counties | gimi9.com [Dataset]. https://gimi9.com/dataset/california_data-table-for-map-of-ecm-countiesDataset updatedFeb 5, 2024LicenseAttribution 4.0 (CC BY 4.0)https://creativecommons.org/licenses/by/4.0/
License information was derived automaticallyDescription🇺🇸 미국 English ECM Community Support Services tables for a Quarterly Implementation Report. Including the County and Plan Details for both ECM and Community Support.This Medi-Cal Enhanced Care Management (ECM) and Community Supports Calendar Year Quarterly Implementation Report provides a comprehensive overview of ECM and Community Supports implementation in the programs' first year. It includes data at the state, county, and plan levels on total members served, utilization, and provider networks.ECM is a statewide MCP benefit that provides person-centered, community-based care management to the highest need members. The Department of Health Care Services (DHCS) and its MCP partners began implementing ECM in phases by Populations of Focus (POFs), with the first three POFs launching statewide in CY 2022.Community Supports are services that address members’ health-related social needs and help them avoid higher, costlier levels of care. Although it is optional for MCPs to offer these services, every Medi-Cal MCP offered Community Supports in 2022, and at least two Community Supports services were offered and available in every county by the end of the year.
Data Table for Map of ECM Counties - jf78-8fs5 - Archive Repository
- healthdata.gov
csv, xlsx, xmlUpdated Aug 29, 2024ShareFacebookTwitterEmailClick to copy linkLink copiedCite(2024). Data Table for Map of ECM Counties - jf78-8fs5 - Archive Repository [Dataset]. https://healthdata.gov/w/nw97-c5sz/_variation_?cur=8HkRfwVO65O&from=rootxml, csv, xlsxAvailable download formatsDataset updatedAug 29, 2024DescriptionThis dataset tracks the updates made on the dataset "Data Table for Map of ECM Counties" as a repository for previous versions of the data and metadata.
- g
Data Table for Map of ECM Counties | gimi9.com
- gimi9.com
+ more versionsShareFacebookTwitterEmailClick to copy linkLink copiedCiteData Table for Map of ECM Counties | gimi9.com [Dataset]. https://gimi9.com/dataset/data-gov_data-table-for-map-of-ecm-countiesLicenseAttribution 4.0 (CC BY 4.0)https://creativecommons.org/licenses/by/4.0/
License information was derived automaticallyDescriptionECM Community Support Services tables for a Quarterly Implementation Report. Including the County and Plan Details for both ECM and Community Support.This Medi-Cal Enhanced Care Management (ECM) and Community Supports Calendar Year Quarterly Implementation Report provides a comprehensive overview of ECM and Community Supports implementation in the programs' first year. It includes data at the state, county, and plan levels on total members served, utilization, and provider networks.ECM is a statewide MCP benefit that provides person-centered, community-based care management to the highest need members. The Department of Health Care Services (DHCS) and its MCP partners began implementing ECM in phases by Populations of Focus (POFs), with the first three POFs launching statewide in CY 2022.Community Supports are services that address members’ health-related social needs and help them avoid higher, costlier levels of care. Although it is optional for MCPs to offer these services, every Medi-Cal MCP offered Community Supports in 2022, and at least two Community Supports services were offered and available in every county by the end of the year.
Map ECM Counties - 53fz-id9m - Archive Repository
- healthdata.gov
csv, xlsx, xmlUpdated Aug 14, 2024ShareFacebookTwitterEmailClick to copy linkLink copiedCite(2024). Map ECM Counties - 53fz-id9m - Archive Repository [Dataset]. https://healthdata.gov/w/hiss-ynz6/default?cur=g3_aIqkLo3s&from=NFZFZ3Pdwjsxml, xlsx, csvAvailable download formatsDataset updatedAug 14, 2024DescriptionThis dataset tracks the updates made on the dataset "Map ECM Counties" as a repository for previous versions of the data and metadata.
- N
ICA-ECM in the PNC sample : IC 03
- neurovault.org
niftiUpdated May 14, 2018+ more versionsShareFacebookTwitterEmailClick to copy linkLink copiedCite(2018). ICA-ECM in the PNC sample : IC 03 [Dataset]. http://identifiers.org/neurovault.image:63983niftiAvailable download formatsUnique identifierhttps://identifiers.org/neurovault.image:63983Dataset updatedMay 14, 2018LicenseCC0 1.0 Universal Public Domain Dedicationhttps://creativecommons.org/publicdomain/zero/1.0/
License information was derived automaticallyDescriptionFSL5.0
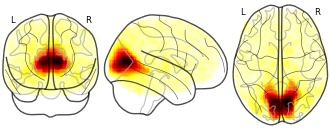
Collection description
Contains the ICA-decomposition on ECM maps estimated on resting state and n-back data for 754 individuals i the Philadelphia Neurodevelopmental Cohort. Also contains t-maps from randomise for one sample t-test on task, and effects of age on ECM-maps.
Subject species
homo sapiens
Modality
Other
Analysis level
group
Cognitive paradigm (task)
None / Other
Map type
Other
A quantitative brain map of experimental cerebral malaria pathology
- plos.figshare.com
tiffUpdated May 31, 2023ShareFacebookTwitterEmailClick to copy linkLink copiedCitePatrick Strangward; Michael J. Haley; Tovah N. Shaw; Jean-Marc Schwartz; Rachel Greig; Aleksandr Mironov; J. Brian de Souza; Sheena M. Cruickshank; Alister G. Craig; Danny A. Milner Jr; Stuart M. Allan; Kevin N. Couper (2023). A quantitative brain map of experimental cerebral malaria pathology [Dataset]. http://doi.org/10.1371/journal.ppat.1006267tiffAvailable download formatsUnique identifierhttps://doi.org/10.1371/journal.ppat.1006267Dataset updatedMay 31, 2023AuthorsPatrick Strangward; Michael J. Haley; Tovah N. Shaw; Jean-Marc Schwartz; Rachel Greig; Aleksandr Mironov; J. Brian de Souza; Sheena M. Cruickshank; Alister G. Craig; Danny A. Milner Jr; Stuart M. Allan; Kevin N. CouperLicenseAttribution 4.0 (CC BY 4.0)https://creativecommons.org/licenses/by/4.0/
License information was derived automaticallyDescriptionThe murine model of experimental cerebral malaria (ECM) has been utilised extensively in recent years to study the pathogenesis of human cerebral malaria (HCM). However, it has been proposed that the aetiologies of ECM and HCM are distinct, and, consequently, no useful mechanistic insights into the pathogenesis of HCM can be obtained from studying the ECM model. Therefore, in order to determine the similarities and differences in the pathology of ECM and HCM, we have performed the first spatial and quantitative histopathological assessment of the ECM syndrome. We demonstrate that the accumulation of parasitised red blood cells (pRBCs) in brain capillaries is a specific feature of ECM that is not observed during mild murine malaria infections. Critically, we show that individual pRBCs appear to occlude murine brain capillaries during ECM. As pRBC-mediated congestion of brain microvessels is a hallmark of HCM, this suggests that the impact of parasite accumulation on cerebral blood flow may ultimately be similar in mice and humans during ECM and HCM, respectively. Additionally, we demonstrate that cerebrovascular CD8+ T-cells appear to co-localise with accumulated pRBCs, an event that corresponds with development of widespread vascular leakage. As in HCM, we show that vascular leakage is not dependent on extensive vascular destruction. Instead, we show that vascular leakage is associated with alterations in transcellular and paracellular transport mechanisms. Finally, as in HCM, we observed axonal injury and demyelination in ECM adjacent to diverse vasculopathies. Collectively, our data therefore shows that, despite very different presentation, and apparently distinct mechanisms, of parasite accumulation, there appear to be a number of comparable features of cerebral pathology in mice and in humans during ECM and HCM, respectively. Thus, when used appropriately, the ECM model may be useful for studying specific pathological features of HCM.
- f
Data from: Matrisome Provides a Supportive Microenvironment for Skin...
- acs.figshare.com
xlsxUpdated Jun 5, 2023ShareFacebookTwitterEmailClick to copy linkLink copiedCiteBinghui Liu; Shikun Zhang; Wenjuan Wang; Zhimin Yun; Luye Lv; Mi Chai; Zhihong Wu; Yunping Zhu; Jie Ma; Ling Leng (2023). Matrisome Provides a Supportive Microenvironment for Skin Functions of Diverse Species [Dataset]. http://doi.org/10.1021/acsbiomaterials.0c00479.s002xlsxAvailable download formatsUnique identifierhttps://doi.org/10.1021/acsbiomaterials.0c00479.s002Dataset updatedJun 5, 2023Dataset provided byACS PublicationsAuthorsBinghui Liu; Shikun Zhang; Wenjuan Wang; Zhimin Yun; Luye Lv; Mi Chai; Zhihong Wu; Yunping Zhu; Jie Ma; Ling LengLicenseAttribution-NonCommercial 4.0 (CC BY-NC 4.0)https://creativecommons.org/licenses/by-nc/4.0/
License information was derived automaticallyDescriptionA biomaterial scaffold is a promising tool employed to drive tissue regeneration. This technology has been successfully applied in human tissue rebuilding, particularly for the skin. Meanwhile, there is still room for further improvement, such as maintaining sufficient functionality of a biomaterial scaffold. Here, we developed a new decellularization method to generate a complete anatomical skin biomatrix scaffold with a preserved extracellular matrix (ECM) architecture. We performed proteomic and bioinformatic analyses of the skin scaffold maps of humans, pigs, and rats and systematically analyzed the interaction between ECM proteins and different cell types in the skin microenvironment. These interactions served to quantify the structure and function of the skin’s Matrisome comprising core ECM components and ECM-associated soluble signaling molecules required for the regulation of epidermal development. We primarily found that the properties of the skin ECM were species-specific. For example, the composition and function of the ECM of the human skin were more similar to those of pigs compared with those of rats. However, the skin ECM of the pig was significantly deficient in its enzyme systems and immune regulatory factors compared with that of humans. These findings provide a new understanding of the role of the skin ECM niche as well as an attractive strategy that can apply tissue engineering principles to skin biomatrix scaffold materials, which promises to accelerate and enhance tissue regeneration.
- E
Electronic Cartographic Marine Report
- datainsightsmarket.com
doc, pdf, pptUpdated Apr 29, 2025ShareFacebookTwitterEmailClick to copy linkLink copiedCiteData Insights Market (2025). Electronic Cartographic Marine Report [Dataset]. https://www.datainsightsmarket.com/reports/electronic-cartographic-marine-1945932doc, ppt, pdfAvailable download formatsDataset updatedApr 29, 2025Dataset authored and provided byData Insights MarketLicensehttps://www.datainsightsmarket.com/privacy-policyhttps://www.datainsightsmarket.com/privacy-policy
Time period covered2025 - 2033Area coveredGlobalVariables measuredMarket SizeDescriptionDiscover the booming Electronic Cartographic Marine (ECM) market. This comprehensive analysis reveals key trends, drivers, restraints, and regional insights, including ECDIS, ECS, and RCDS market growth projections to 2033. Learn about leading companies like C-MAP and Furuno and explore the impact of technological advancements on navigation systems.
- w
National Intertidal-Subtidal Benthic NISB Habitat Distribution Map Series
- data.wu.ac.at
- researchdata.edu.au
pdf, wmsUpdated Jan 31, 2018ShareFacebookTwitterEmailClick to copy linkLink copiedCiteDepartment of the Environment and Energy (2018). National Intertidal-Subtidal Benthic NISB Habitat Distribution Map Series [Dataset]. https://data.wu.ac.at/schema/data_gov_au/NzAxZGYzZDItYzQ1Ny00NmY4LWEzMGUtOWM3YmMyNTU1ZGNhpdf, wmsAvailable download formatsDataset updatedJan 31, 2018Dataset provided byDepartment of the Environment and EnergyArea covered7bca7a7b1c27bcd53fb558808ffbad3174ff02a3DescriptionThe National ECM Key Habitat Distribution Map Series were derived from the NISB Habitat Map created by the University of Tasmania for a partnership between the Department of Climate Change and the National Land and Water Resources Audit. It supports the DCC/Audit partnership by providing a nationally consistent set of the available mapping data that show the distribution of habitats that occur between the approximate position of the highest astronomical tide mark (HAT) and the location of the outer limit of the photic benthic zone (approximately at the 50-70 m depth contour). This area is broadly equivalent to the “inner” and “mid-shelf” regions identified by Geoscience Australia. The resulting map data set forms a core component of the ECM National Habitat Map Series. The habitat classes include: coral reef, rock dominated habitat, sediment dominated habitat, mangroves, saltmarsh, seagrass, macroalgae and filter feeders (e.g. sponges), as defined in the NISB Habitat Classification Scheme. The scheme is designed to support the development of marine ‘ecoregions’ or bioregional subregions. Details of the scheme and the process of its development are available in National Intertidal/Subtidal Benthic (NISB) Habitat Classification Scheme Version 1 (Mount, Bricher and Newton, 2007). The 10 km and 50 km tiles distribution maps that form the National ECM Key Habitat Distribution Map Series were derived from the NISB Habitat Map in order to produce maps at resolutions that are easy to interpret at state and national extents. For each state, two layers were produced, one with 10 km and one with 50 km tiles. In each layer, new fields were created listing the presence, absence, unknown distribution or nonapplicability of the Habitats of Interest (HOI). The HOI are rock substrate (Class 1.2), unconsolidated substrates (Class 2.0), coral habitat (classes 1.1 and 1.2.2.3), sediment dominated habitats (Class 2.0.1), seagrass dominated habitats (Classes 1.2.2.4 and 2.0.2.1), mangrove dominated habitats (Class 2.0.2.2) and saltmarsh dominated habitats (Class 2.0.2.3). There are technical geographic and cartographic issues that arise when comparing mapped data sets of multiple scales, as is the case for this compiled and derived data set. The two derived information products were generated to provide a simplified spatial representation of the broad distribution patterns of each of the key habitats National ECM Habitat Map Series User Guide_v7.doc 30/04/2008 Page 32 of 156 across large areas. These derived products are designed to enable the visualisation of the habitat distributions at the regional and national extents. It is extremely important to note that they are definitely NOT able to be used to calculate areas of habitat types.
- d
Data from: Fine-resolution global maps of root biomass carbon colonized by...
- datadryad.org
- search.dataone.org
zipUpdated Dec 2, 2022ShareFacebookTwitterEmailClick to copy linkLink copiedCiteMilagros Barceló (2022). Fine-resolution global maps of root biomass carbon colonized by arbuscular and ectomycorrhizal fungi [Dataset]. http://doi.org/10.5061/dryad.866t1g1ttzipAvailable download formatsUnique identifierhttps://doi.org/10.5061/dryad.866t1g1ttDataset updatedDec 2, 2022Dataset provided byDryadAuthorsMilagros BarcelóTime period coveredNov 21, 2022DescriptionDespite the recognized importance of mycorrhizal associations in ecosystem functioning, the actual abundance patterns of mycorrhizal fungi belowground are still unknown. This information is key for better quantification of mycorrhizal impacts on ecosystem processes and for incorporating mycorrhizal pathways into global biogeochemical models. Here we present the first high-resolution maps of fine root stocks colonized by arbuscular mycorrhizal (AM) and ectomycorrhizal (EcM) fungi (MgC ha−1). The maps were assembled by combining multiple open-source databases holding information on root biomass carbon, the proportion of AM and EcM tree biomass, plot-level relative abundance of plant species and intensity of AM and EcM root colonization. We calculated root-associated AM and EcM abundance in 881 spatial units, defined as the combination of ecoregions and land cover types across six continents. These maps serve as a basis for future research where continuous spatial estimates of root mycorrh...
- f
Creating High-Resolution Multiscale Maps of Human Tissue Using Multi-beam...
- figshare.com
tiffUpdated May 30, 2023ShareFacebookTwitterEmailClick to copy linkLink copiedCiteAndré F. Pereira; Daniel J. Hageman; Tomasz Garbowski; Christof Riedesel; Ulf Knothe; Dirk Zeidler; Melissa L. Knothe Tate (2023). Creating High-Resolution Multiscale Maps of Human Tissue Using Multi-beam SEM [Dataset]. http://doi.org/10.1371/journal.pcbi.1005217tiffAvailable download formatsUnique identifierhttps://doi.org/10.1371/journal.pcbi.1005217Dataset updatedMay 30, 2023Dataset provided byPLOS Computational BiologyAuthorsAndré F. Pereira; Daniel J. Hageman; Tomasz Garbowski; Christof Riedesel; Ulf Knothe; Dirk Zeidler; Melissa L. Knothe TateLicenseAttribution 4.0 (CC BY 4.0)https://creativecommons.org/licenses/by/4.0/
License information was derived automaticallyDescriptionMulti-beam scanning electron microscopy (mSEM) enables high-throughput, nano-resolution imaging of macroscopic tissue samples, providing an unprecedented means for structure-function characterization of biological tissues and their cellular inhabitants, seamlessly across multiple length scales. Here we describe computational methods to reconstruct and navigate a multitude of high-resolution mSEM images of the human hip. We calculated cross-correlation shift vectors between overlapping images and used a mass-spring-damper model for optimal global registration. We utilized the Google Maps API to create an interactive map and provide open access to our reconstructed mSEM datasets to both the public and scientific communities via our website www.mechbio.org. The nano- to macro-scale map reveals the tissue’s biological and material constituents. Living inhabitants of the hip bone (e.g. osteocytes) are visible in their local extracellular matrix milieu (comprising collagen and mineral) and embedded in bone’s structural tissue architecture, i.e. the osteonal structures in which layers of mineralized tissue are organized in lamellae around a central blood vessel. Multi-beam SEM and our presented methodology enable an unprecedented, comprehensive understanding of health and disease from the molecular to organ length scale.
- r
Victoria - National Intertidal-Subtidal Benthic NISB Habitat Map (PLUS)
- researchdata.edu.au
Updated Nov 1, 2013+ more versionsShareFacebookTwitterEmailClick to copy linkLink copiedCitePhillippa Bricher; Dr Richard Mount (2013). Victoria - National Intertidal-Subtidal Benthic NISB Habitat Map (PLUS) [Dataset]. https://researchdata.edu.au/victoria-national-intertidal-map-plus/1356980Dataset updatedNov 1, 2013Dataset provided byAustralian Ocean Data NetworkAuthorsPhillippa Bricher; Dr Richard MountTime period covered1984 - 2007DescriptionThe NISB Habitat Map was created by the University of Tasmania for a partnership between the Department of Climate Change and the National Land and Water Resources Audit. It supports the DCC/Audit partnership by providing a nationally consistent set of the available mapping data for those habitats that occur between the approximate position of the highest astronomical tide mark (HAT) and the location of the outer limit of the photic benthic zone (approximately at the 50-70 m depth contour). This area is broadly equivalent to the 'inner' and 'mid-shelf' regions identified by Geoscience Australia. The resulting map data set forms a core component of the ECM National Habitat Map Series. The habitat classes include: coral reef, rock dominated habitat, sediment dominated habitat, mangroves, saltmarsh, seagrass, macroalgae and filter feeders (e.g. sponges), as defined in the NISB Habitat Classification Scheme. The scheme is designed to support the development of marine 'ecoregions' or bioregional subregions. Details of the scheme and the process of its development are available in National Intertidal/Subtidal Benthic (NISB) Habitat Classification Scheme Version 1 (Mount, Bricher and Newton, 2007). The NISB Habitat Map consists of two layers for each state. _NISB.shp consists of the entire available habitat mapping at a resolution finer than 1:50 000 (with a few exceptions, outlined in the data quality section below). _NISB_PLUS.shp consists of all the data in _NISB.shp along with coarser resolution data, including NVIS and OzEstuaries data. These layers were used to produce the National ECM Key Habitat Distribution Map Series 10 km and 50 km tile maps.
Note: This data is labelled as “NISB_plus”, indicating that it is the NISB Habitat layer plus other lower quality layers. - N
ECM1: ECM
- neurovault.org
niftiUpdated Apr 18, 2018+ more versionsShareFacebookTwitterEmailClick to copy linkLink copiedCite(2018). ECM1: ECM [Dataset]. http://identifiers.org/neurovault.image:63305niftiAvailable download formatsUnique identifierhttps://identifiers.org/neurovault.image:63305Dataset updatedApr 18, 2018LicenseCC0 1.0 Universal Public Domain Dedicationhttps://creativecommons.org/publicdomain/zero/1.0/
License information was derived automaticallyDescription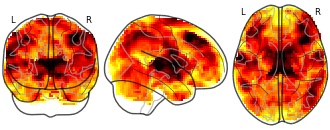
Collection description
Subject species
homo sapiens
Modality
fMRI-BOLD
Cognitive paradigm (task)
psychophysics task
Map type
T
Dataset information.
- plos.figshare.com
- figshare.com
xlsUpdated Jun 1, 2023+ more versionsShareFacebookTwitterEmailClick to copy linkLink copiedCiteAndré F. Pereira; Daniel J. Hageman; Tomasz Garbowski; Christof Riedesel; Ulf Knothe; Dirk Zeidler; Melissa L. Knothe Tate (2023). Dataset information. [Dataset]. http://doi.org/10.1371/journal.pcbi.1005217.t001xlsAvailable download formatsUnique identifierhttps://doi.org/10.1371/journal.pcbi.1005217.t001Dataset updatedJun 1, 2023AuthorsAndré F. Pereira; Daniel J. Hageman; Tomasz Garbowski; Christof Riedesel; Ulf Knothe; Dirk Zeidler; Melissa L. Knothe TateLicenseAttribution 4.0 (CC BY 4.0)https://creativecommons.org/licenses/by/4.0/
License information was derived automaticallyDescriptionDataset information.
Oleanolic acid induces migration in Mv1Lu and MDA-MB-231 epithelial cells...
- plos.figshare.com
tiffUpdated Jun 1, 2023ShareFacebookTwitterEmailClick to copy linkLink copiedCiteÁngel Bernabé-García; David Armero-Barranco; Sergio Liarte; María Ruzafa-Martínez; Antonio Jesús Ramos-Morcillo; Francisco José Nicolás (2023). Oleanolic acid induces migration in Mv1Lu and MDA-MB-231 epithelial cells involving EGF receptor and MAP kinases activation [Dataset]. http://doi.org/10.1371/journal.pone.0172574tiffAvailable download formatsUnique identifierhttps://doi.org/10.1371/journal.pone.0172574Dataset updatedJun 1, 2023AuthorsÁngel Bernabé-García; David Armero-Barranco; Sergio Liarte; María Ruzafa-Martínez; Antonio Jesús Ramos-Morcillo; Francisco José NicolásLicenseAttribution 4.0 (CC BY 4.0)https://creativecommons.org/licenses/by/4.0/
License information was derived automaticallyDescriptionDuring wound healing, skin function is restored by the action of several cell types that undergo differentiation, migration, proliferation and/or apoptosis. These dynamics are tightly regulated by the evolution of the extra cellular matrix (ECM) contents along the process. Pharmacologically active flavonoids have shown to exhibit useful physiological properties interesting in pathological states. Among them, oleanolic acid (OA), a pentacyclic triterpene, shows promising properties over wound healing, as increased cell migration in vitro and improved wound resolution in vivo. In this paper, we pursued to disclose the molecular mechanisms underlying those effects, by using an in vitro scratch assay in two epithelial cell lines of different linage: non-malignant mink lung epithelial cells, Mv1Lu; and human breast cancer cells, MDA-MB-231. In every case, we observed that OA clearly enhanced cell migration for in vitro scratch closure. This correlated with the stimulation of molecular pathways related to mitogen-activated protein (MAP) kinases, as ERK1,2 and Jun N-terminal kinase (JNK) 1,2 activation and c-Jun phosphorylation. Moreover, MDA-MB-231 cells treated with OA displayed an altered gene expression profile affecting transcription factor genes (c-JUN) as well as proteins involved in migration and ECM dynamics (PAI1), in line with the development of an epithelial to mesenchymal transition (EMT) status. Strikingly, upon OA treatment, we observed changes in the epidermal growth factor receptor (EGFR) subcellular localization, while interfering with its signalling completely prevented migration effects. This data provides a physiological framework supporting the notion that lipophilic plant extracts used in traditional medicine, might modulate wound healing processes in vivo through its OA contents. The molecular implications of these observations are discussed.
- f
Data from: Comparative Analysis of the Extracellular Matrix Proteome across...
- figshare.com
- acs.figshare.com
xlsxUpdated May 30, 2023ShareFacebookTwitterEmailClick to copy linkLink copiedCiteKathryn R. Jacobson; Sarah Lipp; Andrea Acuna; Yue Leng; Ye Bu; Sarah Calve (2023). Comparative Analysis of the Extracellular Matrix Proteome across the Myotendinous Junction [Dataset]. http://doi.org/10.1021/acs.jproteome.0c00248.s002xlsxAvailable download formatsUnique identifierhttps://doi.org/10.1021/acs.jproteome.0c00248.s002Dataset updatedMay 30, 2023Dataset provided byACS PublicationsAuthorsKathryn R. Jacobson; Sarah Lipp; Andrea Acuna; Yue Leng; Ye Bu; Sarah CalveLicenseAttribution-NonCommercial 4.0 (CC BY-NC 4.0)https://creativecommons.org/licenses/by-nc/4.0/
License information was derived automaticallyDescriptionThe myotendinous junction is a highly interdigitated interface designed to transfer muscle-generated force to tendon. Understanding how this interface is formed and organized, as well as identifying tendon- and muscle-specific extracellular matrix (ECM), is critical for designing effective regenerative therapies to restore functionality to damaged muscle–tendon units. However, a comparative analysis of the ECM proteome across this interface has not been conducted. The goal of this study was to resolve the distribution of ECM proteins that are uniformly expressed as well as those specific to each of the muscle, tendon, and junction tissues. The soleus muscles from 5-month-old wild-type C57BL/6 mice were harvested and dissected into the central muscle (M) away from tendon, the junction between muscle and tendon (J) and the tendon (T). Tissues were processed by either homogenizing in guanidine hydrochloride or fractionating to isolate the ECM from more soluble intracellular components and then analyzed using liquid chromatographytandem mass spectrometry. Overall, we found that both tissue processing methods generated similar ECM profiles. Many ECM were found across the muscle–tendon unit, including type I collagen and associated fibril-regulating proteins. The ECM identified exclusively in M were primarily related to the basal lamina, whereas those specific to T and J tissue included thrombospondins and other matricellular ECM. Type XXII collagen (COL22A1) was restricted to J, and we identified COL5A3 as a potential marker of the muscle–tendon interface. Immunohistochemical analysis of key proteins confirmed the restriction of some basal lamina proteins to M, tenascin-C to T, and COL22A1 to J. COL5A3, PRELP, and POSTN were visualized in the tissue surrounding the junction, suggesting that these proteins play a role in stabilizing the interface. This comparative map provides a guide for tissue-specific ECM that can facilitate the spatial visualization of M, J, and T tissues and inform musculoskeletal regenerative therapies.
Parameters used for the mass-spring-damper system model.
- plos.figshare.com
xlsUpdated Jun 4, 2023ShareFacebookTwitterEmailClick to copy linkLink copiedCiteAndré F. Pereira; Daniel J. Hageman; Tomasz Garbowski; Christof Riedesel; Ulf Knothe; Dirk Zeidler; Melissa L. Knothe Tate (2023). Parameters used for the mass-spring-damper system model. [Dataset]. http://doi.org/10.1371/journal.pcbi.1005217.t002xlsAvailable download formatsUnique identifierhttps://doi.org/10.1371/journal.pcbi.1005217.t002Dataset updatedJun 4, 2023AuthorsAndré F. Pereira; Daniel J. Hageman; Tomasz Garbowski; Christof Riedesel; Ulf Knothe; Dirk Zeidler; Melissa L. Knothe TateLicenseAttribution 4.0 (CC BY 4.0)https://creativecommons.org/licenses/by/4.0/
License information was derived automaticallyDescriptionParameters used for the mass-spring-damper system model.
- s
Data from: Global mycorrhizal status drives leaf δ15N patterns
- repository.soilwise-he.eu
- datadryad.org
Updated Sep 22, 2024ShareFacebookTwitterEmailClick to copy linkLink copiedCite(2024). Global mycorrhizal status drives leaf δ15N patterns [Dataset]. http://doi.org/10.5281/zenodo.14863825Unique identifierhttps://doi.org/10.5281/zenodo.14863825Dataset updatedSep 22, 2024DescriptionOpen AccessFoliar δ15N values were obtained from a recent version of the global dataset described by Craine et al. (2018) that was updated with newly published data for Meta-analyses. Multi-year average MAT, MAP, and PET maps with a spatial resolution of 4 km × 4 km for 1982 through 2018 were extracted from the TerraClimate dataset (Abatzoglou et al., 2018). AI values (defined as the ratio of precipitation to PET) were calculated from MAP and PET values. A digital elevation model (DEM) map with a spatial resolution of 1 km × 1 km was extracted from the Global Land One km Base Elevation (GLOBE) Project (https://www.ngdc.noaa.gov/mgg/topo/globe.html). A slope map was generated from the DEM map. Soil clay, silt, sand, soil organic carbon (SOC), and TN contents with a spatial resolution of 250 m × 250 m were obtained from the SoilGrids dataset (Hengl et al., 2017). Multi-year (1982–2018) GPP values were calculated using data from the Global Land Surface Satellite (GLASS) project (Liang et al., 2021). Multi-year (1982–2015) average normalized difference vegetation index (NDVI) values were calculated from the GIMMS3g dataset (Tucker et al., 2005). The mycorrhizal plant type map (showing the distribution of AM, ECM, ERM, and NM plants) was generated from maps showing the proportional aboveground plant biomass of AM, ECM, ERM, and NM plants (Soudzilovskaia et al., 2019) for Random Forest.
- f
Data from: Integrative Computational and Experimental Approaches to...
- datasetcatalog.nlm.nih.gov
- plos.figshare.com
Updated Mar 20, 2014ShareFacebookTwitterEmailClick to copy linkLink copiedCiteJin, Yu-Fang; Wu, Cathy; Chilton, Robert J.; Lange, Richard A.; Lindsey, Merry L.; Nguyen, Nguyen T.; Zhang, Xiaolin (2014). Integrative Computational and Experimental Approaches to Establish a Post-Myocardial Infarction Knowledge Map [Dataset]. https://datasetcatalog.nlm.nih.gov/dataset?q=0001221022Dataset updatedMar 20, 2014AuthorsJin, Yu-Fang; Wu, Cathy; Chilton, Robert J.; Lange, Richard A.; Lindsey, Merry L.; Nguyen, Nguyen T.; Zhang, XiaolinDescriptionVast research efforts have been devoted to providing clinical diagnostic markers of myocardial infarction (MI), leading to over one million abstracts associated with “MI” and “Cardiovascular Diseases” in PubMed. Accumulation of the research results imposed a challenge to integrate and interpret these results. To address this problem and better understand how the left ventricle (LV) remodels post-MI at both the molecular and cellular levels, we propose here an integrative framework that couples computational methods and experimental data. We selected an initial set of MI-related proteins from published human studies and constructed an MI-specific protein-protein-interaction network (MIPIN). Structural and functional analysis of the MIPIN showed that the post-MI LV exhibited increased representation of proteins involved in transcriptional activity, inflammatory response, and extracellular matrix (ECM) remodeling. Known plasma or serum expression changes of the MIPIN proteins in patients with MI were acquired by data mining of the PubMed and UniProt knowledgebase, and served as a training set to predict unlabeled MIPIN protein changes post-MI. The predictions were validated with published results in PubMed, suggesting prognosticative capability of the MIPIN. Further, we established the first knowledge map related to the post-MI response, providing a major step towards enhancing our understanding of molecular interactions specific to MI and linking the molecular interaction, cellular responses, and biological processes to quantify LV remodeling.
FacebookTwitterECM Community Support Services tables for a Quarterly Implementation Report. Including the County and Plan Details for both ECM and Community Support.This Medi-Cal Enhanced Care Management (ECM) and Community Supports Calendar Year Quarterly Implementation Report provides a comprehensive overview of ECM and Community Supports implementation in the programs' first year. It includes data at the state, county, and plan levels on total members served, utilization, and provider networks.ECM is a statewide MCP benefit that provides person-centered, community-based care management to the highest need members. The Department of Health Care Services (DHCS) and its MCP partners began implementing ECM in phases by Populations of Focus (POFs), with the first three POFs launching statewide in CY 2022.Community Supports are services that address members’ health-related social needs and help them avoid higher, costlier levels of care. Although it is optional for MCPs to offer these services, every Medi-Cal MCP offered Community Supports in 2022, and at least two Community Supports services were offered and available in every county by the end of the year.