- f
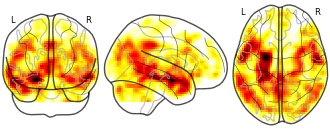
Detailed information of the between-condition differences in the PCC-FC maps...
- plos.figshare.com
xlsUpdated Jun 4, 2023+ more versions Share
Share Facebook
 Twitter
 EmailClick to copy linkLink copiedCiteChaogan Yan; Dongqiang Liu; Yong He; Qihong Zou; Chaozhe Zhu; Xinian Zuo; Xiangyu Long; Yufeng Zang (2023). Detailed information of the between-condition differences in the PCC-FC maps within the DMN. [Dataset]. http://doi.org/10.1371/journal.pone.0005743.t001xlsAvailable download formatsUnique identifierhttps://doi.org/10.1371/journal.pone.0005743.t001Dataset updatedJun 4, 2023Dataset provided byPLOS ONEAuthorsChaogan Yan; Dongqiang Liu; Yong He; Qihong Zou; Chaozhe Zhu; Xinian Zuo; Xiangyu Long; Yufeng ZangLicense
Attribution 4.0 (CC BY 4.0)https://creativecommons.org/licenses/by/4.0/
License information was derived automaticallyDescriptionThe statistical threshold was set at |t|>2.093 (P486 mm3, which corresponds to a corrected P
- W
F. C. Deemer Sample Repository
- cloud.csiss.gmu.edu
pdf, pngUpdated Aug 8, 2019ShareFacebookTwitterEmailClick to copy linkLink copiedCiteEnergy Data Exchange (2019). F. C. Deemer Sample Repository [Dataset]. http://cloud.csiss.gmu.edu/uddi/lv/dataset/f-c-deemer-sample-repositorypdf(7299795), pdf(10827990), pdf(13071291), pdf(985114), pdf(748529), png(6176550), pdf(3682664), pdf(4627672), pdf(775361), pdf(5538668), png(1955603), png(7016286), pdf(5811778), pdf(5818350), pdf(3112279), pdf(739431), pdf(616930), pdf(814964), pdf(633860), pdf(8338440), pdf(13424458), pdf(11568432), pdf(2701702), png(2371237), pdf(11358387), pdf(1364697), pdf(2697806), png(6634233), pdf(967689), pdf(5324238), pdf(1834727), pdf(2395575), pdf(6587253)Available download formatsDataset updatedAug 8, 2019Dataset provided byEnergy Data ExchangeDescriptionThe F. C. Deemer repository at NETL consists of over 10,000 samples of drill cuttings from historic wells within the Appalachian Basin in Pennsylvania. The samples are from 24 wells within Jefferson and Clearfield counties. These wells were drilled by independent natural gas driller F. C. Deemer from the 1920's to 1950's. All of the wells contain samples from Devonian age rocks including multiple samples of Marcellus shale throughout the region. The data presented with this repository includes digitized well records and production reports, stratigraphic type logs, maps, and well information spreadsheets.
- N
guoxiaonan's temporary collection: insula FC map
- neurovault.org
niftiUpdated Dec 30, 2016+ more versionsShareFacebookTwitterEmailClick to copy linkLink copiedCite(2016). guoxiaonan's temporary collection: insula FC map [Dataset]. http://identifiers.org/neurovault.image:39746niftiAvailable download formatsUnique identifierhttps://identifiers.org/neurovault.image:39746Dataset updatedDec 30, 2016LicenseCC0 1.0 Universal Public Domain Dedicationhttps://creativecommons.org/publicdomain/zero/1.0/
License information was derived automaticallyDescription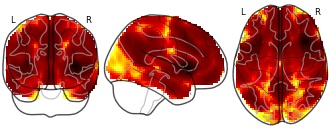
Collection description
None
Subject species
homo sapiens
Modality
fMRI-BOLD
Cognitive paradigm (task)
rest eyes open
Map type
Z
- f
Distribution of markers on parental maps (GG and FC) and linkage group...
- plos.figshare.com
xlsUpdated Jun 2, 2023ShareFacebookTwitterEmailClick to copy linkLink copiedCiteOron Gar; Daniel J. Sargent; Ching-Jung Tsai; Tzili Pleban; Gil Shalev; David H. Byrne; Dani Zamir (2023). Distribution of markers on parental maps (GG and FC) and linkage group statistics. [Dataset]. http://doi.org/10.1371/journal.pone.0020463.t002xlsAvailable download formatsUnique identifierhttps://doi.org/10.1371/journal.pone.0020463.t002Dataset updatedJun 2, 2023Dataset provided byPLOS ONEAuthorsOron Gar; Daniel J. Sargent; Ching-Jung Tsai; Tzili Pleban; Gil Shalev; David H. Byrne; Dani ZamirLicenseAttribution 4.0 (CC BY 4.0)https://creativecommons.org/licenses/by/4.0/
License information was derived automaticallyDescriptionDistribution of markers on parental maps (GG and FC) and linkage group statistics.
- w
Bikeway System Map
- data.wu.ac.at
- opendata.fcgov.com
- +1more
csv, json, xmlUpdated Aug 27, 2018ShareFacebookTwitterEmailClick to copy linkLink copiedCiteFC Bikes (2018). Bikeway System Map [Dataset]. https://data.wu.ac.at/schema/data_colorado_gov/aXFkZC04emdtcsv, xml, jsonAvailable download formatsDataset updatedAug 27, 2018Dataset provided byFC BikesDescriptionThe City of Fort Collins GIS Online Mapping tool (FCMaps) provide current, timely and local geographic information in an easy to use viewer. FCMaps is mobile friendly and will work well on tablets and smartphones as well as a desktop browser.
Here you will find a map of the bike lanes/paths in Fort Collins.
COVID city FC
- data-sccphd.opendata.arcgis.com
Updated May 16, 2020ShareFacebookTwitterEmailClick to copy linkLink copiedCiteSanta Clara County Public Health (2020). COVID city FC [Dataset]. https://data-sccphd.opendata.arcgis.com/maps/covid-city-fcDataset updatedMay 16, 2020AuthorsSanta Clara County Public HealthLicenseMIT Licensehttps://opensource.org/licenses/MIT
License information was derived automaticallyArea coveredDescriptionThe layer displays reported cumulative COVID-19 case rate per 100,000 people summarized by city of residence of the case.
- N
High Functioning Autism Functional Connectivity R-scored Maps: sGFBMS
- neurovault.org
niftiUpdated May 12, 2017+ more versionsShareFacebookTwitterEmailClick to copy linkLink copiedCite(2017). High Functioning Autism Functional Connectivity R-scored Maps: sGFBMS [Dataset]. http://identifiers.org/neurovault.image:47159niftiAvailable download formatsUnique identifierhttps://identifiers.org/neurovault.image:47159Dataset updatedMay 12, 2017LicenseCC0 1.0 Universal Public Domain Dedicationhttps://creativecommons.org/publicdomain/zero/1.0/
License information was derived automaticallyDescriptionsmoothed r-scored maps Amyg_Left
Collection description
22 adolescents and young adults with ASD from the local community and from the University of Campinas. A trained and qualified clinician made the diagnosis of ASD using the DSM-5 criteria after interviewing the family and examining each patient. A second investigator confirmed the diagnosis using the “Current” Scores of the Autism Diagnostic Interview-Revised (ADI-R). The ADI-R is a clinical diagnostic instrument for assessing autism in children and adults. The ADI-R provides a diagnostic algorithm for autism as described in both the ICD-10 and DSM-IV and is one of the most important validated ASD measures available in Brazil. Child testing and parent interviews should be viewed as complimentary and necessary components of the diagnostic evaluation after the clinical evaluation and DSM-5 criteria. All patients were required to have a full-scale IQ greater than 85, as measured by the Wechsler Abbreviated Scale of Intelligence.
Exclusion criteria comprised a history of major psychiatric disorders (e.g. depression, psychosis), seizure, head injury, toxic exposure and the evidence of genetic, metabolic or infectious disorders. We also excluded individuals with secondary autism related to a specific etiology such as tuberous sclerosis or Fragile X syndrome. Thirteen individuals in the ASD group were using a variety of psychoactive medications. Nine subjects were not under psychoactive drug treatment. Five subjects were taking psychostimulants, seven were taking antipsychotics and six were taking selective serotonin reuptake inhibitors (SSRIs). Six of these subjects were using more than one of the medications listed above. Participants were instructed not take any medication one day before their visit.We are including FC maps derived from 5 distinct seeds: PCC (the MNI coordinate −41 13 −29); medial frontal region (MNI 0 49 −3); left amygdala (MNI −23 −4 −20); left anterior hippocampus (MNI −24 −13 −20); left temporal pole (−41 13 −29)
Subject species
homo sapiens
Modality
fMRI-BOLD
Analysis level
single-subject
Cognitive paradigm (task)
None / Other
Map type
Other
- d
Data from: Isostatic gravity map of the Los Angeles 30 x 60 minute...
- search.dataone.org
Updated Oct 29, 2016+ more versionsShareFacebookTwitterEmailClick to copy linkLink copiedCiteR.J. Wooley; R.F. Yerkes; V.E. Langenheim; F.C. Chuang (2016). Isostatic gravity map of the Los Angeles 30 x 60 minute quadrangle, California [Dataset]. https://search.dataone.org/view/cabeadbd-9b59-44d9-932d-961c629c30c1Dataset updatedOct 29, 2016Dataset provided byUSGS Science Data CatalogAuthorsR.J. Wooley; R.F. Yerkes; V.E. Langenheim; F.C. ChuangTime period coveredJan 1, 1994 - Jan 1, 2001Area coveredVariables measuredOG, CBA, FAA, ISO, ITC, LaD, LaM, LoD, LoM, SBA, and 5 moreDescriptionGravity data were compiled, collected, and edited to produce an isostatic gravity map of the Los Angeles 30 x 60 minute quadrangle, California. This record focuses primarily on the principal facts, that is, gravity observations, and the corrections made to those values to reflect the effects of elevation and terrain, and deep crustal structure.
- f
Comparisons of FC maps from different brain areas between sleep and d-PIS...
- plos.figshare.com
xlsUpdated Jun 2, 2023+ more versionsShareFacebookTwitterEmailClick to copy linkLink copiedCiteYun Li; Shengpei Wang; Chuxiong Pan; Fushan Xue; Junfang Xian; Yaqi Huang; Xiaoyi Wang; Tianzuo Li; Huiguang He (2023). Comparisons of FC maps from different brain areas between sleep and d-PIS states. [Dataset]. http://doi.org/10.1371/journal.pone.0192358.t007xlsAvailable download formatsUnique identifierhttps://doi.org/10.1371/journal.pone.0192358.t007Dataset updatedJun 2, 2023Dataset provided byPLOS ONEAuthorsYun Li; Shengpei Wang; Chuxiong Pan; Fushan Xue; Junfang Xian; Yaqi Huang; Xiaoyi Wang; Tianzuo Li; Huiguang HeLicenseAttribution 4.0 (CC BY 4.0)https://creativecommons.org/licenses/by/4.0/
License information was derived automaticallyDescriptionComparisons of FC maps from different brain areas between sleep and d-PIS states.
- e
Sbírka map a plánů do roku 1850 - DOBNER, F. C. von Dobenau. Plan des oberen...
- data.europa.eu
ShareFacebookTwitterEmailClick to copy linkLink copiedCiteSbírka map a plánů do roku 1850 - DOBNER, F. C. von Dobenau. Plan des oberen Pettauer feldes.... Měřítko grafické (vídeňské palce a sáhy). 1833. 1 list 56,4 x 65,8 cm. - I-2-410 [Dataset]. https://data.europa.eu/data/datasets/cz-cuzk-sbirka_i-r-i-2-410?locale=enDescriptionColour raster copies of maps by Czech and European cartographers, cartographic shops and publishing houses up to year 1850. Maps and plans and usually printed, exceptionally manuscripts. The collection is divided into three parts: Czech maps, foreign territory, city plans.
FC NonPrime
- virginiaroads.org
- data.virginia.gov
Updated Sep 11, 2023+ more versionsShareFacebookTwitterEmailClick to copy linkLink copiedCiteVirginia Department of Transportation (2023). FC NonPrime [Dataset]. https://www.virginiaroads.org/maps/fc-nonprime-3Dataset updatedSep 11, 2023Dataset provided byVirginia Department Of TransportationAuthorsVirginia Department of TransportationArea coveredDescriptionThis data represents the functional classification data represented on LRS 23.1. Functional classification is the process by which streets and highways are grouped into classes, or systems, according to the character of service they are intended to provide. Basic to this process is the recognition that individual roads and streets do not serve travel independently in any major way, but serve as part of an overall network. Most travel involves movement throughout the network of roadways. It becomes necessary to determine how this travel can be channelized within the network in a logical and efficient manner. Functional classification defines the nature of this channelization process by defining the part that any particular road or street should play in serving the flow of trips through a highway network. The Virginia Department of Transportation's (VDOT) Transportation and Mobility Planning Division (TMPD) is responsible for maintaining the Commonwealth’s official Federal Functional Classification System. TMPD determines the functional classification of the road by type of trips, expected volume, what systems the roadway connects and whether the proposed functional classification falls within the mileage percentage thresholds established by the Federal Highway Administration (FHWA).
SoilGrids250m 2017-03 - Derived available soil water capacity (volumetric...
- search.dataone.org
- data.moa.gov.et
- +2more
Updated Mar 4, 2025+ more versionsShareFacebookTwitterEmailClick to copy linkLink copiedCiteISRIC – World Soil Information (2025). SoilGrids250m 2017-03 - Derived available soil water capacity (volumetric fraction) with FC = pF 2.0 [Dataset]. https://search.dataone.org/view/sha256%3Acf0aaa568faaaf5c28db485183d8da0841b457074bff5439efdb594e27fce396Dataset updatedMar 4, 2025Dataset provided byInternational Soil Reference and Information CentreTime period coveredJan 1, 1950 - Dec 1, 2015Area coveredDescriptionDerived available soil water capacity (volumetric fraction) with FC = pF 2.0 at 7 standard depths predicted using the global compilation of soil ground observations. Accuracy assessement of the maps is availble in Hengl et at. (2017) DOI: 10.1371/journal.pone.0169748. Data provided as GeoTIFFs with internal compression (co='COMPRESS=DEFLATE'). Measurement units: v%.
- a
Austin Light Rail Map (Interactive)
- project-connect-data-portal-atptx.hub.arcgis.com
Updated Jun 14, 2023ShareFacebookTwitterEmailClick to copy linkLink copiedCiteAustin Transit Partnership (2023). Austin Light Rail Map (Interactive) [Dataset]. https://project-connect-data-portal-atptx.hub.arcgis.com/items/7dc5d9b3e34c4ee0ab65f65b4ca1fdbbDataset updatedJun 14, 2023Dataset authored and provided byAustin Transit PartnershipDescriptionProject Connect expands transit services in Austin, TX including more options to the airport, downtown, Austin FC’s Stadium, The Domain, and Colony Park. Data Owner & Organization: Austin Transit Partnership - Planning & Federal Programs team.Data Source Details: See LRT and POI maps, visit the Project Connect website, or contact us for more information.Data Refresh Schedule: Data can be updated on a programmatic milestone basis.ATP Data Classification: Public; this data can be shared publicly.
- a
FC Prime
- hub.arcgis.com
- data.virginia.gov
Updated Sep 11, 2023+ more versionsShareFacebookTwitterEmailClick to copy linkLink copiedCiteVirginia Department of Transportation (2023). FC Prime [Dataset]. https://hub.arcgis.com/maps/VDOT::fc-prime-3Dataset updatedSep 11, 2023Dataset authored and provided byVirginia Department of TransportationArea coveredDescriptionThis data represents the functional classification data represented on LRS 23.1. Functional classification is the process by which streets and highways are grouped into classes, or systems, according to the character of service they are intended to provide. Basic to this process is the recognition that individual roads and streets do not serve travel independently in any major way, but serve as part of an overall network. Most travel involves movement throughout the network of roadways. It becomes necessary to determine how this travel can be channelized within the network in a logical and efficient manner. Functional classification defines the nature of this channelization process by defining the part that any particular road or street should play in serving the flow of trips through a highway network. The Virginia Department of Transportation's (VDOT) Transportation and Mobility Planning Division (TMPD) is responsible for maintaining the Commonwealth’s official Federal Functional Classification System. TMPD determines the functional classification of the road by type of trips, expected volume, what systems the roadway connects and whether the proposed functional classification falls within the mileage percentage thresholds established by the Federal Highway Administration (FHWA).
FC Prime
- data.virginia.gov
- hub.arcgis.com
Updated Apr 11, 2023+ more versionsShareFacebookTwitterEmailClick to copy linkLink copiedCiteDatathon 2025 (2023). FC Prime [Dataset]. https://data.virginia.gov/dataset/fc-prime1html, kml, arcgis geoservices rest api, zip, geojson, csvAvailable download formatsDataset updatedApr 11, 2023Dataset provided byVirginia Department Of TransportationAuthorsDatathon 2025DescriptionThis data represents the functional classification data represented on LRS 22.1. Functional classification is the process by which streets and highways are grouped into classes, or systems, according to the character of service they are intended to provide. Basic to this process is the recognition that individual roads and streets do not serve travel independently in any major way, but serve as part of an overall network. Most travel involves movement throughout the network of roadways. It becomes necessary to determine how this travel can be channelized within the network in a logical and efficient manner. Functional classification defines the nature of this channelization process by defining the part that any particular road or street should play in serving the flow of trips through a highway network. The Virginia Department of Transportation's (VDOT) Transportation and Mobility Planning Division (TMPD) is responsible for maintaining the Commonwealth’s official Federal Functional Classification System. TMPD determines the functional classification of the road by type of trips, expected volume, what systems the roadway connects and whether the proposed functional classification falls within the mileage percentage thresholds established by the Federal Highway Administration (FHWA).
Heard and McDonald Island Management Maps 2022
- researchdata.edu.au
Updated Nov 29, 2022ShareFacebookTwitterEmailClick to copy linkLink copiedCiteDONOGHUE, SHAVAWN; Donoghue, S.; DONOGHUE, SHAVAWN (2022). Heard and McDonald Island Management Maps 2022 [Dataset]. https://researchdata.edu.au/heard-mcdonald-island-maps-2022/3650680Dataset updatedNov 29, 2022Dataset provided byAustralian Antarctic Divisionhttps://www.antarctica.gov.au/
Australian Antarctic Data CentreAuthorsDONOGHUE, SHAVAWN; Donoghue, S.; DONOGHUE, SHAVAWNLicenseAttribution 4.0 (CC BY 4.0)https://creativecommons.org/licenses/by/4.0/
License information was derived automaticallyTime period coveredJan 1, 1980 - Feb 6, 2014Area coveredDescriptionThe Heard Island and McDonald Island management maps and polygon datasets stored in a Quantum Geographical Information System (QGIS) GeoPackage format. The four maps were developed to update the management zones figures in accordance with the Heard Island and McDonald Island Marine Research Management Plan, 2014-2024.
The unaltered datasets used included the ANARE historical Sites, countours_terrasar_100m_draft, flyingbird_pt_heard_pt_0304, sealer historical sites and WATERCOURSE_LN_heard.
Several of the older datasets were updated or edited these include; the Antarctic prion nests and HI_South Georgian diving petrel 2003-4, which were adapted from the FLYING_BIRD_PY_heard dataset. The Current buildings on HI_2001 and HI_Refuge_operational datasets were adapted from the heard_infrastructure dataset. The ShagIsland_Sail_DruryRocks was adapted from the 2009 DEM. Alert Island dataset was digitised from a panchromatic Digital Globe Worldview-1 satellite imagery acquired on 23 March 2008.
Additional datasets were created for this project including – HI glaciers 2014; HI_Coastline_2014; HI_Lagoons2014; and the HI_Vegetation Zone 2014; all of which were digitised from a pansharpened image derived from multispectral and panchromatic Digital Globe GeoEye-1 satellite imagery acquired on 6 February 2014. The HI glaciers 2014 dataset is an estimate of glacier coverage of the island in 2014 (some semi-permeant snow areas may be included, therefore should not be used to calculate total glacier area of the island). The HI_Vegetation Zone 2014 was created using the False Colour (FC) images created by Digital Globe from the pansharpened image derived from multispectral and panchromatic Digital Globe GeoEye-1 satellite imagery, which was used to estimate the vegetation coverage of the island. The vegetation zone dataset should not be used to calculate total vegetation coverage of the island.
HI_LongBeach_Macaroni_Colony_2012-2016 was digitised from three pansharpened images derived from multispectral and panchromatic two GeoEye-1 satellite imageries acquired on 2 February 2012 and 6 February 2014 and Worldview-2 imagery acquired on 21 February 2016.
The HI_Heritage_Zone_2021; HI_MainUseZone_2021; HI_RestrictedZone_2021; and HI-VisitorAccessZone_2021 were all digitised based on the areas as defined in the 2014-224 Management Plan and altered to fit the new 2014 coastline. HI_WildernessZone_2014 is a duplicate of the HI_Coastline_2014 with the symbology altered to reflect the Wilderness Zone as defined in the Management Plan 2014-2024.
The McDonald Island coastline for 1980 (McD_1980_coastline) was digitised from the georeferenced 1980 aerial photo casa9491 image; the McD_2003_coastline was digitised from a pansharpened image derived from multispectral and panchromatic Digital Globe Quickbird satellite imagery acquired on 9 April 2003; the McD_coastline_2012 was digitised from a pansharpened image derived from multispectral and panchromatic Digital Globe GeoEye-1 satellite imagery acquired on 19 May 2012 and the McD_RestrictedZone_2022 was digitised from a pansharpened image derived from multispectral and panchromatic Maxar Worldview-3 satellite imagery acquired on 25 June 2020. As it encompasses the entire island it is also the 2020 coastline for McDonald Island.
This project contains the following unaltered files:
ANARE historical Sites
countours_terrasar_100m_draft
flyingbird_pt_heard_pt_0304
sealer historical sites
WATERCOURSE_LN_heard
This project contains the following altered/edited files:
Antarctic prion nests
HI_South Georgian diving petrel 2003-4
Current buildings on HI_2001
HI_Refuge_operational
ShagIsland_Sail_DruryRocks
Alert Island 2008
This project contains the following new files:
HI glaciers 2014
HI_Coastline_2014
HI_Lagoons2014
HI_Vegetation Zone 2014
HI_LongBeach_Macaroni_Colony_2012-2016
HI_Heritage_Zone_2021
HI_MainUseZone_2021
HI_RestrictedZone_2021
HI-VisitorAccessZone_2021
HI_WildernessZone_2014
McD_1980_coastline
McD_2003_coastline
McD_coastline_2012
McD_RestrictedZone_2022 (same as McD_coastline_2020)- w
Sewerage Treatment Plants, Wastewater Treatment Plant FC of Wastewater...
- data.wu.ac.at
Updated Aug 19, 2017ShareFacebookTwitterEmailClick to copy linkLink copiedCiteNSGIC Local Govt | GIS Inventory (2017). Sewerage Treatment Plants, Wastewater Treatment Plant FC of Wastewater Utility Map of City of Ashland, WI, Published in 2007, 1:600 (1in=50ft) scale, City of Ashland Government. [Dataset]. https://data.wu.ac.at/schema/data_gov/MzVlOThlNGEtODQwNC00ZTZkLWI0MmQtNzU2NWM2MzZjYjk1Dataset updatedAug 19, 2017Dataset provided byNSGIC Local Govt | GIS InventoryArea covered3e8d2cda96e5495aec56f466763b873acac99cb2, AshlandDescriptionSewerage Treatment Plants dataset current as of 2007. Wastewater Treatment Plant FC of Wastewater Utility Map of City of Ashland, WI.
- d
Water Distribution Lines, Water Main FC of Water Utility Map of City of...
- datadiscoverystudio.org
Updated Jan 1, 2007ShareFacebookTwitterEmailClick to copy linkLink copiedCiteCity of Ashland Government (2007). Water Distribution Lines, Water Main FC of Water Utility Map of City of Ashland, WI, Published in 2007, 1:600 (1in=50ft) scale, City of Ashland Government. [Dataset]. http://datadiscoverystudio.org/geoportal/rest/metadata/item/91ee5eec579543fdbfb38d29d11b1c81/htmlDataset updatedJan 1, 2007Dataset authored and provided byCity of Ashland GovernmentArea coveredDescriptionWater Distribution Lines dataset current as of 2007. Water Main FC of Water Utility Map of City of Ashland, WI.
- C
DSM2 Georeferenced Model Grid
- data.cnra.ca.gov
- data.ca.gov
Updated Jun 2, 2025+ more versionsShareFacebookTwitterEmailClick to copy linkLink copiedCiteCalifornia Department of Water Resources (2025). DSM2 Georeferenced Model Grid [Dataset]. https://data.cnra.ca.gov/dataset/dsm2-georeferenced-model-gridpdf(22679496), arcgis desktop map package(300515), zip(158973), pdf(22669649), zip(159621), pdf(20463896), zip(228604), arcgis desktop map package(211110), arcgis pro map package(153901), zip(26881), pdf(25962387), pdf(1443441), zip(140121)Available download formatsDataset updatedJun 2, 2025Dataset authored and provided byCalifornia Department of Water ResourcesDescriptionArcGIS and QGIS map packages, with ESRI shapefiles for the DSM2 Model Grid. These are not finalized products. Locations in these shapefiles are approximate.
Monitoring Stations - shapefile with approximate locations of monitoring stations.
DSM2 Grid 2025-05-28 Historical
FC_2023.01
DSM2 v8.2.0, calibrated version:
- dsm2_8_2_grid_map_calibrated.mpkx - ArcGIS Pro map package containing all layers and symbology for the calibrated grid map.
- dsm2_8_2_grid_map_calibrated.mpk - ArcGIS Desktop map package containing all layers and symbology for the calibrated grid map.
- dsm2_8_2_0_calibrated_grid_map_qgis.zip - QGIS map package containing all layers and symbology for the calibrated grid map.
- dsm2_8_2_0_calibrated_gridmap_shapefiles.zip - A zip file containing all the shapefiles used in the above map packages:
- dsm2_8_2_0_calibrated_channels_centerlines - channel centerlines, follwing the path of CSDP centerlines
- dsm2_8_2_0_calibrated_network_channels - channels represented by straight line segments which are connected the upstream and downstream nodes
- dsm2_8_2_0_calibrated_nodes - DSM2 nodes
- dsm2_8_2_0_calibrated_dcd_only_nodes - Nodes that are only used by DCD
- dsm2_8_2_0_calibrated_and_dcd_nodes - Nodes that are shared by DSM2 and DCD
- dsm2_8_2_0_calibrated_and_smcd_nodes - Nodes that are shared by DSM2 and SMCD
- dsm2_8_2_0_calibrated_gates_actual_loc - The approximate actual locations of each gate in DSM2
- dsm2_8_2_0_calibrated_gates_grid_loc - The locations of each gate in the DSM2 model grid
- dsm2_8_2_0_calibrated_reservoirs - The approximate locations of the reservoirs in DSM2
- dsm2_8_2_0_calibrated_reservoir_connections - Lines showing connections from reservoirs to nodes in DSM2
DSM2 v8.2.1, historical version:
- DSM2 v8.2.1, historical version grid map release notes (PDF), updated 7/12/2022
- DSM2 v8.2.1, historical version grid map, single zoom level (PDF)
- DSM2 v8.2.1, historical version grid map, multiple zoom levels (PDF) - PDF grid map designed to be printed on 3 foot wide plotter paper.
- DSM2 v8.2.1, historical version map package for ArcGIS Desktop: A map package for ArcGIS Desktop containing the grid map layers with symbology.
- DSM2 v8.2.1, historical version grid map shapefiles (zip): A zip file containing the shapefiles used in the grid map.
Change Log
7/12/2022: The document "DSM2 v8.2.1, historical version grid map release notes (PDF)" was corrected by removing section 4.4, which incorrectly stated that the grid included channels 710-714, representing the Toe Drain, and that the Yolo Flyway restoration area was included.
Raw data of based-voxel functional connectivity in terms of ROIs.
- plos.figshare.com
zipUpdated Jun 4, 2023ShareFacebookTwitterEmailClick to copy linkLink copiedCiteYun Li; Shengpei Wang; Chuxiong Pan; Fushan Xue; Junfang Xian; Yaqi Huang; Xiaoyi Wang; Tianzuo Li; Huiguang He (2023). Raw data of based-voxel functional connectivity in terms of ROIs. [Dataset]. http://doi.org/10.1371/journal.pone.0192358.s001zipAvailable download formatsUnique identifierhttps://doi.org/10.1371/journal.pone.0192358.s001Dataset updatedJun 4, 2023AuthorsYun Li; Shengpei Wang; Chuxiong Pan; Fushan Xue; Junfang Xian; Yaqi Huang; Xiaoyi Wang; Tianzuo Li; Huiguang HeLicenseAttribution 4.0 (CC BY 4.0)https://creativecommons.org/licenses/by/4.0/
License information was derived automaticallyDescriptionThe zip file can be unzipped to a set of MATALB *.mat files, which contain based-voxel functional connectivity data and relevant information. The whole data set can be divided into two groups, i.e., sleep group and anesthesia group. The sleep group data includes two states (sleeping and waking), while the anesthesia group data includes three states (waking, mild-PIS and deep-PIS). (ZIP)
FacebookTwitterDetailed information of the between-condition differences in the PCC-FC maps within the DMN.
Attribution 4.0 (CC BY 4.0)https://creativecommons.org/licenses/by/4.0/
License information was derived automatically
The statistical threshold was set at |t|>2.093 (P486 mm3, which corresponds to a corrected P