Steam Dataset 2025: Multi-Modal Gaming Analytics
- kaggle.com
zipUpdated Oct 7, 2025 Share
Share Facebook
 Twitter
 EmailClick to copy linkLink copiedCiteCrainBramp (2025). Steam Dataset 2025: Multi-Modal Gaming Analytics [Dataset]. https://www.kaggle.com/datasets/crainbramp/steam-dataset-2025-multi-modal-gaming-analyticszip(12478964226 bytes)Available download formatsDataset updatedOct 7, 2025AuthorsCrainBrampLicense
Attribution 4.0 (CC BY 4.0)https://creativecommons.org/licenses/by/4.0/
License information was derived automaticallyDescriptionSteam Dataset 2025: Multi-Modal Gaming Analytics Platform
The first multi-modal Steam dataset with semantic search capabilities. 239,664 applications collected from official Steam Web APIs with PostgreSQL database architecture, vector embeddings for content discovery, and comprehensive review analytics.
Made by a lifelong gamer for the gamer in all of us. Enjoy!🎮
GitHub Repository https://github.com/vintagedon/steam-dataset-2025
https://www.googleapis.com/download/storage/v1/b/kaggle-user-content/o/inbox%2F28514182%2F4b7eb73ac0f2c3cc9f0d57f37321b38f%2FScreenshot%202025-10-18%20180450.png?generation=1760825194507387&alt=media" alt=""> 1024-dimensional game embeddings projected to 2D via UMAP reveal natural genre clustering in semantic space
What Makes This Different
Unlike traditional flat-file Steam datasets, this is built as an analytically-native database optimized for advanced data science workflows:
☑️ Semantic Search Ready - 1024-dimensional BGE-M3 embeddings enable content-based game discovery beyond keyword matching
☑️ Multi-Modal Architecture - PostgreSQL + JSONB + pgvector in unified database structure
☑️ Production Scale - 239K applications vs typical 6K-27K in existing datasets
☑️ Complete Review Corpus - 1,048,148 user reviews with sentiment and metadata
☑️ 28-Year Coverage - Platform evolution from 1997-2025
☑️ Publisher Networks - Developer and publisher relationship data for graph analysis
☑️ Complete Methodology & Infrastructure - Full work logs document every technical decision and challenge encountered, while my API collection scripts, database schemas, and processing pipelines enable you to update the dataset, fork it for customized analysis, learn from real-world data engineering workflows, or critique and improve the methodology
https://www.googleapis.com/download/storage/v1/b/kaggle-user-content/o/inbox%2F28514182%2F649e9f7f46c6ce213101d0948c89e8ac%2F4_price_distribution_by_top_10_genres.png?generation=1760824835918620&alt=media" alt=""> Market segmentation and pricing strategy analysis across top 10 genres
What's Included
Core Data (CSV Exports): - 239,664 Steam applications with complete metadata - 1,048,148 user reviews with scores and statistics - 13 normalized relational tables for pandas/SQL workflows - Genre classifications, pricing history, platform support - Hardware requirements (min/recommended specs) - Developer and publisher portfolios
Advanced Features (PostgreSQL): - Full database dump with optimized indexes - JSONB storage preserving complete API responses - Materialized columns for sub-second query performance - Vector embeddings table (pgvector-ready)
Documentation: - Complete data dictionary with field specifications - Database schema documentation - Collection methodology and validation reports
Example Analysis: Published Notebooks (v1.0)
Three comprehensive analysis notebooks demonstrate dataset capabilities. All notebooks render directly on GitHub with full visualizations and output:
📊 Platform Evolution & Market Landscape
View on GitHub | PDF Export
28 years of Steam's growth, genre evolution, and pricing strategies.🔍 Semantic Game Discovery
View on GitHub | PDF Export
Content-based recommendations using vector embeddings across genre boundaries.🎯 The Semantic Fingerprint
View on GitHub | PDF Export
Genre prediction from game descriptions - demonstrates text analysis capabilities.Notebooks render with full output on GitHub. Kaggle-native versions planned for v1.1 release. CSV data exports included in dataset for immediate analysis.
https://www.googleapis.com/download/storage/v1/b/kaggle-user-content/o/inbox%2F28514182%2F4079e43559d0068af00a48e2c31f0f1d%2FScreenshot%202025-10-18%20180214.png?generation=1760824950649726&alt=media" alt=""> *Steam platfor...
Cause of Loss Historical Files
- catalog.data.gov
- cloud.csiss.gmu.edu
- +2more
Updated Apr 21, 2025ShareFacebookTwitterEmailClick to copy linkLink copiedCiteU. S. Department of Agriculture (2025). Cause of Loss Historical Files [Dataset]. https://catalog.data.gov/dataset/cause-of-loss-historical-filesDataset updatedApr 21, 2025DescriptionThe Risk Management Agency (RMA) Cause of Loss Historical Files summarize participation information broken down by the causes of loss. Each link contains a ZIP file with compressed data containing CSV flat-files that can be imported into any standard spreadsheet and/or database for further analysis. Record description file located in each subfolder.
Ahmedabad Cleaned Flat Dataset
- kaggle.com
zipUpdated May 19, 2025ShareFacebookTwitterEmailClick to copy linkLink copiedCiteDhruv Bavaliya (2025). Ahmedabad Cleaned Flat Dataset [Dataset]. https://www.kaggle.com/datasets/dhruvbavaliya/ahmedabad-cleaned-flat-datasetzip(49378 bytes)Available download formatsDataset updatedMay 19, 2025AuthorsDhruv BavaliyaLicensehttps://creativecommons.org/publicdomain/zero/1.0/https://creativecommons.org/publicdomain/zero/1.0/
Area coveredAhmedabadDescriptionOverview: This dataset contains information about residential properties in Ahmedabad, Gujarat, India. It includes details such as property prices, area (in square feet), number of bedrooms (BHK), location, and floor number. The data is useful for exploratory analysis, visualization, and understanding real estate trends in Ahmedabad. However, it may not be sufficient for highly accurate predictive modeling due to potential biases and limitations in the dataset.
Key Features: price: The price of the property in lakhs (1 lakh = 100,000 INR).
price_sqft: The price per square foot of the property (INR/sqft).
bhk: The number of bedrooms in the property (BHK).
location: The locality or neighborhood where the property is situated.
total_sqft: The total area of the property in square feet.
floor_num: The floor number on which the property is located.
Potential Use Cases: Exploratory Data Analysis (EDA): Understand the distribution of property prices, area, and other features.
Visualization: Create visualizations to compare prices across different locations, BHK configurations, or floor levels.
Market Trends: Analyze trends in property prices and demand in various neighborhoods of Ahmedabad.
Comparative Studies: Compare property prices and features across different localities or property types.
Limitations: Biased Data: The dataset may not be fully representative of the entire Ahmedabad real estate market, leading to potential biases.
Modeling Limitations: The dataset may not be sufficient for highly accurate predictive modeling. For example, hyperparameter tuning using GridSearchCV yielded model scores below 57%, indicating limited predictive power.
Incomplete Features: Additional features like amenities, proximity to landmarks, or property age could improve analysis but are not included.
Source: This dataset was derived from the "Prayesh Godhani Ahmedabad.csv" dataset after thorough data cleaning and preprocessing.
Suggestions for Use: Focus on descriptive analysis and visualizations rather than predictive modeling.
Combine this dataset with other relevant datasets (e.g., demographic data, infrastructure details) for richer insights.
Use it as a baseline for understanding Ahmedabad's real estate market before incorporating more comprehensive data.
Acknowledgments: Original data source: Prayesh Godhani's Ahmedabad dataset. Data cleaning and preprocessing: Dhruv Bavaliya
- H
Woods & Poole Complete US Database
- dataverse.harvard.edu
- search.dataone.org
Updated Feb 14, 2024ShareFacebookTwitterEmailClick to copy linkLink copiedCiteWoods & Poole (2024). Woods & Poole Complete US Database [Dataset]. http://doi.org/10.7910/DVN/ZCPMU6CroissantCroissant is a format for machine-learning datasets. Learn more about this at mlcommons.org/croissant.Unique identifierhttps://doi.org/10.7910/DVN/ZCPMU6Dataset updatedFeb 14, 2024Dataset provided byHarvard DataverseAuthorsWoods & PooleLicensehttps://dataverse.harvard.edu/api/datasets/:persistentId/versions/2.1/customlicense?persistentId=doi:10.7910/DVN/ZCPMU6https://dataverse.harvard.edu/api/datasets/:persistentId/versions/2.1/customlicense?persistentId=doi:10.7910/DVN/ZCPMU6
Time period covered1970 - 2050Area coveredUnited StatesDescriptionThe 2018 edition of Woods and Poole Complete U.S. Database provides annual historical data from 1970 (some variables begin in 1990) and annual projections to 2050 of population by race, sex, and age, employment by industry, earnings of employees by industry, personal income by source, households by income bracket and retail sales by kind of business. The Complete U.S. Database contains annual data for all economic and demographic variables for all geographic areas in the Woods & Poole database (the U.S. total, and all regions, states, counties, and CBSAs). The Complete U.S. Database has following components: Demographic & Economic Desktop Data Files: There are 122 files covering demographic and economic data. The first 31 files (WP001.csv – WP031.csv) cover demographic data. The remaining files (WP032.csv – WP122.csv) cover economic data. Demographic DDFs: Provide population data for the U.S., regions, states, Combined Statistical Areas (CSAs), Metropolitan Statistical Areas (MSAs), Micropolitan Statistical Areas (MICROs), Metropolitan Divisions (MDIVs), and counties. Each variable is in a separate .csv file. Variables: Total Population Population Age (breakdown: 0-4, 5-9, 10-15 etc. all the way to 85 & over) Median Age of Population White Population Population Native American Population Asian & Pacific Islander Population Hispanic Population, any Race Total Population Age (breakdown: 0-17, 15-17, 18-24, 65 & over) Male Population Female Population Economic DDFs: The other files (WP032.csv – WP122.csv) provide employment and income data on: Total Employment (by industry) Total Earnings of Employees (by industry) Total Personal Income (by source) Household income (by brackets) Total Retail & Food Services Sales ( by industry) Net Earnings Gross Regional Product Retail Sales per Household Economic & Demographic Flat File: A single file for total number of people by single year of age (from 0 to 85 and over), race, and gender. It covers all U.S., regions, states, CSAs, MSAs and counties. Years of coverage: 1990 - 2050 Single Year of Age by Race and Gender: Separate files for number of people by single year of age (from 0 years to 85 years and over), race (White, Black, Native American, Asian American & Pacific Islander and Hispanic) and gender. Years of coverage: 1990 through 2050. DATA AVAILABLE FOR 1970-2019; FORECASTS THROUGH 2050
- Z
Full-Body 3D Human Gait Dataset walking on flat ground
- data.niaid.nih.gov
- zenodo.org
Updated Dec 2, 2024ShareFacebookTwitterEmailClick to copy linkLink copiedCiteCarneros Prado, David; Cabañero Gómez, Luis; Dobrescu, Constantin Cosmin; Villa, Laura; Altamirano-Flores, Yulith V.; Lopez-Nava, Irvin Hussein; González Díaz, Iván; Fontecha, Jesus; Hervas, Ramon (2024). Full-Body 3D Human Gait Dataset walking on flat ground [Dataset]. https://data.niaid.nih.gov/resources?id=zenodo_12818934Dataset updatedDec 2, 2024Dataset provided byCenter for Scientific Research and Higher Education at Ensenada
University of Castilla-La ManchaAuthorsCarneros Prado, David; Cabañero Gómez, Luis; Dobrescu, Constantin Cosmin; Villa, Laura; Altamirano-Flores, Yulith V.; Lopez-Nava, Irvin Hussein; González Díaz, Iván; Fontecha, Jesus; Hervas, RamonLicenseAttribution 4.0 (CC BY 4.0)https://creativecommons.org/licenses/by/4.0/
License information was derived automaticallyDescriptionThis dataset contains full-body 3D gait data collected from 26 healthy participants (10 males, 16 females) with an average age of 28.19 ± 7.77 years. Data was captured using the Xsens Awinda MTw inertial measurement system, comprising 17 wireless sensors operating at a 60Hz sampling frequency.
Key Features:
Full-body motion data using MVN Analyze software's full-body model
Anthropometric measurements: height (170.5 ± 8.61 cm), foot length (26.47 ± 1.88 cm), shoulder width (39.32 ± 7.79 cm), and wrist span (131.36 ± 8.85 cm)
Four distinct walking paths: Mixed (straight and curved), Circle (3m diameter), Turn (180-degree turns), and Zigzag
Total of 1,024,295 frames (17,071.58 seconds) of gait recordings
Average of 3,568.97 ± 1,204.26 frames per recording (59.48 ± 20.07 seconds)
The dataset includes various walking patterns designed to capture a wide range of gait characteristics, including straight walks, gentle curves, sharp turns, and zigzag movements. Participants were allowed some freedom in executing turns, particularly in the Zigzag and Mixed paths, to introduce natural variations in gait patterns.
This comprehensive dataset is suitable for gait analysis, biomechanics research, and the development of motion synthesis algorithms, particularly those focused on normal walking patterns on a fixed surface with various turning scenarios.
Dataset Structure:
'participants.xlsx': An Excel file containing participant codes and their anthropometric data.
'data' folder: Contains subdirectories named with participant codes.
Each participant subdirectory contains CSV files of different gait recordings for that participant.
This dataset was collected as part of the study:
Carneros-Prado, D., Dobrescu, C. C., Cabañero, L., Villa, L., Altamirano-Flores, Y. V., Lopez-Nava, I. H., … & Hervás, R. (2024). Synthetic 3D full-body skeletal motion from 2D paths using RNN with LSTM cells and linear networks. Computers in Biology and Medicine, 180, 108943.
- d
Gulf Coast Network Vegetation Monitoring Database Exports: 2018 through...
- catalog.data.gov
Updated Nov 13, 2025ShareFacebookTwitterEmailClick to copy linkLink copiedCiteNational Park Service (2025). Gulf Coast Network Vegetation Monitoring Database Exports: 2018 through January 2024 [Dataset]. https://catalog.data.gov/dataset/gulf-coast-network-vegetation-monitoring-database-exports-2018-through-january-2024Dataset updatedNov 13, 2025Dataset provided byNational Park ServiceDescriptionFlat file (.csv) exports from the latest accepted datasets for the Gulf Coast Network Vegetation Monitoring Project.
Belgian ground-motion database (BELSHAKE) flatfile
- zenodo.org
- data.niaid.nih.gov
csv, png, txtUpdated Apr 18, 2025+ more versionsShareFacebookTwitterEmailClick to copy linkLink copiedCiteKris Vanneste; Kris Vanneste; Mahsa Onvani; Mahsa Onvani (2025). Belgian ground-motion database (BELSHAKE) flatfile [Dataset]. http://doi.org/10.5281/zenodo.15241694png, csv, txtAvailable download formatsUnique identifierhttps://doi.org/10.5281/zenodo.15241694Dataset updatedApr 18, 2025AuthorsKris Vanneste; Kris Vanneste; Mahsa Onvani; Mahsa OnvaniLicenseAttribution 4.0 (CC BY 4.0)https://creativecommons.org/licenses/by/4.0/
License information was derived automaticallyTime period coveredApr 17, 2025Area coveredBelgiumDescriptionBELSHAKE is the Belgian ground-motion database compiled in the frame of a BRAIN-be project funded by the Belgian Science Policy. It contains various intensity measures computed from digital waveform data recorded mainly by the Belgian seismic network for natural and induced/triggered earthquakes with ML ≥ 2.5 in the region -1° - 9° E and 49° - 52° N, and with ML ≥ 2.0 in the region 2.5° - 7° E and 49.25° - 51.5° N since 1985.
The data are distributed in the form of 2 flatfiles in CSV-format: a generic flatfile (specification defined in accompanying TXT file) and a flatfile that is compatible with the French RESIF database.
The main changes with respect to the previous release are summarized in version_notes.txt. A detailed changelog for the entire database can be found in CHANGELOG.txt.
Camas National Wildlife Refuge: Invasive Plant Inventory and Early Detection...
- catalog.data.gov
Updated Nov 25, 2025+ more versionsShareFacebookTwitterEmailClick to copy linkLink copiedCiteU.S. Fish and Wildlife Service (2025). Camas National Wildlife Refuge: Invasive Plant Inventory and Early Detection Prioritization Tool (IPIEDT) - Area, Species, Area-Species Link Tables [Dataset]. https://catalog.data.gov/dataset/camas-national-wildlife-refuge-invasive-plant-inventory-and-early-detection-prioritizationDataset updatedNov 25, 2025DescriptionThe IPIEDT is an Access Database file. The user responds to questions in a “yes/no/unknown” format or chooses from a list of states or conditions that best describe the situation. Each descriptive response corresponds to a numerical value which is then used to calculate species and area scores and generate ranked lists. A higher species or area score correlates to a higher priority for inventory. A project team built from Refuge and Branch staff, as well as local weed experts met in October 2019 to define and prioritize refuge species and areas for future invasive plant inventory. The workshop's resulting data tables are archived so that the results of the workshop are preserved if the master database receives changes based on new threats or areas. Each Invasive Plant Species and Area Prioritization Workshop will have an IPIEDT Access database and 2-3 stand-alone CSV outputs. Each table is offered as an open source CSV and the Access Database tool zipped and is also available for download. An update of the Species Prioritization was completed in 2022, incorporating data from inventory and monitoring activities and associated management that occurred from 2020 to 2022. An updated database and flat file are included in this reference.
- d
Technographic Data | 22M Records | Refreshed 2x/Mo | Delivery Hourly via...
- datarade.ai
.json, .csv, .sqlUpdated Jan 1, 2023+ more versionsShareFacebookTwitterEmailClick to copy linkLink copiedCiteForager.ai (2023). Technographic Data | 22M Records | Refreshed 2x/Mo | Delivery Hourly via CSV/JSON/PostgreSQL DB Delivery | B2B Data [Dataset]. https://datarade.ai/data-products/technographic-data-22m-records-refreshed-2x-mo-delivery-forager-ai.json, .csv, .sqlAvailable download formatsDataset updatedJan 1, 2023Dataset provided byForager.aiArea coveredCanada, State of, Lithuania, South Georgia and the South Sandwich Islands, Botswana, Togo, Liechtenstein, Guernsey, French Southern Territories, NetherlandsDescriptionThe Forager.ai Global Install Base Data set is a leading source of firmographic data, backed by advanced AI and offering the highest refresh rate in the industry.
| Volume and Stats |
- Over 22M total records, the highest volume in the industry today.
- Every company record refreshed twice a month, offering an unparalleled update frequency.
- Delivery is made every hour, ensuring you have the latest data at your fingertips.
- Each record is the result of an advanced AI-driven process, ensuring high-quality, accurate data.
| Use Cases |
Sales Platforms, ABM and Intent Data Platforms, Identity Platforms, Data Vendors:
Example applications include:
Uncover trending technologies or tools gaining popularity.
Pinpoint lucrative business prospects by identifying similar solutions utilized by a specific company.
Study a company's tech stacks to understand the technical capability and skills available within that company.
B2B Tech Companies:
- Enrich leads that sign-up through the Company Search API (available separately).
- Identify and map every company that fits your core personas and ICP.
- Build audiences to target, using key fields like location, company size, industry, and description.
Venture Capital and Private Equity:
- Discover new investment opportunities using company descriptions and industry-level data.
- Review the growth of private companies and benchmark their strength against competitors.
- Create high-level views of companies competing in popular verticals for investment.
| Delivery Options |
- Flat files via S3 or GCP
- PostgreSQL Shared Database
- PostgreSQL Managed Database
- API
- Other options available upon request, depending on the scale required
Our dataset provides a unique blend of volume, freshness, and detail that is perfect for Sales Platforms, B2B Tech, VCs & PE firms, Marketing Automation, ABM & Intent. It stands as a cornerstone in our broader data offering, ensuring you have the information you need to drive decision-making and growth.
Tags: Company Data, Company Profiles, Employee Data, Firmographic Data, AI-Driven Data, High Refresh Rate, Company Classification, Private Market Intelligence, Workforce Intelligence, Public Companies.
Caltech-256: Pre-Processed 80/20 Train-Test Split
- kaggle.com
zipUpdated Nov 12, 2025ShareFacebookTwitterEmailClick to copy linkLink copiedCiteKUSHAGRA MATHUR (2025). Caltech-256: Pre-Processed 80/20 Train-Test Split [Dataset]. https://www.kaggle.com/datasets/kushubhai/caltech-256-train-testzip(1138799273 bytes)Available download formatsDataset updatedNov 12, 2025AuthorsKUSHAGRA MATHURLicenseMIT Licensehttps://opensource.org/licenses/MIT
License information was derived automaticallyDescriptionContext The Caltech-256 dataset is a foundational benchmark for object recognition, containing 30,607 images across 257 categories (256 object categories + 1 clutter category).
The original dataset is typically provided as a collection of directories, one for each category. This version streamlines the machine learning workflow by providing:
A clean, pre-defined 80/20 train-test split.
Manifest files (train.csv, test.csv) that map image paths directly to their labels, allowing for easy use with data generators in frameworks like PyTorch and TensorFlow.
A flat directory structure (train/, test/) for simplified file access.
File Content The dataset is organized into a single top-level folder and two CSV files:
train.csv: A CSV file containing two columns: image_path and label. This file lists all images designated for the training set.
test.csv: A CSV file with the same structure as train.csv, listing all images designated for the testing set.
Caltech-256_Train_Test/: The primary data folder.
train/: This directory contains 80% of the images from all 257 categories, intended for model training.
test/: This directory contains the remaining 20% of the images from all categories, reserved for model evaluation.
Data Split The dataset has been thoroughly partitioned to create a standard 80% training and 20% testing split. This split is (or should be assumed to be) stratified, meaning that each of the 257 object categories is represented in roughly an 80/20 proportion in the respective sets.
Acknowledgements & Original Source This dataset is a derivative work created for convenience. The original data and images belong to the authors of the Caltech-256 dataset.
Original Dataset Link: https://www.kaggle.com/datasets/jessicali9530/caltech256/data
Citation: Griffin, G. Holub, A.D. Perona, P. (2007). Caltech-256 Object Category Dataset. California Institute of Technology.
Effects of community management on user activity in online communities
- zenodo.org
- data.niaid.nih.gov
zipUpdated Apr 24, 2025ShareFacebookTwitterEmailClick to copy linkLink copiedCiteAlberto Cottica; Alberto Cottica (2025). Effects of community management on user activity in online communities [Dataset]. http://doi.org/10.5281/zenodo.1320261zipAvailable download formatsUnique identifierhttps://doi.org/10.5281/zenodo.1320261Dataset updatedApr 24, 2025AuthorsAlberto Cottica; Alberto CotticaLicenseAttribution 4.0 (CC BY 4.0)https://creativecommons.org/licenses/by/4.0/
License information was derived automaticallyDescriptionData and code needed to reproduce the results of the paper "Effects of community management on user activity in online communities", available in draft here.
Instructions:
- Unzip the files.
- Start with JSON files obtained from calling platform APIs: each dataset consists of one file for posts, one for comments, one for users. In the paper we use two datasets, one referring Edgeryders, the other to Matera 2019.
- Run them through edgesense (https://github.com/edgeryders/edgesense). Edgesense allows to set the length of the observation period. We set it to 1 week and 1 day for Edgeryders data, and to 1 day for Matera 2019 data. Edgesense stores its results in a file called JSON network.min.json, which we then rename to keep track of the data source and observation length.
- Launch Jupyter Notebook and run the notebook provided to convert the network.min.json files into CSV flat files, one for each netwrk file
- Launch Stata and open each flat csv files with it, then save it in Stata format.
- Use the provided Stata .do scripts to replicate results.
Please note: I use both Stata and Jupyter Notebook interactively, running a block with a few lines of code at a time. Expect to have to change directories, file names etc.
- r
Victoria road crash data
- researchdata.edu.au
Updated Aug 10, 2025+ more versionsShareFacebookTwitterEmailClick to copy linkLink copiedCiteDepartment of Transport and Planning (2025). Victoria road crash data [Dataset]. https://researchdata.edu.au/victoria-road-crash-data/falseDataset updatedAug 10, 2025Dataset provided bydata.vic.gov.auAuthorsDepartment of Transport and PlanningLicenseAttribution 4.0 (CC BY 4.0)https://creativecommons.org/licenses/by/4.0/
License information was derived automaticallyDescriptionThis data has been consolidated from Victoria Police reports and Hospital injury information, then validated and enriched to provide a comprehensive and detailed view of road crashes and injuries across Victoria. The data provides users with information about Victorian fatal and injury road crash data based on time, location, conditions, crash type, road user type, and other relevant attributes.
Data Currency
This information will be updated on a monthly basis but with a 7 month lag in order to provide a comprehensive view of incidents during that time period.
Data Structure
The CSV data is split across multiple tables with attributes to facilitate joins between the information. This has been captured as part of the supporting documentation in the metadata. The tables and attributes include: \- accident (basic accident details, time, severity, location) \- person (person based details, age, gender etc) \- vehicle (vehicle based data, vehicle type, make etc) \- accident\_event (sequence of events e.g. left road, rollover, caught fire) \- road\_surface\_cond (whether road was wet, dry, icy etc) \- atmospheric\_cond (rain, winds etc) \- sub\_dca (detailed codes describing accident) \- accident\_node (master location table \- NB subset of accident table) \- Node Table with Lat/Long references
There is also a lite Victoria Road Crash .csv dataset is a single flat file containing a subset of the attributes from the other CSV files. It provides a single set of attributes for each road crash that has occurred within Victoria. Supporting documentation in the metadata will provide further details of the attributes. This used to be a .GeoJSON file however due to feedback from a significant number of Open Data users, this was changed to a .csv file.
Disclaimer
No claim is made as to the accuracy or currency of the content on this site at any time, there will be instances where attributes relating to a crash are amended over time. This data is provided on the basis that users undertake responsibility for assessing the relevance and accuracy of its content. Data relating to fatal crashes that have occurred recently are provisional and are subject to change or removal. They will have a high level of incompleteness and details will be amended before they are finalised. The Victorian Government and Department of Transport and Planning accept no liability to any person or group for the data or advice (or the use of such data or advice) which is provided or incorporated into it by reference. - f
Amphibian Karyotype Database
- datasetcatalog.nlm.nih.gov
- figshare.com
Updated Jul 9, 2019ShareFacebookTwitterEmailClick to copy linkLink copiedCiteBlackmon, Heath (2019). Amphibian Karyotype Database [Dataset]. https://datasetcatalog.nlm.nih.gov/dataset?q=0000130592Dataset updatedJul 9, 2019AuthorsBlackmon, HeathDescriptionThe Amphibian Karyotype Database contains 2,124 karyotypes which we have compiled from 371 publications. This dataset is the originally published version of the data in a flat CSV file.
- d
Global CEO & Startup Contact Data | Verified & Bi-Weekly Updates
- datarade.ai
.json, .csvShareFacebookTwitterEmailClick to copy linkLink copiedCiteForager.ai, Global CEO & Startup Contact Data | Verified & Bi-Weekly Updates [Dataset]. https://datarade.ai/data-products/global-ceo-startup-contact-data-verified-bi-weekly-updates-forager-ai.json, .csvAvailable download formatsDataset provided byForager.aiArea coveredSlovenia, Kazakhstan, Panama, Liberia, Liechtenstein, Portugal, Germany, Andorra, Pitcairn, RomaniaDescriptionForager.ai - Global B2B Person Data Set is a comprehensive and AI-powered collection of over 720M professional LinkedIn profiles. Our dataset is refreshed bi-weekly (2x/month) to ensure the most up-to-date and dynamic information, setting the industry standard for data accuracy and coverage. Delivered via JSON or CSV formats, it captures publicly available information on professional profiles across industries and geographies.
| Volume and Stats | 755M+ Global Records, continually growing. Each record is refreshed twice a month, ensuring high data fidelity. Powered by first-party data curation, supporting leading sales and recruitment platforms. Hourly delivery, providing near-real-time data access. Multiple data formats: JSONL, CSV for seamless integration.
| Datapoints | 150+ unique data points available, including: Current Title, Current Company, Work History, Educational Background, location and contact details. with high accuracy +95%. Linkage to other social networks and contact data for added insights.
| Use Cases | Sales Platforms, ABM Vendors, and Intent Data Companies Fuel your platforms with fresh, accurate professional data. Gain insights from job changes and update your database in real time. Enhance contact enrichment for targeted marketing and sales outreach. Venture Capital (VC) and Private Equity (PE) Firms Track employees and founders in your portfolio companies and be the first to know when they change roles. Access employee growth trends to benchmark against competitors. Discover new talent for portfolio companies, optimizing recruitment efforts. HR Tech, ATS Platforms, and Recruitment Solutions Build effective, industry-agnostic recruitment platforms with a wealth of professional data. Track job transitions and automatically refresh profiles to eliminate outdated information. Identify top talent through work history, educational background, and skills analysis.
| Delivery Options | Flat files via S3 or Snowflake PostgreSQL Shared/Managed Database REST API Custom delivery options available upon request.
| Key Features | Over 180M U.S. Professional Profiles. 150+ Data Fields available upon request. Free data samples for evaluation purposes. Bi-Weekly Updates Data accuracy +95%
Tags: LinkedIn Data, Professional Data, Employee Data, Firmographic Data, Work Experience, Education Data, Account-Based Marketing (ABM), Intent Data, Identity Resolution, Talent Sourcing, Sales Database, Recruitment Solutions, Contact Enrichment.
- H
Data for: Childhood Acute Illness and Nutrition (CHAIN) Network: a...
- dataverse.harvard.edu
Updated Jan 11, 2024ShareFacebookTwitterEmailClick to copy linkLink copiedCiteThe Childhood Acute Illness and Nutrition Network (2024). Data for: Childhood Acute Illness and Nutrition (CHAIN) Network: a multi-site prospective cohort study to identify modifiable risk factors for mortality among acutely ill children in Africa and Asia [Dataset]. http://doi.org/10.7910/DVN/5H5X0PCroissantCroissant is a format for machine-learning datasets. Learn more about this at mlcommons.org/croissant.Unique identifierhttps://doi.org/10.7910/DVN/5H5X0PDataset updatedJan 11, 2024Dataset provided byHarvard DataverseAuthorsThe Childhood Acute Illness and Nutrition NetworkLicensehttps://dataverse.harvard.edu/api/datasets/:persistentId/versions/1.1/customlicense?persistentId=doi:10.7910/DVN/5H5X0Phttps://dataverse.harvard.edu/api/datasets/:persistentId/versions/1.1/customlicense?persistentId=doi:10.7910/DVN/5H5X0P
DescriptionThis dataset contains the entire data that was collected by the CHAIN prospective cohort study that was run between 01/11/2016 and 31/03/2019. The study was a multi-site longitudinal study that involved 9 sites in 6 countries. During the study, participant demographic, clinical, social, GPS and laboratory data was collected at various timepoints depending on a predetermined study activity schedule. This repository has been organized according to these broader domains. Each folder contains data files for that domain and these are in flat/wide format. Each domain folder has specific subdomain files, for instance, demographic contains anthropometry, dates and outcome flat files. Each folder contains both .csv and .dta (stata data file), however we recommend using the .csv files whenever possible as this is the generated file by the main reproducible script. Further to these folders, a note-to-file folder has been added that contains data cleaning notes for specific unresolvable queries that explain those data. Data dictionaries have been provided in two kinds: a main wide codebook of every variable and a leaner data domains file that contains specific variables per domain.
- e
Spatially Averaged Ice Contents of Ice-Wedge Polygon Cross-Sections to 3-m...
- knb.ecoinformatics.org
- search.dataone.org
- +2more
Updated Aug 8, 2023ShareFacebookTwitterEmailClick to copy linkLink copiedCiteJulie Jastrow; Roser Matamala; Chien-Lu Ping; Gary Michaelson; Timothy Vugteveen; Jeremy Lederhouse (2023). Spatially Averaged Ice Contents of Ice-Wedge Polygon Cross-Sections to 3-m Depth, July 2013, Utqiagvik, Alaska [Dataset]. http://doi.org/10.15485/1876898Unique identifierhttps://doi.org/10.15485/1876898Dataset updatedAug 8, 2023Dataset provided byESS-DIVEAuthorsJulie Jastrow; Roser Matamala; Chien-Lu Ping; Gary Michaelson; Timothy Vugteveen; Jeremy LederhouseTime period coveredJul 14, 2013 - Jul 22, 2013Area coveredDescriptionThis dataset contains spatially averaged estimates of ice content (volume percent) for two-dimensional cross-sectional profiles (from trough center to trough center to a depth of 3 meters) of low- and flat-centered ice-wedge polygons (three of each type) located near Utqiagvik, Alaska. A combination of soil pits, trenches, and cores were used to describe, sample, and map the cross-section stratigraphy of soil horizons and ice wedges for each polygon at 6 depth intervals. Observed soil horizons were assigned to four types with increasing amounts of organic components (mineral, mineral/organic, organic/mineral, and organic). The average ice contents of each soil horizon type below the permafrost boundary and wedge ice were weighted by their cross-sectional area fractions to calculate spatially averaged estimates of ice content for each polygon. In the active layer, spatially averaged estimates of volumetric water contents were similarly determined and reported here as “ice” content to enable estimates of the soil’s structurally competent porosity and excess ice in permafrost layers. In this dataset, the file AK13_ice_contents.csv includes cross-sectional area fractions and spatially averaged ice contents for soil layers and horizon types at the six depth intervals. The file AK13_permafrost_ice_fractions.csv contains the calculated partitioning of ice contents into pore ice and excess ice fractions for the three permafrost-dominated depth intervals. In addition, there is a data dictionary file for each of these data files and a file-level metadata file. These data were generated by the Department of Energy’s Soil Carbon Response to Environmental Change Scientific Focus Area and were used as inputs to model simulations examining the consequences of thaw-affected subsidence and microtopography change on active layer thickness of low-relief polygonal tundra landscapes in a warming Arctic.
Count Coins Image dataset
- kaggle.com
zipUpdated Oct 10, 2022ShareFacebookTwitterEmailClick to copy linkLink copiedCiteBala Baskar (2022). Count Coins Image dataset [Dataset]. https://www.kaggle.com/datasets/balabaskar/count-coins-image-datasetzip(113047419 bytes)Available download formatsDataset updatedOct 10, 2022AuthorsBala BaskarLicensehttps://creativecommons.org/publicdomain/zero/1.0/https://creativecommons.org/publicdomain/zero/1.0/
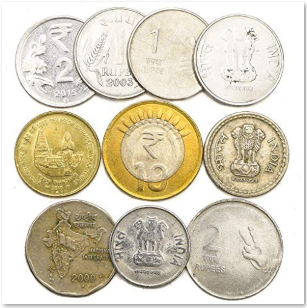
DescriptionIntroduction
A coin is a small, flat, (usually, depending on the country or value) round piece of metal or plastic used primarily as a medium of exchange or legal tender. They are standardized in weight, and produced in large quantities at a mint in order to facilitate trade. They are most often issued by a government. Coins often have images, numerals, or text on them. Obverse and its opposite, reverse, refer to the two flat faces of coins and medals. In this usage, obverse means the front face of the object and reverse means the back face. The obverse of a coin is commonly called heads because it often depicts the head of a prominent person, and the reverse tails. Coins are usually made of metal or an alloy, or sometimes of man-made materials. They are usually disc shaped. Coins made of valuable metal are stored in large quantities as bullion coins. Reference - Coins
Content
This dataset contains the coin images of various currencies, as listed below:
- US coins
- Chinese coins
- Yen coins
- Euro coins
- Indian Rupee coins
- Peso coins
The coin images are collected by scraped from Google Image searches and filtered, based on the coin image quality. Finally, the number of coins in the images are manually counted, to generate the ground truth.
The
coins_count_values.csvfile contains the ground truthChallenges
This dataset can be a good challenge for Kagglers, who are new to Image preprocessing, and also helpful for those who want to practice image preprocessing techniques.
- All coins are not round shaped
- Background of the coins is not the same
- Color of the coins is not the same
- Most of the coins present in the image collections are filtered based on the position of coins (horizontal flat) for ease of detection, but some coins images are added to challenge your preprocessing algorithm as shown below:

Hope you will find the dataset useful for practicing image processing/ computer vision skills.
Have fun and Happy Learning!
[Dataset] One year of high-precision operational data including measurement...
- zenodo.org
- data.niaid.nih.gov
bin, csv, json +1Updated Oct 18, 2024ShareFacebookTwitterEmailClick to copy linkLink copiedCiteDaniel Tschopp; Daniel Tschopp; Philip Ohnewein; Philip Ohnewein; Roman Stelzer; Roman Stelzer; Lukas Feierl; Lukas Feierl; Marnoch Hamilton-Jones; Marnoch Hamilton-Jones; Maria Moser; Maria Moser; Christian Holter; Christian Holter (2024). [Dataset] One year of high-precision operational data including measurement uncertainties from a large-scale solar thermal collector array with flat plate collectors, located in Graz, Austria [Dataset]. http://doi.org/10.5281/zenodo.7741084csv, text/x-python, json, binAvailable download formatsUnique identifierhttps://doi.org/10.5281/zenodo.7741084Dataset updatedOct 18, 2024AuthorsDaniel Tschopp; Daniel Tschopp; Philip Ohnewein; Philip Ohnewein; Roman Stelzer; Roman Stelzer; Lukas Feierl; Lukas Feierl; Marnoch Hamilton-Jones; Marnoch Hamilton-Jones; Maria Moser; Maria Moser; Christian Holter; Christian HolterLicenseAttribution 4.0 (CC BY 4.0)https://creativecommons.org/licenses/by/4.0/
License information was derived automaticallyArea coveredAustria, GrazDescriptionHighlights:
- High-precision measurement data acquired within a scientific research project, using high-quality measurement equipment and implementing extensive data quality assurance measures.
- The dataset includes data from one full operational year in a 1-minute sampling rate, covering all seasons.
- Measured data channels include global, beam and diffuse irradiances in horizontal and collector plane. Heat transfer fluid properties were determined in a dedicated laboratory test.
- In addition to the measured data channels, calculated data channels, such as thermal power output, mass flow, fluid properties, solar incidence angle and shadowing masks are provided to facilitate further analysis.
- Uncertainties of data channels are provided based on data sheet specifications and GUM error propagation.
- The dataset refers to a real-scale application which is representative of typical large-scale solar thermal plant designs (flat plate collectors, common hydraulic layout).
- Additional information is provided in a "Data in Brief" journal article: https://doi.org/10.1016/j.dib.2023.109224
Collector array description: The data is from a flat plate collector array with a total gross collector area of 516 m2 (361 kW nominal thermal power). The array consists of four parallel collector rows with a common inlet and outlet manifold. Large-area flat-plate collectors from Arcon-Sunmark A/S are used in the plant. Collectors are all oriented towards the south (180°), have a tilt angle of 30° and a row spacing of 3.1 m. The collector array is part of a large-scale solar thermal plant located at Fernheizwerk Graz, Austria (latitude: 47.047294 N, longitude: 15.436366 E). The plant feeds into the local district heating network and is one of the largest Solar District Heating installations in Central Europe.
Data files:
- FHW_ArcS_main_2017.csv – This is the main dataset. It is advised to use this file for further analysis. The file contains the full time series of all measured and all calculated data channels and their (propagated) measurement uncertainty (53 data channels in total). Calculated data channels are derived from measured channels (see script make_data.py below) and have the suffix _calc in their channel names. Uncertainty information is given in terms of standard deviation of a normal distribution (suffix _std); some data channels are assumed to have no uncertainty (e.g., sun azimuth or shadowing).
- FHW_ArcS_main_2017.parquet – Same as FHW_ArcS_main_2017.csv, but in parquet file format for smaller file size and improved performance when loading the dataset in software.
- FHW_ArcS_parameters.json – Contains various metadata about the dataset, in both human and machine-readable format. Includes plant parameters, data channel descriptions, physical units, etc.
- FHW_ArcS_raw_2017.csv – Dataset with time series of all measured data channels and their measurement uncertainty. The main dataset FHW_ArcS_main_2017.csv, which includes all calculated data channels, is a superset of this file.
Scripts:
- make_data.py – This Python script exposes the calculation process of the calculated data channels (suffix _calc), including error propagation. The main calculations are defined as functions in the module utils_data.py.
- make_plots.py – This Python script, together with utils_plots.py, generates several figures based on the main dataset.
Data collection and preparation: AEE — Institute for Sustainable Technologies (AEE INTEC), Feldgasse 19, 8200 Gleisdorf, Austria; and SOLID Solar Energy Systems GmbH (SOLID), Am Pfangberg 117, 8045 Graz, Austria
Data owner: solar.nahwaerme.at Energiecontracting GmbH, Puchstrasse 85, 8020 Graz, Austria
Additional information is provided in a journal article in "Data in Brief", titled "One year of high-precision operational data including measurement uncertainties from a large-scale solar thermal collector array with flat plate collectors in Graz, Austria".
Note: A Gitlab repository is associated with this dataset, intended as a companion to facilitate maintenance of the Python code that is provided along with the data. If you want to use or contribute to the code, please do so using the Gitlab project: https://gitlab.com/sunpeek/zenodo-fhw-arconsouth-dataset-2017
- d
Deer Flat National Wildlife Refuge: Invasive Plant Inventory and Early...
- datasets.ai
- catalog.data.gov
55, 57, 8Updated Jun 1, 2023+ more versionsShareFacebookTwitterEmailClick to copy linkLink copiedCiteDepartment of the Interior (2023). Deer Flat National Wildlife Refuge: Invasive Plant Inventory and Early Detection Prioritization Tool (IPIEDT) - Area, Species, Area-Species Link Tables, 2021 [Dataset]. https://datasets.ai/datasets/deer-flat-national-wildlife-refuge-invasive-plant-inventory-and-early-detection-prioritiza8, 57, 55Available download formatsDataset updatedJun 1, 2023Dataset authored and provided byDepartment of the InteriorDescriptionThe IPIEDT is an Access Database file. The user responds to questions in a “yes/no/unknown” format or chooses from a list of states or conditions that best describe the situation. Each descriptive response corresponds to a numerical value which is then used to calculate species and area scores and generate ranked lists. A higher species or area score correlates to a higher priority for inventory.
The workshop's resulting data tables are archived so that the results of the workshop are preserved if the master database receives changes based on new threats or areas. Each Invasive Plant Species and Area Prioritization Workshop will have an IPIEDT Access database and 2-3 stand-alone CSV outputs. Each table is offered as an open source CSV and the Access Database tool zipped and is also available for download.
- d
Europe B2B Company Dataset | 30M+ Records | Firmographic Data | API +...
- datarade.ai
.json, .csv, .sql+ more versionsShareFacebookTwitterEmailClick to copy linkLink copiedCiteForager.ai, Europe B2B Company Dataset | 30M+ Records | Firmographic Data | API + Bi-Weekly Updates [Dataset]. https://datarade.ai/data-products/eu-company-data-24m-verified-records-bi-weekly-updates-ac-forager-ai.json, .csv, .sqlAvailable download formatsDataset provided byForager.aiArea coveredJersey, Slovakia, Austria, Åland Islands, Hungary, Malta, Norway, Croatia, Greece, ItalyDescription🌍 Europe B2B Company Dataset | 30M+ Verified Records | Firmographics & API Access Power your sales, marketing, and investment strategies with the most comprehensive global B2B company data—verified, AI-driven, and updated bi-weekly.
The Forager.ai Global Company Dataset delivers 30M+ high-quality firmographic records, covering public and private companies worldwide. Leveraging AI-powered validation and bi-weekly updates, our dataset ensures accuracy, freshness, and depth—making it ideal for sales intelligence, market analysis, and CRM enrichment.
📊 Key Features & Coverage ✅ 30M+ Company Records – The largest, most reliable B2B firmographic dataset available. ✅ Bi-Weekly Updates – Stay ahead with refreshed data every two weeks. ✅ AI-Driven Accuracy – Sophisticated algorithms verify and enrich every record. ✅ Global Coverage – Companies across North America, Europe, APAC, and emerging markets.
📋 Core Data Fields: ✔ Company Name, LinkedIn URL, & Domain ✔ Industries ✔ Job postings, Revenue, Employee Size, Funding Status ✔ Location (HQ + Regional Offices) ✔ Tech Stack & Firmographic Signals ✔ LinkedIn Profile details
🎯 Top Use Cases 🔹 Sales & Lead Generation
Build targeted prospect lists using firmographics (size, industry, revenue).
Enhance lead scoring with technographic insights.
🔹 Market & Competitive Intelligence
Track company growth, expansions, and trends.
Benchmark competitors using real-time private company data.
🔹 Venture Capital & Private Equity
Discover investment opportunities with granular sector-level insights.
Monitor portfolio companies and industry shifts.
🔹 ABM & Marketing Automation
Enrich CRM data for hyper-targeted campaigns.
Power intent data and predictive analytics.
⚡ Delivery & Integration Choose the best method for your workflow:
REST API – Real-time access for developers.
Flat Files (CSV, JSON) – Delivered via S3, Wasabi, Snowflake.
Custom Solutions – Scalable enterprise integrations.
🔒 Data Quality & Compliance 95%+ Field Completeness – Minimize gaps in your analysis.
Ethically Sourced – Compliant with GDPR, CCPA, and global privacy laws.
Transparent Licensing – Clear usage terms for peace of mind.
🚀 Why Forager.ai? ✔ AI-Powered Accuracy – Better data, fewer false leads. ✔ Enterprise-Grade Freshness – Bi-weekly updates keep insights relevant. ✔ Flexible Access – API, bulk files, or custom database solutions. ✔ Dedicated Support – Onboarding and SLA-backed assistance.
Tags: B2B Company Data |LinkedIn Job Postings | Firmographics | Global Business Intelligence | Sales Leads | VC & PE Data | Technographics | CRM Enrichment | API Access | AI-Validated Data
FacebookTwitterSteam Dataset 2025: Multi-Modal Gaming Analytics
Multi-modal Steam dataset: 239K games, semantic search, SQL database, 1M reviews
Attribution 4.0 (CC BY 4.0)https://creativecommons.org/licenses/by/4.0/
License information was derived automatically
Steam Dataset 2025: Multi-Modal Gaming Analytics Platform
The first multi-modal Steam dataset with semantic search capabilities. 239,664 applications collected from official Steam Web APIs with PostgreSQL database architecture, vector embeddings for content discovery, and comprehensive review analytics.
Made by a lifelong gamer for the gamer in all of us. Enjoy!🎮
GitHub Repository https://github.com/vintagedon/steam-dataset-2025
https://www.googleapis.com/download/storage/v1/b/kaggle-user-content/o/inbox%2F28514182%2F4b7eb73ac0f2c3cc9f0d57f37321b38f%2FScreenshot%202025-10-18%20180450.png?generation=1760825194507387&alt=media" alt="">
1024-dimensional game embeddings projected to 2D via UMAP reveal natural genre clustering in semantic space
What Makes This Different
Unlike traditional flat-file Steam datasets, this is built as an analytically-native database optimized for advanced data science workflows:
☑️ Semantic Search Ready - 1024-dimensional BGE-M3 embeddings enable content-based game discovery beyond keyword matching
☑️ Multi-Modal Architecture - PostgreSQL + JSONB + pgvector in unified database structure
☑️ Production Scale - 239K applications vs typical 6K-27K in existing datasets
☑️ Complete Review Corpus - 1,048,148 user reviews with sentiment and metadata
☑️ 28-Year Coverage - Platform evolution from 1997-2025
☑️ Publisher Networks - Developer and publisher relationship data for graph analysis
☑️ Complete Methodology & Infrastructure - Full work logs document every technical decision and challenge encountered, while my API collection scripts, database schemas, and processing pipelines enable you to update the dataset, fork it for customized analysis, learn from real-world data engineering workflows, or critique and improve the methodology
https://www.googleapis.com/download/storage/v1/b/kaggle-user-content/o/inbox%2F28514182%2F649e9f7f46c6ce213101d0948c89e8ac%2F4_price_distribution_by_top_10_genres.png?generation=1760824835918620&alt=media" alt="">
Market segmentation and pricing strategy analysis across top 10 genres
What's Included
Core Data (CSV Exports): - 239,664 Steam applications with complete metadata - 1,048,148 user reviews with scores and statistics - 13 normalized relational tables for pandas/SQL workflows - Genre classifications, pricing history, platform support - Hardware requirements (min/recommended specs) - Developer and publisher portfolios
Advanced Features (PostgreSQL): - Full database dump with optimized indexes - JSONB storage preserving complete API responses - Materialized columns for sub-second query performance - Vector embeddings table (pgvector-ready)
Documentation: - Complete data dictionary with field specifications - Database schema documentation - Collection methodology and validation reports
Example Analysis: Published Notebooks (v1.0)
Three comprehensive analysis notebooks demonstrate dataset capabilities. All notebooks render directly on GitHub with full visualizations and output:
📊 Platform Evolution & Market Landscape
View on GitHub | PDF Export
28 years of Steam's growth, genre evolution, and pricing strategies.
🔍 Semantic Game Discovery
View on GitHub | PDF Export
Content-based recommendations using vector embeddings across genre boundaries.
🎯 The Semantic Fingerprint
View on GitHub | PDF Export
Genre prediction from game descriptions - demonstrates text analysis capabilities.
Notebooks render with full output on GitHub. Kaggle-native versions planned for v1.1 release. CSV data exports included in dataset for immediate analysis.
https://www.googleapis.com/download/storage/v1/b/kaggle-user-content/o/inbox%2F28514182%2F4079e43559d0068af00a48e2c31f0f1d%2FScreenshot%202025-10-18%20180214.png?generation=1760824950649726&alt=media" alt="">
*Steam platfor...