Political Advertising on Google
- console.cloud.google.com
Updated May 29, 2019+ more versions Share
Share Facebook
 Twitter
 EmailClick to copy linkLink copiedCitehttps://console.cloud.google.com/marketplace/browse?filter=partner:Transparency%20Report (2019). Political Advertising on Google [Dataset]. https://console.cloud.google.com/marketplace/details/transparency-report/google-political-adsDataset updatedMay 29, 2019Description
This dataset contains information on how much money is spent by verified advertisers on political advertising across Google Ad Services. In addition, insights on demographic targeting used in political ad campaigns by these advertisers are also provided. Finally, links to the actual political ad in the Google Transparency Report are provided. Data for an election expires 7 years after the election. After this point, the data are removed from the dataset and are no longer available. This public dataset is hosted in Google BigQuery and is included in BigQuery's 1TB/mo of free tier processing. This means that each user receives 1TB of free BigQuery processing every month, which can be used to run queries on this public dataset. Watch this short video to learn how to get started quickly using BigQuery to access public datasets. What is BigQuery .
👕 Google Merchandise Sales Data
- kaggle.com
zipUpdated Oct 16, 2024ShareFacebookTwitterEmailClick to copy linkLink copiedCitemexwell (2024). 👕 Google Merchandise Sales Data [Dataset]. https://www.kaggle.com/datasets/mexwell/google-merchandise-sales-data/codezip(4813616 bytes)Available download formatsDataset updatedOct 16, 2024AuthorsmexwellDescriptionThis dataset provides a curated subset of the anonymized Google Analytics event data for three months of the Google Merchandise Store. The full dataset is available as a BigQuery Public Dataset.
The data includes information on items sold in the store and how much money was spent by users over time. It is both comprehensive enough to invite real analysis yet simple enough to facilitate teaching.
Acknowledgement
Foto von Arthur Osipyan auf Unsplash
- T
United States Money Supply M2
- tradingeconomics.com
- pl.tradingeconomics.com
- +13more
csv, excel, json, xmlUpdated Oct 16, 2025ShareFacebookTwitterEmailClick to copy linkLink copiedCiteTRADING ECONOMICS (2025). United States Money Supply M2 [Dataset]. https://tradingeconomics.com/united-states/money-supply-m2json, xml, csv, excelAvailable download formatsDataset updatedOct 16, 2025Dataset authored and provided byTRADING ECONOMICSLicenseAttribution 4.0 (CC BY 4.0)https://creativecommons.org/licenses/by/4.0/
License information was derived automaticallyTime period coveredJan 31, 1959 - Oct 31, 2025Area coveredUnited StatesDescriptionMoney Supply M2 in the United States increased to 22298.10 USD Billion in October from 22212.50 USD Billion in September of 2025. This dataset provides - United States Money Supply M2 - actual values, historical data, forecast, chart, statistics, economic calendar and news.
Bitcoin Cash Cryptocurrency Dataset
- console.cloud.google.com
Updated Apr 23, 2023ShareFacebookTwitterEmailClick to copy linkLink copiedCitehttps://console.cloud.google.com/marketplace/browse?filter=partner:Bitcoin%20Cash&hl=es (2023). Bitcoin Cash Cryptocurrency Dataset [Dataset]. https://console.cloud.google.com/marketplace/product/bitcoin-cash/crypto-bitcoin-cash?hl=esDataset updatedApr 23, 2023DescriptionBitcoin Cash is a cryptocurrency that allows more bytes to be included in each block relative to it’s common ancestor Bitcoin. This dataset contains the blockchain data in their entirety, pre-processed to be human-friendly and to support common use cases such as auditing, investigating, and researching the economic and financial properties of the system. This dataset is part of a larger effort to make cryptocurrency data available in BigQuery through the Google Cloud Public Datasets program . The program is hosting several cryptocurrency datasets, with plans to both expand offerings to include additional cryptocurrencies and reduce the latency of updates. You can find these datasets by searching "cryptocurrency" in GCP Marketplace. For analytics interoperability, we designed a unified schema that allows all Bitcoin-like datasets to share queries. Interested in learning more about how the data from these blockchains were brought into BigQuery? Looking for more ways to analyze the data? Check out the Google Cloud Big Data blog post and try the sample queries below to get started. This public dataset is hosted in Google BigQuery and is included in BigQuery's 1TB/mo of free tier processing. This means that each user receives 1TB of free BigQuery processing every month, which can be used to run queries on this public dataset. Watch this short video to learn how to get started quickly using BigQuery to access public datasets. What is BigQuery .
Google Ad Costs
- kaggle.com
zipUpdated Aug 27, 2020ShareFacebookTwitterEmailClick to copy linkLink copiedCiteBrenda N (2020). Google Ad Costs [Dataset]. https://www.kaggle.com/brendan45774/how-much-it-cost-to-get-an-ad-on-googlezip(1660 bytes)Available download formatsDataset updatedAug 27, 2020AuthorsBrenda NLicensehttps://creativecommons.org/publicdomain/zero/1.0/https://creativecommons.org/publicdomain/zero/1.0/
DescriptionOverview
Google is ranked in the top 10 with over 73,407 backlinks and a domain score of 94. Google search volume has 83,100,100 a month. So how much money does it take to have an ad of your website?
Content
https://www.googleapis.com/download/storage/v1/b/kaggle-user-content/o/inbox%2F2681031%2Fb4d4d101d4c7a560aed2d962a1c1f6de%2Fvolume.PNG?generation=1598539665064163&alt=media" alt="">
Acknowledgements
Thanks for ubersuggest for helping me prove the information for the dataset.
Inspiration
A lot of people have websites that they want to showcase, but at what cost. This also helps people with their DataFrame and csv file skills. Also help people who want to have an Google ad.
- m
Alphabet Inc Class A - Free-Cash-Flow-To-Equity
- macro-rankings.com
csv, excelUpdated Aug 11, 2025+ more versionsShareFacebookTwitterEmailClick to copy linkLink copiedCitemacro-rankings (2025). Alphabet Inc Class A - Free-Cash-Flow-To-Equity [Dataset]. https://www.macro-rankings.com/markets/stocks/googl-nasdaq/cashflow-statement/free-cash-flow-to-equityexcel, csvAvailable download formatsDataset updatedAug 11, 2025Dataset authored and provided bymacro-rankingsLicenseAttribution 4.0 (CC BY 4.0)https://creativecommons.org/licenses/by/4.0/
License information was derived automaticallyArea coveredunited statesDescriptionFree-Cash-Flow-To-Equity Time Series for Alphabet Inc Class A. Alphabet Inc. offers various products and platforms in the United States, Europe, the Middle East, Africa, the Asia-Pacific, Canada, and Latin America. It operates through Google Services, Google Cloud, and Other Bets segments. The Google Services segment provides products and services, including ads, Android, Chrome, devices, Gmail, Google Drive, Google Maps, Google Photos, Google Play, Search, and YouTube. It is also involved in the sale of apps and in-app purchases and digital content in the Google Play and YouTube; and devices, as well as in the provision of YouTube consumer subscription services. The Google Cloud segment offers AI infrastructure, Vertex AI platform, cybersecurity, data and analytics, and other services; Google Workspace that include cloud-based communication and collaboration tools for enterprises, such as Calendar, Gmail, Docs, Drive, and Meet; and other services for enterprise customers. The Other Bets segment sells healthcare-related and internet services. The company was incorporated in 1998 and is headquartered in Mountain View, California.
- m
Salesforce.com Inc - Cash-and-Equivalents
- macro-rankings.com
csv, excelUpdated Oct 3, 2025ShareFacebookTwitterEmailClick to copy linkLink copiedCitemacro-rankings (2025). Salesforce.com Inc - Cash-and-Equivalents [Dataset]. https://www.macro-rankings.com/Markets/Stocks/CRM-NYSE/Cash-and-Equivalentsexcel, csvAvailable download formatsDataset updatedOct 3, 2025Dataset authored and provided bymacro-rankingsLicenseAttribution 4.0 (CC BY 4.0)https://creativecommons.org/licenses/by/4.0/
License information was derived automaticallyArea coveredunited statesDescriptionCash-and-Equivalents Time Series for Salesforce.com Inc. Salesforce, Inc. provides customer relationship management (CRM) technology that connects companies and customers together worldwide. The company offers Agentforce, an agentic layer of the salesforce platform; Data Cloud, a data engine; Industries AI for creating industry-specific AI agents with Agentforce ; Salesforce Starter, a suite of solution for small and medium-size business; Slack, a workplace communication and productivity platform; Tableau, an end-to-end analytics solution for range of enterprise use cases and intelligent analytics with AI models, spot trends, predict outcomes, timely recommendations, and take action from any device; and integration and analytics solutions, as well as Agentforce Command Center, an observability solution to manage, track, and scale AI agent activity. It also provides marketing platform; commerce services, which empowers shopping experience across various customer touchpoint; and field service solution that enables companies to connect service agents, dispatchers, and mobile employees through one centralized platform to schedule and dispatch work, as well as track and manage jobs. The company has a strategic partnership with Google to integrate Agentforce 360 with Google Workspace for sales and IT service, which expands the Salesforce Gemini integration. Salesforce, Inc. was incorporated in 1999 and is headquartered in San Francisco, California.
- m
Salesforce.com Inc - Free-Cash-Flow-To-The-Firm
- macro-rankings.com
csv, excelUpdated Mar 18, 2025ShareFacebookTwitterEmailClick to copy linkLink copiedCitemacro-rankings (2025). Salesforce.com Inc - Free-Cash-Flow-To-The-Firm [Dataset]. https://www.macro-rankings.com/Markets/Stocks?Entity=CRM.US&Item=Free-Cash-Flow-To-The-Firmcsv, excelAvailable download formatsDataset updatedMar 18, 2025Dataset authored and provided bymacro-rankingsLicenseAttribution 4.0 (CC BY 4.0)https://creativecommons.org/licenses/by/4.0/
License information was derived automaticallyArea coveredunited statesDescriptionFree-Cash-Flow-To-The-Firm Time Series for Salesforce.com Inc. Salesforce, Inc. provides customer relationship management (CRM) technology that connects companies and customers together worldwide. The company offers Agentforce, an agentic layer of the salesforce platform; Data Cloud, a data engine; Industries AI for creating industry-specific AI agents with Agentforce ; Salesforce Starter, a suite of solution for small and medium-size business; Slack, a workplace communication and productivity platform; Tableau, an end-to-end analytics solution for range of enterprise use cases and intelligent analytics with AI models, spot trends, predict outcomes, timely recommendations, and take action from any device; and integration and analytics solutions, as well as Agentforce Command Center, an observability solution to manage, track, and scale AI agent activity. It also provides marketing platform; commerce services, which empowers shopping experience across various customer touchpoint; and field service solution that enables companies to connect service agents, dispatchers, and mobile employees through one centralized platform to schedule and dispatch work, as well as track and manage jobs. The company has a strategic partnership with Google to integrate Agentforce 360 with Google Workspace for sales and IT service, which expands the Salesforce Gemini integration. Salesforce, Inc. was incorporated in 1999 and is headquartered in San Francisco, California.
Google energy consumption 2011-2023
- statista.com
ShareFacebookTwitterEmailClick to copy linkLink copiedCiteStatista, Google energy consumption 2011-2023 [Dataset]. https://www.statista.com/statistics/788540/energy-consumption-of-google/Area coveredWorldwideDescriptionGoogle’s energy consumption has increased over the last few years, reaching 25.9 terawatt hours in 2023, up from 12.8 terawatt hours in 2019. The company has made efforts to make its data centers more efficient through customized high-performance servers, using smart temperature and lighting, advanced cooling techniques, and machine learning. Datacenters and energy Through its operations, Google pursues a more sustainable impact on the environment by creating efficient data centers that use less energy than the average, transitioning towards renewable energy, creating sustainable workplaces, and providing its users with the technological means towards a cleaner future for the future generations. Through its efficient data centers, Google has also managed to divert waste from its operations away from landfills. Reducing Google’s carbon footprint Google’s clean energy efforts is also related to their efforts to reduce their carbon footprint. Since their commitment to using 100 percent renewable energy, the company has met their targets largely through solar and wind energy power purchase agreements and buying renewable power from utilities. Google is one of the largest corporate purchasers of renewable energy in the world.
GOOGLE Reports & Stock Prices 2004-TODAY
- kaggle.com
zipUpdated Nov 21, 2025ShareFacebookTwitterEmailClick to copy linkLink copiedCiteEmre Kaan Yılmaz (2025). GOOGLE Reports & Stock Prices 2004-TODAY [Dataset]. https://www.kaggle.com/datasets/emrekaany/googl-stock-price-and-financialszip(117351 bytes)Available download formatsDataset updatedNov 21, 2025AuthorsEmre Kaan YılmazLicenseApache License, v2.0https://www.apache.org/licenses/LICENSE-2.0
License information was derived automaticallyDescription🇺🇸 Alphabet Inc. (GOOGL) Comprehensive Financial Dataset
📌 Overview
Welcome to the GOOGL Financial Dataset! This dataset provides clear and easy-to-use quarterly financial statements (income statement, balance sheet, and cash flow) along with daily historical stock prices.
As a data engineer double majored with economics, I'll personally analyze and provide constructive feedback on all your work using this dataset. Let's dive in and explore Google's financial journey together!
🗃 Files Included
- googl_daily_prices.csv: Historical daily stock prices.
- googl_income_statement.csv: Quarterly income statements.
- googl_balance_sheet.csv: Quarterly balance sheets.
- googl_cash_flow_statement.csv: Quarterly cash flow statements.
📘 About This Dataset
This dataset offers a unique blend of long-term market performance and detailed financial metrics:
- Time Series of Daily Prices: Track the historical performance of GOOGL stock from its early days up until now.
- Quarterly Financial Statements: Dive into the income statements, balance sheets, and cash flow statements that reflect the company’s financial evolution.
- Integrated Insights: Ideal for comprehensive financial analyses, forecasting, model building, and exploring the dynamic interplay between market performance and underlying business operations.
Whether you're building predictive models, performing deep-dive financial analysis, or exploring the evolution of one of the world's most innovative tech giants, this dataset is your go-to resource for clean, well-organized, and rich financial data.
💡 Tips for Using the Dataset
- Visualize Stock Trends: Plot daily prices to quickly understand stock movements.
- Financial Analysis: Compare income, balance sheet, and cash flow data to spot financial trends and health.
- Predictive Modeling: Use this dataset to build forecasting models and predict future performance.
- Combine Data: Merge price data with financial statements to analyze relationships and uncover deeper insights.
🔗 Works Great with My GOOGL News Dataset!
For a more comprehensive financial analysis, pair this dataset with my other Kaggle dataset:
👉 Google (Alphabet Inc.) Daily News — 2000 to 2025That dataset includes:
- Daily news articles from Finnhub
- Headlines, summaries, sources, and timestamps
- Covering GOOGL from 2000 to 2025
Combining both datasets unlocks powerful analysis such as:
- Correlating news sentiment with stock price movements
- Studying the impact of earnings reports and product launches
- Developing event-driven forecasting models
Together, they give you everything you need for news + financial signal modeling.
📝 Column Descriptions
📈 googl_daily_prices.csv
- date: Trading date.
- 1. open: Opening stock price on the trading day.
- 2. high: Highest stock price on the trading day.
- 3. low: Lowest stock price on the trading day.
- 4. close: Closing stock price on the trading day.
- 5. volume: Number of shares traded on the day.
📊 googl_income_statement.csv
- fiscalDateEnding: Date marking the end of fiscal quarter.
- reportedCurrency: Currency used in reporting (USD).
- grossProfit: Revenue minus the cost of goods sold.
- totalRevenue: Total income generated from operations.
- costOfRevenue: Direct costs attributable to the production of goods.
- costofGoodsAndServicesSold: Costs directly associated with goods sold.
- operatingIncome: Earnings after operating expenses deducted.
- sellingGeneralAndAdministrative: Administrative and general sales costs.
- researchAndDevelopment: Expenses related to research and innovation.
- operatingExpenses: Total operational costs.
- investmentIncomeNet: Net income from investments.
- netInterestIncome: Income earned from interest after deducting interest paid.
- interestIncome: Income generated from interest-bearing investments.
- interestExpense: Expenses from interest payments.
- nonInterestIncome: Income from non-interest-bearing activities.
- otherNonOperatingIncome: Additional income outside regular operations.
- depreciation: Reduction in value of assets over time.
- depreciationAndAmortization: Combined depreciation and amortization costs.
- incomeBeforeTax: Income before taxation.
- incomeTaxExpense: Taxes paid on earnings.
- interestAndDebtExpense: Interest paid on debts.
- netIncomeFromContinuingOperations: Profit from ongoing operations.
- comprehensiveIncomeNetOfTax: Income after comprehensive expenses.
- ebit: Earnings before interest and taxes.
- ebitda: Earnings before interest, taxes, depreciation, and...
Copper Prices - Spot Price Per Ounce & Pound, Historical Data, Chart Trends
- moneymetals.com
csv, jsonUpdated Feb 7, 2025ShareFacebookTwitterEmailClick to copy linkLink copiedCiteMoney Metals (2025). Copper Prices - Spot Price Per Ounce & Pound, Historical Data, Chart Trends [Dataset]. https://www.moneymetals.com/copper-pricesjson, csvAvailable download formatsDataset updatedFeb 7, 2025Dataset provided byMoney Metals ExchangeAuthorsMoney MetalsLicenseAttribution 4.0 (CC BY 4.0)https://creativecommons.org/licenses/by/4.0/
License information was derived automaticallyArea coveredGlobalVariables measuredCopper Price Per Ounce, Copper Price Per Pound, Copper Price Historical TrendDescriptionAbout This Dataset: Copper Prices and Market Trends
    This dataset provides **insights into copper prices**, including current rates, historical trends, and key factors affecting price fluctuations. Copper is essential in **construction**, **electronics**, and **transportation** industries. Investors, traders, and analysts use accurate copper price data to guide decisions related to **trading**, **futures**, and **commodity investments**.

    ### **Key Features of the Dataset**

    #### **Live Market Data and Updates**
    Stay updated with the latest **copper price per pound** in USD. This data is sourced from exchanges like the **London Metal Exchange (LME)** and **COMEX**. Price fluctuations result from **global supply-demand shifts**, currency changes, and geopolitical factors.

    #### **Interactive Copper Price Charts**
    Explore **dynamic charts** showcasing real-time and historical price movements. These compare copper with **gold**, **silver**, and **aluminium**, offering insights into **market trends** and inter-metal correlations.

    ### **Factors Driving Copper Prices**

    #### **1. Supply and Demand Dynamics**
    Global copper supply is driven by mining activities in regions like **Peru**, **China**, and the **United States**. Disruptions in production or policy changes can cause **supply shocks**. On the demand side, **industrial growth** in countries like **India** and **China** sustains demand for copper.

    #### **2. Economic and Industry Trends**
    Copper prices often reflect **economic trends**. The push for **renewable energy** and **electric vehicles** has boosted long-term demand. Conversely, economic downturns and **inflation** can reduce demand, lowering prices.

    #### **3. Impact of Currency and Trade Policies**
    As a globally traded commodity, copper prices are influenced by **currency fluctuations** and **tariff policies**. A strong **US dollar** typically suppresses copper prices by increasing costs for international buyers. Trade tensions can also disrupt **commodity markets**.

    ### **Applications and Benefits**

    This dataset supports **commodity investors**, **traders**, and **industry professionals**:

    - **Investors** forecast price trends and manage **investment risks**.
    - **Analysts** perform **market research** using price data to assess **copper futures**.
    - **Manufacturers** optimize supply chains and **cost forecasts**.

    Explore more about copper investments on **Money Metals**:

    - [**Buy Copper Products**](https://www.moneymetals.com/buy/copper)
    - [**95% Copper Pennies (Pre-1983)**](https://www.moneymetals.com/pre-1983-95-percent-copper-pennies/4)
    - [**Copper Buffalo Rounds**](https://www.moneymetals.com/copper-buffalo-round-1-avdp-oz-999-pure-copper/297)

    ### **Copper Price Comparisons with Other Metals**

    Copper prices often correlate with those of **industrial** and **precious metals**:

    - **Gold** and **silver** are sensitive to **inflation** and currency shifts.
    - **Iron ore** and **aluminium** reflect changes in **global demand** within construction and manufacturing sectors.

    These correlations help traders develop **hedging strategies** and **investment models**.

    ### **Data Variables and Availability**

    Key metrics include:

    - **Copper Price Per Pound:** The current market price in USD.
    - **Copper Futures Price:** Data from **COMEX** futures contracts.
    - **Historical Price Trends:** Long-term movements, updated regularly.

    Data is available in **CSV** and **JSON** formats, enabling integration with analytical tools and platforms.

    ### **Conclusion**

    Copper price data is crucial for **monitoring global commodity markets**. From **mining** to **investment strategies**, copper impacts industries worldwide. Reliable data supports **risk management**, **planning**, and **economic forecasting**.

    For more tools and data, visit the **Money Metals** [Copper Prices Page](https://www.moneymetals.com/copper-prices).
Count Coins Image dataset
- kaggle.com
zipUpdated Oct 10, 2022ShareFacebookTwitterEmailClick to copy linkLink copiedCiteBala Baskar (2022). Count Coins Image dataset [Dataset]. https://www.kaggle.com/datasets/balabaskar/count-coins-image-datasetzip(113047419 bytes)Available download formatsDataset updatedOct 10, 2022AuthorsBala BaskarLicensehttps://creativecommons.org/publicdomain/zero/1.0/https://creativecommons.org/publicdomain/zero/1.0/
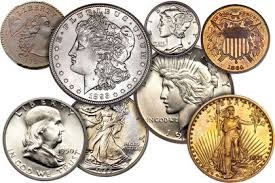
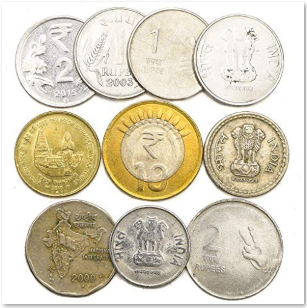
DescriptionIntroduction
A coin is a small, flat, (usually, depending on the country or value) round piece of metal or plastic used primarily as a medium of exchange or legal tender. They are standardized in weight, and produced in large quantities at a mint in order to facilitate trade. They are most often issued by a government. Coins often have images, numerals, or text on them. Obverse and its opposite, reverse, refer to the two flat faces of coins and medals. In this usage, obverse means the front face of the object and reverse means the back face. The obverse of a coin is commonly called heads because it often depicts the head of a prominent person, and the reverse tails. Coins are usually made of metal or an alloy, or sometimes of man-made materials. They are usually disc shaped. Coins made of valuable metal are stored in large quantities as bullion coins. Reference - Coins
Content
This dataset contains the coin images of various currencies, as listed below:
- US coins
- Chinese coins
- Yen coins
- Euro coins
- Indian Rupee coins
- Peso coins
The coin images are collected by scraped from Google Image searches and filtered, based on the coin image quality. Finally, the number of coins in the images are manually counted, to generate the ground truth.
The
coins_count_values.csvfile contains the ground truthChallenges
This dataset can be a good challenge for Kagglers, who are new to Image preprocessing, and also helpful for those who want to practice image preprocessing techniques.
- All coins are not round shaped
- Background of the coins is not the same
- Color of the coins is not the same
- Most of the coins present in the image collections are filtered based on the position of coins (horizontal flat) for ease of detection, but some coins images are added to challenge your preprocessing algorithm as shown below:
Hope you will find the dataset useful for practicing image processing/ computer vision skills.
Have fun and Happy Learning!
Most valuable media & entertainment brands worldwide 2024
- statista.com
- de.statista.com
ShareFacebookTwitterEmailClick to copy linkLink copiedCiteJulia Faria, Most valuable media & entertainment brands worldwide 2024 [Dataset]. https://www.statista.com/topics/1164/social-networks/AuthorsJulia FariaDescriptionIn 2024, Google ranked as the most valuable media and entertainment brand worldwide, with a brand value of 683 billion U.S. dollars. Facebook ranked second, valued at around 167 billion dollars. Part of the Tencent Group, WeChat and v.qq.com (Tencent Video) had a brand value of 56 billion and 17.5 billion dollars, respectively.
🇵🇭 PH FinTech Apps Google Store Reviews (2023)
- kaggle.com
zipUpdated Nov 9, 2023ShareFacebookTwitterEmailClick to copy linkLink copiedCiteBwandoWando (2023). 🇵🇭 PH FinTech Apps Google Store Reviews (2023) [Dataset]. https://www.kaggle.com/datasets/bwandowando/bpi-google-store-app-reviewszip(58039739 bytes)Available download formatsDataset updatedNov 9, 2023AuthorsBwandoWandoLicenseAttribution-NonCommercial-ShareAlike 4.0 (CC BY-NC-SA 4.0)https://creativecommons.org/licenses/by-nc-sa/4.0/
License information was derived automaticallyDescription⚠️ Important Update ⚠️
I created an updated version using GoogleScraper which can be found here 🇵🇭 PH FinTech Apps Google Store Reviews (2024+). THIS dataset was created using RAPIDAPI](https://rapidapi.com/letscrape-6bRBa3QguO5/api/store-apps)
https://www.googleapis.com/download/storage/v1/b/kaggle-user-content/o/inbox%2F1842206%2F33286333aa1716e666a361caac1a5501%2FMegapack2.png?generation=1699274846304598&alt=media" alt="">
App Reviews
- ph.com.tala- 299783 records
- com.paymaya- 177175 records
- ph.homecredit.myhomecredit- 74624 records
- com.tmart.pesoq- 60441 records
- ph.billeasev2.mobile- 41512 records
- www.mobile.bdo.com.ph- 37243 records
- ph.moneycat- 33887 records
- com.fronde.mbanking.android.pckg.bpi- 29393 records
- ph.onlineloans.mobile.android- 28248 records
- tech.codeblock.okpeso- 28163 records
- com.unionbankph.online- 27482 records
- com.mocamoca- 26735 records
- com.juanhand.fast.cash.peso.loan.app- 23381 records
- com.pesoloan- 23296 records
- com.tonik.mobile- 19681 records
- com.abs.pesobuffet.android- 16125 records
- com.landbank.mobilebanking- 15577 records
- prima.Loan.peso.cash.lending- 14741 records
- com.bpi.ng.app- 13700 records
- com.cimbph.app2022- 12361 records
- ph.loans.mobile- 10711 records
- ph.lhl.pautangpeso- 10305 records
- com.luck.duck.quickla- 9816 records
- com.palawanpay.ewallet- 8623 records
- com.citibank.CitibankPH- 8169 records
- u.money.spend- 7411 records
- ph.com.bdo.retail- 6686 records
- com.loans.lending.onlinelend.mabiliscash- 6156 records
- com.securitybank.online- 6146 records
- ph.com.metrobank.mcc.mbonline- 5121 records
- com.rcbc.mobilebanking- 5004 records
- com.wow.pera- 4837 records
- com.peramoo- 4544 records
- com.valley.loan- 3561 records
- com.liang.chan- 2640 records
- hb.xinxinxr.vip- 2255 records
- ph.com.gotyme- 2245 records
- com.plentina.app- 2037 records
- ph.seabank.seabank- 1819 records
- [ph.komo.app](https://play.google.com/store/apps/details?id=ph.ko...
IFND dataset
- kaggle.com
zipUpdated Feb 12, 2022ShareFacebookTwitterEmailClick to copy linkLink copiedCiteSonal Garg (2022). IFND dataset [Dataset]. https://www.kaggle.com/sonalgarg174/ifnd-datasetzip(3029050 bytes)Available download formatsDataset updatedFeb 12, 2022AuthorsSonal GargDescription*** We will never ask for money to share the datasets. If someone claims that s/he has all the raw data and wants a payment, please be careful. ***
About Data
This IFND dataset covers news pertaining to India only. This dataset is created by scraping Indian fact checking websites. The dataset contains two types of news fake and real News. This dataset was collected from real-world sources.TThe truthful news and fake news were collected from different reliable fact-checking websites. The dataset contains different types of articles on different topics, however, the majority of news focus on political news.
The above CSV files is comma-separated file and have the following columns:
*id- Unique identifider for each news
*Statement- Title of the news article
*Image- Image Url
*Category-Topic of news
*Date- Date of news
*Label- 1 indicate True news and 0 indicate fake news
The image folder is divided into True and fake images. Images can be accessed using this link- https://drive.google.com/drive/u/3/folders/1K4NacXO8_9ZLxWBpyoKL0fLXr0uRsa2W
Note that there are absolutely no guarantees with this data, and we provide this dataset "as is", but you are welcome to report the issues of the preliminary version of this data.
You are allowed to use this dataset for research purposes only.
For more questions about the dataset, please contact: Sonal Garg, sonugarg174@gmail.com
References
If you use this dataset, as an agreement, please cite the following papers:
Sharma, D. K., & Garg, S. (2021). IFND: a benchmark dataset for fake news detection. Complex & Intelligent Systems, 1-21.
Garg, S., & Sharma, D. K. (2020, December). New Politifact: A Dataset for Counterfeit News. In 2020 9th International Conference System Modeling and Advancement in Research Trends (SMART) (pp. 17-22). IEEE.
Garg, S., & Sharma, D. K. (2020, December). Phony News Detection using Machine Learning and Deep-Learning Techniques. In 2020 9th International Conference System Modeling and Advancement in Research Trends (SMART) (pp. 27-32). IEEE.
Sharma, D. K., & Garg, S. (2021, July). Machine Learning Methods to identify Hindi Fake News within social-media. In 2021 12th International Conference on Computing Communication and Networking Technologies (ICCCNT) (pp. 1-6). IEEE.
Sharma, Sunidhi, and Dilip Kumar Sharma. "Fake News Detection: A long way to go." 2019 4th International Conference on Information Systems and Computer Networks (ISCON). IEEE, 2019.
Sharma, D.K., and Garg, S.”, A Framework for automatic fake content identification”, In IEEE Sponsored 1st International Conference” Simulation, Automation& Smart Manufacturing”, SASM 2021, held at GLA University, India.
Data from: Marketing Campaign dataset
- kaggle.com
zipUpdated Jun 28, 2023ShareFacebookTwitterEmailClick to copy linkLink copiedCiteRahul Chavan (2023). Marketing Campaign dataset [Dataset]. https://www.kaggle.com/rahulchavan99/marketing-campaign-datasetzip(1909821 bytes)Available download formatsDataset updatedJun 28, 2023AuthorsRahul ChavanDescriptionData Definition
campaign_item_id : unique id of each adevertising campaign no_of_days : number of days campaign has been running time : timestamp on which the data was captured ext_service_id : id of each advertising platforms used ext_service_name : name of each advertising platforms used creative_id : id of the creative images used for ads creative_height : height of the creative image for the ad in pixels creative_width : width of the creative image for the ad in pixels search_tags : search tags used for displaying ads template_id : template used in the creative image landing_page : landing page url on which users clicked or browsed through advertiser_id : id of the advertiser advertiser_name : name of the place of the advertiser ( city , country , state ) network_id : id of the each agency advertiser_currency : currency of the country in which the advertiser operates in channel_id : id of each channel used for placed ads channel_name : name of the channel ( display , search , social , mobile video ) max_bid_cpm : maximum value of bid for optimizing cpm campaign_budget_usd : overall budget of the campaign or the amount of money that the campaign can spend impressions : the number of times an advertisement is displayed on a website or social media platform. clicks : the number of times an advertisement is clicked on by a user, leading them to the advertiser's website or landing page. currency_code : the currency code of the advertiser exchange_rate : a relative price of one currency expressed in terms of another currency. media_cost_usd : the amount of money that the campaign has spent on that particuar day position_in_content : position where the ad was placed on the website page unique_reach : the number of unique users who see your post or page. total_reach : the number of people who saw any content from your page or about your page. search_tags : a word or set of words a person enters when searching on Google or one of our Search Network sites. cmi_currency_code : campaign currency code time_zone : timezone in which the campaign is running weekday_cat : weekday / weekend catgeory keywords : a word or set of words that Google Ads advertisers can add to a given ad group so that your ads are targeting the right audience.
Data from: Stock Market Indicators
- kaggle.com
zipUpdated Jan 31, 2020ShareFacebookTwitterEmailClick to copy linkLink copiedCiteAlex Wilf (2020). Stock Market Indicators [Dataset]. https://www.kaggle.com/abwilf/stock-market-indicatorszip(23262 bytes)Available download formatsDataset updatedJan 31, 2020AuthorsAlex WilfDescriptionQuickstart
Context
Predicting the stock market is a game as old as the stock market itself. On popular ML platforms like Kaggle, users often compete to come up with highly nuanced, optimized models to solve the stock market starting just from price data. LSTMs may end up being the most effective model, but the real problem isn't the model - it's the data.
Human and algorithmic traders in the financial industry know this, and augment their datasets with lots of useful information about stocks called "technical indicators". These indicators have fancy sounding names - e.g. the "Aroon Oscillator" and the "Chaikin Money Flow Index", but most boil down to simple calculations involving moving averages and volatility. Access to these indicators is unrestricted for humans (you can view them on most trading platforms), but access to well formatted indicators (csvs instead of visual lines) for large datasets reaching back significantly in time is nearly impossible to find. Even if you pay for a service, API usage limits make putting together such a dataset prohibitively expensive.
The fact that this information is largely kept behind paywalls for large firms with proprietary resources makes me question the fairness of this market. With a data imbalance like this, how can a single trader - a daytrader - expect to make money? I wanted to make this data available to the ML community because it is my hope that bringing this data to the community will help to even the scales. Whether you're just looking to toy around and make a few bucks, or interested in contributing to something larger - a group of people working to develop algorithms to help the "little guy" trade - I hope this dataset will be helpful. To the best of my knowledge, this is the first dataset of its kind, but I hope it is not the last.
Data
I'd recommend starting here: https://colab.research.google.com/drive/1W6TprjcxOdXsNwswkpm_XX2U_xld9_zZ#offline=true&sandboxMode=true In this notebook, I've uploaded the indicators data and made it available for read access. The notebook will walk you through processing the data and putting it to work building advanced ML models.
If you'd like to download it directly, you can do so here (31GB): https://drive.google.com/file/d/1HVKWtLWlIZj5yY4T3R1CDSn3c_Nh1lB5/view?usp=sharing
For legal reasons, I use borismarjanovic's dataset as a baseline, which ends in 2017. If you'd like to update your prices and indicators so your model can trade day to day, I've included instructions and code in the quickstart that should be helpful.
Acknowledgements
- The many online tutorials and specifications which helped me write and test the indicator functions
- borismarjanovic for making public an amazing dataset that I use as a baseline for the colab notebook and the direct download file above
- The many online services that have allowed me to download all the recent price information to augment Boris' dataset (which legally I cannot share, but which helped me develop the infrastructure to update the indicators given new prices data that I share in the quickstart and repo).
Next Steps / Future Directions
- Building inventive models using this dataset to more and more accurately predict stock price movements
- Incorporating arbitrage analysis across stocks
- Hedging
- Options and selling short
- Commodities, currencies, ETFs
Collaboration
If this interests you, reach out! My email is abwilf [at] umich [dot] edu. The repository I used to generate the dataset is here: https://github.com/abwilf/daytrader. I love forks. If you want to work on the project, send me a pull request!
CTR In Advertisement
- kaggle.com
zipUpdated Dec 31, 2020ShareFacebookTwitterEmailClick to copy linkLink copiedCiteMöbius (2020). CTR In Advertisement [Dataset]. https://www.kaggle.com/datasets/arashnic/ctr-in-advertisementzip(7487100 bytes)Available download formatsDataset updatedDec 31, 2020AuthorsMöbiusLicensehttps://creativecommons.org/publicdomain/zero/1.0/https://creativecommons.org/publicdomain/zero/1.0/
DescriptionContext
A company wants to know the CTR ( Click Through Rate ) in order to identify whether spending their money on digital advertising is worth or not. A higher CTR represents more interest in that specific campaign, whereas a lower CTR can show that the ad may not be as relevant. High CTRs are important because they show that more people are clicking through the website. Along with this high CTRs also help to get better ad position for less money on online platforms like Google, Bing etc.
Content
The dataset divided to train (463291, 15) and test (128858, 14). Features are clear and target is "is_click" , 0 (No) , 1(Yes).
Kerner(s)
Inspiration
- EDA and customer analytics
- Prediction of the ad click rate of a customer
NSE - Nifty 50 Index Minute data (2015 to 2025)
- kaggle.com
zipUpdated Aug 6, 2025ShareFacebookTwitterEmailClick to copy linkLink copiedCiteDeba (2025). NSE - Nifty 50 Index Minute data (2015 to 2025) [Dataset]. https://www.kaggle.com/datasets/debashis74017/nifty-50-minute-datazip(184768242 bytes)Available download formatsDataset updatedAug 6, 2025AuthorsDebaLicensehttps://creativecommons.org/publicdomain/zero/1.0/https://creativecommons.org/publicdomain/zero/1.0/
DescriptionUPDATED EVERY WEEK Last Update - 26th July 2025
Disclaimer!!! Data uploaded here are collected from the internet and some google drive. The sole purposes of uploading these data are to provide this Kaggle community with a good source of data for analysis and research. I don't own these datasets and am also not responsible for them legally by any means. I am not charging anything (either money or any favor) for this dataset. RESEARCH PURPOSE ONLY
Context
- The NIFTY 50 is a well-diversified 50 stock index and it represents 13 important sectors of the economy.
- It is used for a variety of purposes such as benchmarking fund portfolios, index-based derivatives, and index funds.
- NIFTY 50 is owned and managed by NSE Indices Limited.
- The NIFTY 50 index has shaped up to be the largest single financial product in India.
This data contains all the indices of NSE.
NIFTY 50,
NIFTY BANK,
NIFTY 100,
NIFTY COMMODITIES,
NIFTY CONSUMPTION,
NIFTY FIN SERVICE,
NIFTY IT,
NIFTY INFRA,
NIFTY ENERGY,
NIFTY FMCG,
NIFTY AUTO,
NIFTY 200,
NIFTY ALPHA 50,
NIFTY 500,
NIFTY CPSE,
NIFTY GS COMPSITE,
NIFTY HEALTHCARE,
NIFTY CONSR DURBL,
NIFTY LARGEMID250,
NIFTY INDIA MFG,
NIFTY IND DIGITAL,
INDIA VIX
File Information and Column Descriptions.
Nifty 50 index data with 1 minute data. The dataset contains OHLC (Open, High, Low, and Close) prices from Jan 2015 to Aug 2024. - This dataset can be used for time series analysis, regression problems, and time series forecasting both for one step and multi-step ahead in the future. - Options data can be integrated with this minute data, to get more insight about this data. - Different backtesting strategies can be built on this data.
File Information
- This dataset contains 6 files, each file contains nifty 50 data with different intervals.
- Different intervals are - 1 min, 3 min, 5 min, 15 min, and 1 hour, Daily data from intervals of 2015 Jan to 2024 August.
Column Descriptors
- Each file contains OHLC (Open, High, Low, and Close) prices and Data time information. Since these are Nifty 50 index data, so volume is not present.
Inspiration
Time series forecasting - Predict stock price
- Predict future stock price one step ahead and multi-step ahead in time.
- Use different time series forecasting techniques for forecasting the future stock price. ### Machine learning and Deep learning techniques
- Possible ML and DL models include Neural networks, RNNs, LSTMs, Transformers, Attention networks, etc.
- Different error functions can be considered like RMSE, MAE, RMSEP etc. ### Feature engineering
- Different augmented features can be created and that can be used for forecasting.
- Correlation analysis, Feature importance to justify the important features.
Bitcoin Cash Blockchain
- kaggle.com
zipUpdated Feb 14, 2019ShareFacebookTwitterEmailClick to copy linkLink copiedCiteGoogle BigQuery (2019). Bitcoin Cash Blockchain [Dataset]. https://www.kaggle.com/bigquery/crypto-bitcoin-cashzip(0 bytes)Available download formatsDataset updatedFeb 14, 2019AuthorsGoogle BigQueryLicensehttps://creativecommons.org/publicdomain/zero/1.0/https://creativecommons.org/publicdomain/zero/1.0/
DescriptionContext
Bitcoin Cash is a cryptocurrency. In mid-2017, a group of developers wanting to increase bitcoin's block size limit prepared a code change. The change, called a hard fork, took effect on 1 August 2017. As a result, the bitcoin ledger called the blockchain and the cryptocurrency split in two. At the time of the fork anyone owning bitcoin was also in possession of the same number of Bitcoin Cash units.
On 15 November 2018 Bitcoin Cash split into two cryptocurrencies.
Content
You can access the data from BigQuery in your notebook with
bigquery-public-data.crypto_bitcoin_cashdataset.Querying BigQuery tables
You can use the BigQuery Python client library to query tables in this dataset in Kernels. Note that methods available in Kernels are limited to querying data. Tables are at bigquery-public-data.crypto_bitcoin_cash.[TABLENAME].
Acknowledgements
This dataset wouldn't be possible without the help of BigQuery and all of their contributions to public data.
FacebookTwitterThis dataset contains information on how much money is spent by verified advertisers on political advertising across Google Ad Services. In addition, insights on demographic targeting used in political ad campaigns by these advertisers are also provided. Finally, links to the actual political ad in the Google Transparency Report are provided. Data for an election expires 7 years after the election. After this point, the data are removed from the dataset and are no longer available. This public dataset is hosted in Google BigQuery and is included in BigQuery's 1TB/mo of free tier processing. This means that each user receives 1TB of free BigQuery processing every month, which can be used to run queries on this public dataset. Watch this short video to learn how to get started quickly using BigQuery to access public datasets. What is BigQuery .