UK Parliamentary Constituency boundaries for the island of Ireland,...
- zenodo.org
- data-staging.niaid.nih.gov
binUpdated Oct 25, 2024 Share
Share Facebook
 Twitter
 EmailClick to copy linkLink copiedCiteCharlton Martin; Charlton Martin; Eoin McLaughlin; Eoin McLaughlin; Jack Kavanagh; Jack Kavanagh (2024). UK Parliamentary Constituency boundaries for the island of Ireland, 1885-1918 [Dataset]. http://doi.org/10.5281/zenodo.13993331binAvailable download formatsUnique identifierhttps://doi.org/10.5281/zenodo.13993331Dataset updatedOct 25, 2024AuthorsCharlton Martin; Charlton Martin; Eoin McLaughlin; Eoin McLaughlin; Jack Kavanagh; Jack KavanaghLicense
Attribution 4.0 (CC BY 4.0)https://creativecommons.org/licenses/by/4.0/
License information was derived automaticallyTime period covered2017Area coveredIreland, Ireland, United KingdomDescriptionThe 1885 UK parliamentary constituencies for Ireland were re-created in 2017 as part of a conference paper delivered at the Southern Irish Loyalism in Context conference at Maynooth University. The intial map only included the territory of the Irish Free State and was created by Martin Charlton and Jack Kavanagh. The remaining six counties of Ulster were completed by Eoin McLaughlin in 2018-19, the combined result is a GIS map of all the parliamentary constituecies across the island of Ireland for the period 1885-1918. The map is available in both ESRI Shapefile format and as a GeoPackage (GPKG). The methodology for creating the constituencies is outlined in detail below.
Methodology
A map showing the outlines of the 1855 – 1918 Constituency boundaries can be found on page 401 of Parliamentary Elections in Ireland, 1801-1922 (Dublin, 1978) by Brian Walker. This forms the basis for the creation of a set of digital boundaries which can then be used in a GIS. The general workflow involves allocating an 1885 Constituency identifier to each of the 309 Electoral Divisions present in the boundaries made available for the 2011 Census of Population data release by CSO. The ED boundaries are available in ‘shapefile’ format (a de facto standard for spatial data transfer). Once a Constituency identifier has been given to each ED, the GIS operation known as ‘dissolve’ is used to remove the boundaries between EDs in the same Constituency. To begin with Walker’s map was scanned at 1200 dots per inch in JPEG form. A scanned map cannot be linked to other spatial data without undergoing a process known as georeferencing. The CSO boundaries are available with spatial coordinates in the Irish National Grid system. The goal of georeferencing is to produce a rectified version of the map together with a world file. Rectification refers to the process of recomputing the pixel positions in the scanned map so that they are oriented with the ING coordinate system; the world file contains the extent in both the east-west and north-south directions of each pixel (in metres) and the coordinates of the most north-westerly pixel in the rectified image.
Georeferencing involves the identification of Ground Control Points – these are locations on the scanned map for which the spatial coordinates in ING are known. The Georeferencing option in ArcGIS 10.4 makes this a reasonably pain free task. For this map 36 GCPs were required for a local spline transformation. The Redistribution of Seats Act 1885 provides the legal basis for the constituencies to be used for future elections in England, Wales, Scotland and Ireland. Part III of the Seventh Schedule of the Act defines the Constituencies in terms of Baronies, Parishes (and part Parishes) and Townlands for Ireland. Part III of the Sixth Schedule provides definitions for the Boroughs of Belfast and Dublin.
The CSO boundary collection also includes a shapefile of Barony boundaries. This makes it possible code a barony in two ways: (i) allocated completely to a Division or (ii) split between two Divisions. For the first type, the code is just the division name, and for the second the code includes both (or more) division names. Allocation of these names to the data in the ED shapefile is accomplished by a spatial join operation. Recoding the areas in the split Baronies is done interactively using the GIS software’s editing option. EDs or groups of EDs can be selected on the screen, and the correct Division code updated in the attribute table. There are a handful of cases where an ED is split between divisions, so a simple ‘majority’ rule was used for the allocation. As the maps are to be used at mainly for displaying data at the national level, a misallocation is unlikely to be noticed. The final set of boundaries was created using the dissolve operation mentioned earlier. There were a dozen ED that had initially escaped being allocated a code, but these were quickly updated. Similarly, a few of the EDs in the split divisions had been overlooked; again updating was painless. This meant that the dissolve had to be run a few more times before all the errors have been corrected.
For the Northern Ireland districts, a slightly different methodology was deployed which involved linking parishes and townlands along side baronies, using open data sources from the OSM Townlands.ie project and OpenData NI.
Present-day countries in the British Empire 1600-2000
- statista.com
Updated Nov 13, 2019ShareFacebookTwitterEmailClick to copy linkLink copiedCiteStatista (2019). Present-day countries in the British Empire 1600-2000 [Dataset]. https://www.statista.com/statistics/1070352/number-current-countries-in-british-empire/Dataset updatedNov 13, 2019Area coveredUnited KingdomDescriptionIn the century between Napoleon's defeat and the outbreak of the First World War (known as the "Pax Britannica"), the British Empire grew to become the largest and most powerful empire in the world. At its peak in the 1910s and 1920s, it encompassed almost one quarter of both the world's population and its land surface, and was known as "the empire on which the sun never sets". The empire's influence could be felt across the globe, as Britain could use its position to affect trade and economies in all areas of the world, including many regions that were not part of the formal empire (for example, Britain was able to affect trading policy in China for over a century, due to its control of Hong Kong and the neighboring colonies of India and Burma). Some historians argue that because of its economic, military, political and cultural influence, nineteenth century Britain was the closest thing to a hegemonic superpower that the world ever had, and possibly ever will have. "Rule Britannia" Due to the technological and logistical restrictions of the past, we will never know the exact borders of the British Empire each year, nor the full extent of its power. However, by using historical sources in conjunction with modern political borders, we can gain new perspectives and insights on just how large and influential the British Empire actually was. If we transpose a map of all former British colonies, dominions, mandates, protectorates and territories, as well as secure territories of the East India Trading Company (EIC) (who acted as the precursor to the British Empire) onto a current map of the world, we can see that Britain had a significant presence in at least 94 present-day countries (approximately 48 percent). This included large territories such as Australia, the Indian subcontinent, most of North America and roughly one third of the African continent, as well as a strategic network of small enclaves (such as Gibraltar and Hong Kong) and islands around the globe that helped Britain to maintain and protect its trade routes. The sun sets... Although the data in this graph does not show the annual population or size of the British Empire, it does give some context to how Britain has impacted and controlled the development of the world over the past four centuries. From 1600 until 1920, Britain's Empire expanded from a small colony in Newfoundland, a failing conquest in Ireland, and early ventures by the EIC in India, to Britain having some level of formal control in almost half of all present-day countries. The English language is an official language in all inhabited continents, its political and bureaucratic systems are used all over the globe, and empirical expansion helped Christianity to become the most practiced major religion worldwide. In the second half of the twentieth century, imperial and colonial empires were eventually replaced by global enterprises. The United States and Soviet Union emerged from the Second World War as the new global superpowers, and the independence movements in longstanding colonies, particularly Britain, France and Portugal, gradually succeeded. The British Empire finally ended in 1997 when it seceded control of Hong Kong to China, after more than 150 years in charge. Today, the United Kingdom consists of four constituent countries, and it is responsible for three crown dependencies and fourteen overseas territories, although the legacy of the British Empire can still be seen, and it's impact will be felt for centuries to come.
- E
Popple, Henry 1733. A Map of the British Empire in America (Sheet 18)
- ecaidata.org
Updated Oct 4, 2014ShareFacebookTwitterEmailClick to copy linkLink copiedCiteECAI Clearinghouse (2014). Popple, Henry 1733. A Map of the British Empire in America (Sheet 18) [Dataset]. https://ecaidata.org/dataset/ecaiclearinghouse-id-436Dataset updatedOct 4, 2014Dataset provided byECAI ClearinghouseDescriptionHistorical Map of South / Central America from the David Rumsey Historical Map Collection
- s
Counties and Unitary Authorities (April 2023) Map in the UK
- geoportal.statistics.gov.uk
- hub.arcgis.com
Updated May 31, 2023+ more versionsShareFacebookTwitterEmailClick to copy linkLink copiedCiteOffice for National Statistics (2023). Counties and Unitary Authorities (April 2023) Map in the UK [Dataset]. https://geoportal.statistics.gov.uk/documents/1aa806eb35ee4334a87f5970c82e3ac0Dataset updatedMay 31, 2023Dataset authored and provided byOffice for National StatisticsLicensehttps://www.ons.gov.uk/methodology/geography/licenceshttps://www.ons.gov.uk/methodology/geography/licences
Area coveredDescriptionA PDF map that shows the counties and unitary authorities in the United Kingdom as at 1 April 2023. (File Size - 583 KB)
Census maps update: 5 January 2023
- gov.uk
Updated Jan 5, 2023+ more versionsShareFacebookTwitterEmailClick to copy linkLink copiedCiteOffice for National Statistics (2023). Census maps update: 5 January 2023 [Dataset]. https://www.gov.uk/government/statistics/census-maps-update-5-january-2023Dataset updatedJan 5, 2023AuthorsOffice for National StatisticsDescriptionOfficial statistics are produced impartially and free from political influence.
Voting intention in the United Kingdom 2025, by age
- statista.com
ShareFacebookTwitterEmailClick to copy linkLink copiedCiteStatista, Voting intention in the United Kingdom 2025, by age [Dataset]. https://www.statista.com/statistics/1379439/uk-election-polls-by-age/Time period coveredOct 5, 2025 - Oct 6, 2025Area coveredUnited KingdomDescriptionAs of October 2025, the political party that 18 to 24 year-old's in Great Britain would be most likely to vote for was the Labour Party, at 30 percent, with Labour also the joint-most popular party among those aged 25 to 49 along with Reform UK. Reform was the most popular party for the 50 to 64 age group, with 32 percent of voters saying they would vote for them. For the oldest age group, Reform was also the most popular, with 31 percent of over 65s intending to vote for them. Reform surge in the polls Since winning the last UK general election in July 2024, the ruling Labour Party have steadily become more unpopular among voters. After winning 33.7 percent of the vote in that election, the party was polling at 24 percent in April 2025, only slightly ahead of Reform UK on 23 percent. A right-wing populist party, Reform benefited from the collapse in support for the center-right Conservative Party in the last election, winning several seats at their expense. While the next UK general election is not due to be held until 2029, the government will be keen to address their collapsing approval ratings, in the face of Reform's rising support. Economic headaches for Labour in 2025 Although Labour inherited a growing economy, with falling inflation, and low unemployment from the Conservatives, the overall economic outlook for the UK is still quite gloomy. The country's government debt is around 100 percent of GDP, and without large tax rises and spending cuts, the government hopes to create a stronger, more resilient economy to reduce the deficit. While this is still a possibility, the UK's economic prospects for 2025 were recently slashed, with growth of one percent forecast, down from an earlier prediction of two percent. Although mainly due to external factors such as the threat of increasing tariffs, and general geopolitical instability, the UK's faltering economy will add further problems to the embattled government.
- u
Brexit as a Social Cleavage: Attitudes to Immigration and Race in Britain,...
- datacatalogue.ukdataservice.ac.uk
Updated Dec 11, 2018ShareFacebookTwitterEmailClick to copy linkLink copiedCiteSobolewska, M., University of Manchester; Ford, R., University of Manchester (2018). Brexit as a Social Cleavage: Attitudes to Immigration and Race in Britain, 2018 [Dataset]. http://doi.org/10.5255/UKDA-SN-8396-1Unique identifierhttps://doi.org/10.5255/UKDA-SN-8396-1Dataset updatedDec 11, 2018AuthorsSobolewska, M., University of Manchester; Ford, R., University of ManchesterArea coveredUnited KingdomDescriptionThe Brexit as a Social Cleavage: Attitudes to Immigration and Race in Britain, 2018 study uses a British Election Study online panel sub- sample to ask about attitudes towards ethnic minorities, racist behaviours, immigrants, and people who voted for Leave and Remain in the Brexit referendum. Linkage to the other British Election Survey questions is available.
This research had four goals: (1) to examine how the vote to leave the EU relates to the emergence of divisions in British society around immigration, diversity and identity, as a continuation of past trends, a transient shock, or the beginning of a fundamental political realignment; (2) to investigate how the referendum result is impacting on the internal politics and electoral strategies of the main opposition political parties to the left and right of the governing Conservative Party; (3) analyse how the referendum result is changing the politics of immigration, currently the most salient issue in the country, and map the emergence of a new agenda within this area: of immigrant integration policy and politics; (4) undertake an intensive and clearly-defined stream of impact and knowledge exchange work to communicate our findings to key stakeholders, to inform politicians, policymakers, journalists and civil society groups.
Further details about this study can be found on the Gateway to Research webpage. - o
Geographical, historical, political, philosophical and mechanical essays....
- llds.phon.ox.ac.uk
Updated May 31, 2024ShareFacebookTwitterEmailClick to copy linkLink copiedCiteLewis Evans; Lewis Evans; James Turner; Lewis Evans (2024). Geographical, historical, political, philosophical and mechanical essays. The first, containing an analysis of a general map of the middle British colonies in America; and of the country of the confederate Indians: a description of the face of the country; the boundaries of the confederates; and the maritime and inland navigations of the several rivers and lakes contained therein. / By Lewis Evans. [Dataset]. https://llds.phon.ox.ac.uk/llds/xmlui/handle/20.500.14106/N05835Dataset updatedMay 31, 2024AuthorsLewis Evans; Lewis Evans; James Turner; Lewis EvansLicenseCC0 1.0 Universal Public Domain Dedicationhttps://creativecommons.org/publicdomain/zero/1.0/
License information was derived automaticallyArea coveredUnited States, Confederate States of AmericaDescription(:unav)...........................................
- u
Discourses of Globalisation and European Integration in the United Kingdom...
- datacatalogue.ukdataservice.ac.uk
Updated Jul 5, 2006ShareFacebookTwitterEmailClick to copy linkLink copiedCiteSmith, N., University of Birmingham, Department of Political Science and International Studies (2006). Discourses of Globalisation and European Integration in the United Kingdom and Ireland, 2004-2005 [Dataset]. http://doi.org/10.5255/UKDA-SN-5370-1Unique identifierhttps://doi.org/10.5255/UKDA-SN-5370-1Dataset updatedJul 5, 2006AuthorsSmith, N., University of Birmingham, Department of Political Science and International StudiesLicenseMIT Licensehttps://opensource.org/licenses/MIT
License information was derived automaticallyTime period coveredJan 1, 2004 - Jan 1, 2005Area coveredIreland, United KingdomDescriptionThe principal objective of the research was to survey and map elite political attitudes to globalisation, European integration and the relationship between the two. Explicitly designed as a pilot study for a broader multi-country and multi-language European comparative analysis, the focus of the project was restricted to the United Kingdom (UK) and Ireland, two countries that are particularly well suited to a comparative analysis of this kind due to their common language, their common institutional origins and the structural similarities in their political economies.
The research was informed by the following key questions:- how policy-makers perceive globalisation and European integration (including the relationship between them)
- whether distinctive discourses of globalisation, European integration and the relationship between the two can be identified, how pervasive the concepts are, and to what extent they are conserved between cases and, within cases, between political parties, civil servants and politicians, and front- and back-benchers
- whether such discourses are national in character or are party-political factors the principal determinants of attitudes towards globalisation and European integration
- whether there are disparities between policy-makers' attitudes towards globalisation and European integration, as revealed in survey-based research and the official/public appeal to such discourses
Geolocet | Administrative boundaries map data | Europe | Countries, Regions,...
- datarade.ai
Updated Nov 3, 2023ShareFacebookTwitterEmailClick to copy linkLink copiedCiteGeolocet (2023). Geolocet | Administrative boundaries map data | Europe | Countries, Regions, Provinces, Municipalities, and more | Fully customizable format [Dataset]. https://datarade.ai/data-products/geolocet-administrative-boundaries-map-data-europe-coun-geolocet.json, .xml, .csv, .xls, .sql, .txtAvailable download formatsDataset updatedNov 3, 2023Dataset provided byAuthorsGeolocetArea coveredLatvia, Estonia, Belgium, Germany, Luxembourg, Italy, Hungary, United Kingdom, Finland, BulgariaDescriptionGeolocet's Administrative Boundaries Spatial Data serves as the gateway to visualizing geographic distributions and patterns with precision. The comprehensive dataset covers all European countries, encompassing the boundaries of each country, as well as its political and statistical divisions. Tailoring data purchases to exact needs is possible, allowing for the selection of individual levels of geography or bundling all levels for a country with a discount. The seamless integration of administrative boundaries onto digital maps transforms raw data into actionable insights.
🌐 Coverage Across European Countries
Geolocet's Administrative Boundaries Data offers coverage across all European countries, ensuring access to the most up-to-date and accurate geographic information. From national borders to the finest-grained administrative units, this data enables informed choices based on verified and official sources.
🔍 Geographic Context for Strategic Decisions
Understanding the geographical context is crucial for strategic decision-making. Geolocet's Administrative Boundaries Spatial Data empowers exploration of geo patterns, planning expansions, analysis of regional demographics, and optimization of operations with precision. Whether it is for establishing new business locations, efficient resource allocation, or policy impact analysis, this data provides the essential geographic context for success.
🌍 Integration with Geolocet’s Demographic Data
The integration of Geolocet's Administrative Boundaries Spatial Data with Geolocet's Demographic Data creates a synergy that enriches insights. The combination of administrative boundaries and demographic information offers a comprehensive understanding of regions and their unique characteristics. This integration enables tailoring of strategies, marketing campaigns, and resource allocation to specific areas with confidence.
🌍 Integration with Geolocet’s POI Data
Combining Geolocet's Administrative Boundaries Spatial Data with our POI (Points of Interest) Data unveils not only the administrative divisions but also insights into the local characteristics of these areas. Overlaying POI data on administrative boundaries reveals details about the number and types of businesses, services, and amenities within specific regions. Whether conducting market research, identifying prime locations for retail outlets, or analyzing the accessibility of essential services, this combined data empowers a holistic view of target areas.
🔍 Customized Data Solutions with DaaS
Geolocet's Data as a Service (DaaS) model offers flexibility tailored to specific needs. The transparent pricing model ensures cost-efficiency, allowing payment solely for the required data. Whether nationwide administrative boundary data or specific regional details are needed, Geolocet provides a solution to match individual objectives. Contact us today to explore how Geolocet's Administrative Boundaries Spatial Data can elevate decision-making processes and provide the essential geographic data for success.
- u
EU Families in Brexiting Britain, 2017-2019
- datacatalogue.ukdataservice.ac.uk
- datacatalogue.cessda.eu
Updated Mar 21, 2024ShareFacebookTwitterEmailClick to copy linkLink copiedCiteSigona, N, University of Birmingham (2024). EU Families in Brexiting Britain, 2017-2019 [Dataset]. http://doi.org/10.5255/UKDA-SN-854174Unique identifierhttps://doi.org/10.5255/UKDA-SN-854174Dataset updatedMar 21, 2024AuthorsSigona, N, University of BirminghamArea coveredUnited KingdomDescriptionThis project collected survey and interview data to study Eurochildren, their families and their experience and responses to Brexit. The project aims to portray the emergence of a new politics of belonging, which reconfigures discursively and legally who belongs to a post-EU Britain. It also aims to establish a baseline for future research on migration and settlement decision making in families with EU27 nationals following the formal exit of the European Union.
The UK has been a member of the European Union for 40 years. Throughout that time there has been intermingling of people and institutions which can be most clearly seen in the growing number of bi- and mixed-nationality EU families in the UK and their children, many of whom born in the UK and holding a British passport. This is a growing, and yet understudied and underreported, segment of the British society. In a post-EU referendum context, where the rhetoric about curbing EU immigration has permeated political, media, and popular discourses, producing a stark 'us and them' narrative, the question left unasked and unanswered is what are the human and emotional costs of this abrupt geopolitical shift if 'us and them' are the same? Through the study of Eurochildren and their families and their experience and responses to Brexit, the project aims to portrait the emergence of a new politics of belonging which reconfigures discursively and legally who belong to a post-EU Britain and establish a baseline for future research on migration and settlement decision making in families with EU27 nationals following the formal exit of the European Union. In order to do so, it will: 1) Profile and map the population of UK- and EU-born children of EU nationals in the UK and examine, at the aggregate level, different types of EU families and measure their socio-economic inclusion into British society. 2) Investigate how families with at least one EU27 member experience and respond to the process of exiting from the European Union and identify factors that shape such responses. 3) Examine the impact of the EU referendum and its aftermath on different age cohorts of UK-born Eurochildren, examining in particular how they articulate their sense of belonging and attitudes vis-a-vis the UK and the EU. With a team comprising academic experts in the fields of migration and integration, third sector collaborators and legal experts, and using a mixed methods approach, this project provide an empirically-rich and in-depth account of how EU families, often including both UK and EU passport holders and members with dual citizenship, experience and plan to respond to Brexit, a baseline from which to further analyse the process family migration decision making following the formal exit from the EU. The project involves three interconnected work packages (WP). WP1, which is of a quantitative nature, will analyse historical Census and Live Birth data in order to profile and geographically map EU families and their children. Different configurations of EU families, based on their demographic, geographical, and inclusion circumstances, will be established via this data and will inform the qualitative work in WP2 and 3 and our analysis of legal and policy implications of Brexit on this population. In WP2 focus groups and in-depth interviews will be conducted with EU families, as well as reflexive research, in order to explore questions of belonging within the context of the exit from the EU. In WP3, interview with UK-born adult Eurochildren and EU-born parents of Eurochildren will be conducted in order to bring to the fore the ways in which children experience migration decision-making and belonging. This mixed methods study will generate ground-breaking new data on EU families and their EU and UK-born children in the UK, contributing to the strategic, political and policy responses of UK and EU policy makers and to a more informed public debate on the consequences of Brexit on UK and EU citizens alike. The project includes a strategy set to maximise dissemination and impact. This will be done via: producing robust, composite and promptly accessible evidence (journal articles, blogs, briefings, media and online materials); engaging from the outset with a wide network of researchers, policy makers and practitioners; and using tailored dissemination channels to reach out to relevant audiences.
- u
Non-Industrial Civil Service Staff Statistics : British Isles, 1939-1999
- datacatalogue.ukdataservice.ac.uk
Updated Dec 17, 2001ShareFacebookTwitterEmailClick to copy linkLink copiedCiteMcMillan, J. M. A., University of Northumbria at Newcastle, Division of Government and Politics; Massey, A., University of Portsmouth, School of Social, Historical and Literary Studies; Rhodes, R. A. W., University of Newcastle upon Tyne, Department of Politics; Carmichael, P., University of Ulster, School of Public Policy, Economics and Law (2001). Non-Industrial Civil Service Staff Statistics : British Isles, 1939-1999 [Dataset]. http://doi.org/10.5255/UKDA-SN-4354-1Unique identifierhttps://doi.org/10.5255/UKDA-SN-4354-1Dataset updatedDec 17, 2001AuthorsMcMillan, J. M. A., University of Northumbria at Newcastle, Division of Government and Politics; Massey, A., University of Portsmouth, School of Social, Historical and Literary Studies; Rhodes, R. A. W., University of Newcastle upon Tyne, Department of Politics; Carmichael, P., University of Ulster, School of Public Policy, Economics and LawTime period coveredJan 1, 1939 - Jan 1, 1999Area coveredChannel Islands, Isle of Man, United KingdomDescriptionThe aims of the project were:
to analyse the factors propelling change in the Civil Service outside Whitehall;
to create a database of the Civil Service outside Whitehall covering numbers of employees, units, expenditure and functions;
to map the procedures for recruitment, promotion, training, pay and conditions of employment;
to describe how those who work in the Civil Service outside Whitehall perceive both their work and the Civil Service;
to explore the tensions between territorial and functional politics.
The dataset is compiled from official sources covering 1939-1999. Interactive content from Census 2021 first results
- gov.uk
- s3.amazonaws.com
Updated Jun 28, 2022ShareFacebookTwitterEmailClick to copy linkLink copiedCiteOffice for National Statistics (2022). Interactive content from Census 2021 first results [Dataset]. https://www.gov.uk/government/statistics/interactive-content-from-census-2021-first-resultsDataset updatedJun 28, 2022AuthorsOffice for National StatisticsDescriptionOfficial statistics are produced impartially and free from political influence.
- u
Inside the Engine Room: Assessing Cabinet Committees, 1945-1966
- datacatalogue.ukdataservice.ac.uk
Updated Aug 20, 2002ShareFacebookTwitterEmailClick to copy linkLink copiedCiteCatterall, P., Queen Mary, University of London, Department of History (2002). Inside the Engine Room: Assessing Cabinet Committees, 1945-1966 [Dataset]. http://doi.org/10.5255/UKDA-SN-4574-1Unique identifierhttps://doi.org/10.5255/UKDA-SN-4574-1Dataset updatedAug 20, 2002AuthorsCatterall, P., Queen Mary, University of London, Department of HistoryTime period coveredJan 1, 1945 - Jan 1, 1966Area coveredUnited KingdomDescriptionThe aim of this research project was to provide a detailed guide of British cabinet structures over the period 1945-1966, in order:
- to show the inter-relationship between the various committees and sub-committees
- to examine the influences shaping the structure of the core policymaking executive
- to assess how effectively the system coped with challenges and crises
- to map committee membership and chairmanship for the period 1945-1966
- to assess the use to which committees were put and the focus of power and influence within the system
- to assess the relationship between the core machinery and the departments or the military where policymaking is implemented. - E
Data from: Scottish Independence Referendum 2014
- dtechtive.com
- find.data.gov.scot
xml, zipUpdated Feb 22, 2017ShareFacebookTwitterEmailClick to copy linkLink copiedCiteUniversity of Edinburgh (2017). Scottish Independence Referendum 2014 [Dataset]. http://doi.org/10.7488/ds/1964xml(0.0041 MB), zip(7.987 MB)Available download formatsUnique identifierhttps://doi.org/10.7488/ds/1964Dataset updatedFeb 22, 2017Dataset provided byUniversity of EdinburghArea coveredScotlandDescriptionthis dataset shows the results of the 2014 referendum on Scottish Independence which took place on the 18th September 2014. The data is broken down into the geographical areas such as Edinburgh, Midlothian, Fife and the Highlands. The data shows the number of Yes/No votes, the percentage and the difference between the two (positive depicts a No win). It is interesting to note that anyone over the age of 16 was eligible to vote, a change to the normal over 18 policy in general elections. Turnout was high with 84.6% of those eligible voting. The data was sourced from: http://www.cityam.com/1411046935/who-won-where-how-scottish-councils-voted-independence-referendum-results-map and then combined with Boundary Data from the OS Opendata that provided the geographical boundaries. Another good source of info and maps is http://www.bbc.co.uk/news/uk-scotland-scotland-politics-29255449. GIS vector data. This dataset was first accessioned in the EDINA ShareGeo Open repository on 2014-09-24 and migrated to Edinburgh DataShare on 2017-02-22.
- e
Borough Council Election Results 2014
- data.europa.eu
excel xls, pdfUpdated Dec 1, 2014+ more versionsShareFacebookTwitterEmailClick to copy linkLink copiedCiteGreater London Authority (2014). Borough Council Election Results 2014 [Dataset]. https://data.europa.eu/data/datasets/borough-council-election-results-2014excel xls, pdfAvailable download formatsDataset updatedDec 1, 2014Dataset authored and provided byGreater London AuthorityDescription
This report includes a great deal of detail on every aspect of the 2014 London Borough council general elections. No other single volume presents the full results and election statistics from the 32 London boroughs enabling the reader to analyse and compare the results across London in one place. The report presents data for every candidate in every ward (excluding the City of London which operates on a different electoral model). The report also contains analysis of the European election results for London that took place on the same day.
Printed Copies We are able to accept orders for hard copies £30. Click here for further details.
Details of all previous elections reports in the series can be found here.
Summary results of the 2014 local elections in London, showing number and percentage of seats won, turnout and political control.
Final 2014 ward results
These results show the number of votes for each candidate in each ward in London. Turnout, number of ballots, postal votes, and breakdown of rejected votes, Mayoral and European voting figures are also included where available.
Map showing political control in each ward.
https://londondatastore-upload.s3.amazonaws.com/images/London-ward-map-borough-election-2014-new-colours-small.png" alt="">
Also, using these ward results, Oliver O'Brien from CASA has created some eye catching interactive ward maps.
The borough map shows the summary results in both the 2010 and 2014 elections.
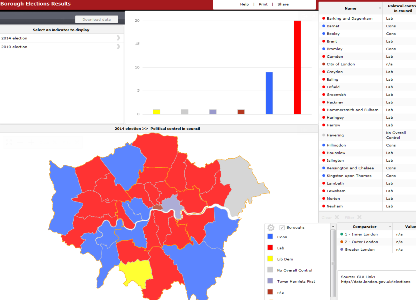
The ward interactive map shows the detailed results for each candidate at ward level for the last three elections between 2006 and 2014.

This motion chart shows the relationship, between share of votes and seats won by the major parties in elections since 1964 at borough level (requires Adobe Flash Player).
 )
) - 2
Childcare and Early Years Provision, 2003-
- datacatalogue.ukdataservice.ac.uk
Updated Sep 13, 2024+ more versionsShareFacebookTwitterEmailClick to copy linkLink copiedCiteUK Data Service (2024). Childcare and Early Years Provision, 2003- [Dataset]. http://doi.org/10.5255/UKDA-SN-8952-1Unique identifierhttps://doi.org/10.5255/UKDA-SN-8952-1Dataset updatedSep 13, 2024Area coveredEnglandDescriptionThe introduction of the National Childcare Strategy in 1998 marked a radical shift in government policy and for the first time put childcare provision firmly on the political map. Since then a wide range of childcare initiatives and funding streams have been introduced, and hence there is a need for regular data to aid the evaluation of recent policy interventions in these areas. The Childcare and Early Years Provision survey series is divided into two survey strands: the Parents’ Survey and the Providers’ Survey.
The Parents’ Survey provides data on parents’ take-up, views and experiences of childcare. Families in England are randomly selected from the Child Benefit Records and all parents had children aged 0-14 years. They are asked about their use and experiences of childcare for all children in the family and to give more detailed information about childcare for a particular child (selected at random where there is more than one child in the family). The current Parents' Survey series replaces two previous surveys: the Survey of Parents of Three and Four-Year-Old Children and Their Use of Early Years Services (conducted between 1997 and 2002) and Parents' Demand for Childcare, conducted in 1999 and 2001 (see SNs 4380 and 4970 respectively).
The Providers' Survey monitors the characteristics and development of childcare and early years providers and the workforce in England. Information was collected on the number and characteristics of providers, the characteristics of the children enrolled, workforce composition, qualifications and training, recruitment and retention, and business operation. The 2016 survey underwent an extensive redesign, which means findings are not comparable with previous surveys.
The 2020 survey was cancelled due to the COVID-19 pandemic
Further information is available on the GOV.UK Childcare and Early Years Statistics webpage.Special licence dataAdditional, more detailed variables from the Providers' Survey in 2018, 2019 and 2021 are available under Special Licence (SL). The SL data have more restrictive access conditions than those made available under the standard End User Licence (EUL) agreement. Prospective users of the SL version will need to complete an extra application form and demonstrate to the data owners exactly why they need access to the additional variables in order to get permission to use that version. Users are advised to consult the EUL version first and the list of variables available under each study before applying.The Childcare and Early Years Provision: Providers' Survey, 2019 (CCEYP 2019) collected information on the main characteristics of childcare and early years provision in England to allow the evaluation of policy initiatives. The Department for Education (DfE) commissioned the National Centre for Social Research (NatCen) and Frontier Economics to conduct the CCEYP 2019. Data were collected via a mixed mode web and Computer Assisted Telephone Interviewing (CATI) survey. The 2019 survey was designed to be comparable with the 2018 survey, notwithstanding the introduction of web mode. Other differences between the 2018 and 2019 surveys, such as minor differences to the sampling process, are detailed in the technical report.
The SL version of CCEYP 2019 is available from the UK Data Archive under SN 8954. DH Lawrence in London.kml
- figshare.com
xmlUpdated Jun 1, 2023ShareFacebookTwitterEmailClick to copy linkLink copiedCitedonna alexander (2023). DH Lawrence in London.kml [Dataset]. http://doi.org/10.6084/m9.figshare.5684185.v1xmlAvailable download formatsUnique identifierhttps://doi.org/10.6084/m9.figshare.5684185.v1Dataset updatedJun 1, 2023Authorsdonna alexanderLicenseAttribution 4.0 (CC BY 4.0)https://creativecommons.org/licenses/by/4.0/
License information was derived automaticallyArea coveredLondonDescriptionThis data is used to create a map of DH Lawrence's time spent in London from 1908-1926. It includes details of his working life, writing, dealings with publishers, literary acquaintances, commentary of the cultural and political climate of the time, and personal life. All quotations from Lawrence, as on the Timeline, are taken from the Cambridge University Press Edition of the Letters and Works of D.H. Lawrence, General Editors James T. Boulton, M. H. Black, Paul Poplawski and John Worthen, ongoing since 1979.
- 2
CEYSP
- datacatalogue.ukdataservice.ac.uk
Updated Sep 13, 2024ShareFacebookTwitterEmailClick to copy linkLink copiedCiteUK Data Service (2024). CEYSP [Dataset]. http://doi.org/10.5255/UKDA-SN-8603-1Unique identifierhttps://doi.org/10.5255/UKDA-SN-8603-1Dataset updatedSep 13, 2024Time period coveredJan 1, 2019 - Aug 31, 2019Area coveredEnglandDescriptionThe introduction of the National Childcare Strategy in 1998 marked a radical shift in government policy and for the first time put childcare provision firmly on the political map. Since then a wide range of childcare initiatives and funding streams have been introduced, and hence there is a need for regular data to aid the evaluation of recent policy interventions in these areas. The Childcare and Early Years Provision survey series is divided into two survey strands: the Parents’ Survey and the Providers’ Survey.
The Parents’ Survey provides data on parents’ take-up, views and experiences of childcare. Families in England are randomly selected from the Child Benefit Records and all parents had children aged 0-14 years. They are asked about their use and experiences of childcare for all children in the family and to give more detailed information about childcare for a particular child (selected at random where there is more than one child in the family). The current Parents' Survey series replaces two previous surveys: the Survey of Parents of Three and Four-Year-Old Children and Their Use of Early Years Services (conducted between 1997 and 2002) and Parents' Demand for Childcare, conducted in 1999 and 2001 (see SNs 4380 and 4970 respectively).
The Providers' Survey monitors the characteristics and development of childcare and early years providers and the workforce in England. Information was collected on the number and characteristics of providers, the characteristics of the children enrolled, workforce composition, qualifications and training, recruitment and retention, and business operation. The 2016 survey underwent an extensive redesign, which means findings are not comparable with previous surveys.
The 2020 survey was cancelled due to the COVID-19 pandemic
Further information is available on the GOV.UK Childcare and Early Years Statistics webpage.Special licence dataAdditional, more detailed variables from the Providers' Survey in 2018, 2019 and 2021 are available under Special Licence (SL). The SL data have more restrictive access conditions than those made available under the standard End User Licence (EUL) agreement. Prospective users of the SL version will need to complete an extra application form and demonstrate to the data owners exactly why they need access to the additional variables in order to get permission to use that version. Users are advised to consult the EUL version first and the list of variables available under each study before applying.The Childcare and Early Years Provision: Parents’ Survey, 2019 had two key objectives. The first was to provide salient, up-to date information on parents' use of childcare and early years provision, and their views and experiences of particular childcare providers and childcare provision in general. The second was to continue the time series - which has now been running for over ten years - on issues covered throughout the survey series.
With respect to both these objectives, the study aims to provide information to help monitor the progress of policies in the area of childcare and early years education. Further information about this study can be found on the GOV.UK Childcare and early years survey of parents: 2019 web page. - 2
Childcare and Early Years Provision, 2003-
- datacatalogue.ukdataservice.ac.uk
Updated Sep 13, 2024+ more versionsShareFacebookTwitterEmailClick to copy linkLink copiedCiteDepartment for Education and Skills, Sure Start Research and Evaluation Division (2024). Childcare and Early Years Provision, 2003- [Dataset]. http://doi.org/10.5255/UKDA-SN-5553-1Unique identifierhttps://doi.org/10.5255/UKDA-SN-5553-1Dataset updatedSep 13, 2024AuthorsDepartment for Education and Skills, Sure Start Research and Evaluation DivisionArea coveredEnglandDescriptionThe introduction of the National Childcare Strategy in 1998 marked a radical shift in government policy and for the first time put childcare provision firmly on the political map. Since then a wide range of childcare initiatives and funding streams have been introduced, and hence there is a need for regular data to aid the evaluation of recent policy interventions in these areas. The Childcare and Early Years Provision survey series is divided into two survey strands: the Parents’ Survey and the Providers’ Survey.
The Parents’ Survey provides data on parents’ take-up, views and experiences of childcare. Families in England are randomly selected from the Child Benefit Records and all parents had children aged 0-14 years. They are asked about their use and experiences of childcare for all children in the family and to give more detailed information about childcare for a particular child (selected at random where there is more than one child in the family). The current Parents' Survey series replaces two previous surveys: the Survey of Parents of Three and Four-Year-Old Children and Their Use of Early Years Services (conducted between 1997 and 2002) and Parents' Demand for Childcare, conducted in 1999 and 2001 (see SNs 4380 and 4970 respectively).
The Providers' Survey monitors the characteristics and development of childcare and early years providers and the workforce in England. Information was collected on the number and characteristics of providers, the characteristics of the children enrolled, workforce composition, qualifications and training, recruitment and retention, and business operation. The 2016 survey underwent an extensive redesign, which means findings are not comparable with previous surveys.
The 2020 survey was cancelled due to the COVID-19 pandemic
Further information is available on the GOV.UK Childcare and Early Years Statistics webpage.Special licence dataAdditional, more detailed variables from the Providers' Survey in 2018, 2019 and 2021 are available under Special Licence (SL). The SL data have more restrictive access conditions than those made available under the standard End User Licence (EUL) agreement. Prospective users of the SL version will need to complete an extra application form and demonstrate to the data owners exactly why they need access to the additional variables in order to get permission to use that version. Users are advised to consult the EUL version first and the list of variables available under each study before applying.The Childcare and Early Years Provision: Providers’ Survey, 2005 is the most recent survey in the series, aimed at tracking the characteristics and development of childcare
In order to reduce the time it took providers to complete the interview, a core set of questions were asked of all providers, and then the sample was randomly divided into two groups, one of which was asked questions in module A (costs and income) while the other group was asked questions in module B (training and recruitment). The same questionnaire was put to the group providers and a slightly different questionnaire was used for childminders.
The survey found that the structure of the childcare providers market was changing, having seen a reduction in numbers of sessional providers coupled with an increase in numbers of 'Full Day Care' providers. A substantial increase of out-of-school providers was also evident, as was a smaller decrease in numbers of registered childminders.
FacebookTwitterAttribution 4.0 (CC BY 4.0)https://creativecommons.org/licenses/by/4.0/
License information was derived automatically
The 1885 UK parliamentary constituencies for Ireland were re-created in 2017 as part of a conference paper delivered at the Southern Irish Loyalism in Context conference at Maynooth University. The intial map only included the territory of the Irish Free State and was created by Martin Charlton and Jack Kavanagh. The remaining six counties of Ulster were completed by Eoin McLaughlin in 2018-19, the combined result is a GIS map of all the parliamentary constituecies across the island of Ireland for the period 1885-1918. The map is available in both ESRI Shapefile format and as a GeoPackage (GPKG). The methodology for creating the constituencies is outlined in detail below.
Methodology
A map showing the outlines of the 1855 – 1918 Constituency boundaries can be found on page 401 of Parliamentary Elections in Ireland, 1801-1922 (Dublin, 1978) by Brian Walker. This forms the basis for the creation of a set of digital boundaries which can then be used in a GIS. The general workflow involves allocating an 1885 Constituency identifier to each of the 309 Electoral Divisions present in the boundaries made available for the 2011 Census of Population data release by CSO. The ED boundaries are available in ‘shapefile’ format (a de facto standard for spatial data transfer). Once a Constituency identifier has been given to each ED, the GIS operation known as ‘dissolve’ is used to remove the boundaries between EDs in the same Constituency. To begin with Walker’s map was scanned at 1200 dots per inch in JPEG form. A scanned map cannot be linked to other spatial data without undergoing a process known as georeferencing. The CSO boundaries are available with spatial coordinates in the Irish National Grid system. The goal of georeferencing is to produce a rectified version of the map together with a world file. Rectification refers to the process of recomputing the pixel positions in the scanned map so that they are oriented with the ING coordinate system; the world file contains the extent in both the east-west and north-south directions of each pixel (in metres) and the coordinates of the most north-westerly pixel in the rectified image.
Georeferencing involves the identification of Ground Control Points – these are locations on the scanned map for which the spatial coordinates in ING are known. The Georeferencing option in ArcGIS 10.4 makes this a reasonably pain free task. For this map 36 GCPs were required for a local spline transformation. The Redistribution of Seats Act 1885 provides the legal basis for the constituencies to be used for future elections in England, Wales, Scotland and Ireland. Part III of the Seventh Schedule of the Act defines the Constituencies in terms of Baronies, Parishes (and part Parishes) and Townlands for Ireland. Part III of the Sixth Schedule provides definitions for the Boroughs of Belfast and Dublin.
The CSO boundary collection also includes a shapefile of Barony boundaries. This makes it possible code a barony in two ways: (i) allocated completely to a Division or (ii) split between two Divisions. For the first type, the code is just the division name, and for the second the code includes both (or more) division names. Allocation of these names to the data in the ED shapefile is accomplished by a spatial join operation. Recoding the areas in the split Baronies is done interactively using the GIS software’s editing option. EDs or groups of EDs can be selected on the screen, and the correct Division code updated in the attribute table. There are a handful of cases where an ED is split between divisions, so a simple ‘majority’ rule was used for the allocation. As the maps are to be used at mainly for displaying data at the national level, a misallocation is unlikely to be noticed. The final set of boundaries was created using the dissolve operation mentioned earlier. There were a dozen ED that had initially escaped being allocated a code, but these were quickly updated. Similarly, a few of the EDs in the split divisions had been overlooked; again updating was painless. This meant that the dissolve had to be run a few more times before all the errors have been corrected.
For the Northern Ireland districts, a slightly different methodology was deployed which involved linking parishes and townlands along side baronies, using open data sources from the OSM Townlands.ie project and OpenData NI.