- a
Transportation Happiness Map
- showcase-mngislis.hub.arcgis.com
Updated Jan 6, 2023 Share
Share Facebook
 Twitter
 EmailClick to copy linkLink copiedCiteMN GIS/LIS Consortium (2023). Transportation Happiness Map [Dataset]. https://showcase-mngislis.hub.arcgis.com/datasets/transportation-happiness-mapDataset updatedJan 6, 2023Dataset authored and provided byMN GIS/LIS ConsortiumDescription
About this itemThe Minneapolis-St. Paul Transportation Happiness Map illustrates spatiotemporal differences in travelers’ happiness ratings on the streets and roads in the Minneapolis-St. Paul metropolitan region. The data powering the map was collected using the Daynamica smartphone application, which is developed by University of Minnesota researchers. The map makes self-reported emotional experience data easily accessible through visualization. Users can select among 10 travel mode options, 7 time options, 8 emotion options, and two statistic options to visualize patterns of transportation happiness.Author/ContributorYingling FanOrganizationUniversity of MinnesotaOrg Websitewww.hhh.umn.edu
😃🥳😁 Happiness index
- kaggle.com
Updated Sep 14, 2023ShareFacebookTwitterEmailClick to copy linkLink copiedCitemeer atif magsi (2023). 😃🥳😁 Happiness index [Dataset]. https://www.kaggle.com/datasets/meeratif/happiness-index/versions/1CroissantCroissant is a format for machine-learning datasets. Learn more about this at mlcommons.org/croissant.Dataset updatedSep 14, 2023Dataset provided byKaggleAuthorsmeer atif magsiDescriptionContext:
The "Global Happiness Index and Homicide Rate Dataset" provides a comprehensive overview of happiness rankings and homicide rates for countries around the world. This dataset is a valuable resource for researchers, analysts, policymakers, and anyone interested in exploring the relationship between happiness and crime rates. It combines two critical dimensions of a country's well-being: its citizens' happiness levels and the prevalence of homicides.
Content:
1.**Countries:** This column contains the names of the countries included in the dataset. It serves as the primary identifier for each data entry.
2.**Global Rank:** This column indicates the global ranking of each country based on its happiness index. The happiness index measures the overall well-being and contentment of a nation's citizens, taking into account factors like income, social support, life expectancy, freedom to make life choices, trust in government, and generosity. A lower rank suggests a higher level of happiness.
3.**Available Data:** This column provides information about the completeness and reliability of the data for each country. It may indicate whether there are missing values, data quality issues, or other relevant notes regarding the dataset's integrity.
This dataset can be used for various analytical purposes, such as:
Exploratory Data Analysis (EDA): Researchers can explore the relationship between a country's happiness ranking and its homicide rate to identify potential correlations or patterns.
Geospatial Analysis: Analysts can create maps and visualizations to display the geographic distribution of happiness rankings and homicide rates.
Policy Insights: Policymakers can use this dataset to inform decisions related to public safety, social programs, and well-being initiatives.
Machine Learning and Predictive Modeling: Data scientists can build predictive models to understand the factors that contribute to happiness and to forecast potential changes in homicide rates.
- r
Data from: The happiness turn? Mapping the Emergence of “Happiness Studies”...
- researchdata.se
Updated Jun 17, 2025+ more versionsShareFacebookTwitterEmailClick to copy linkLink copiedCiteChristopher Kullenberg; Gustaf Nelhans (2025). The happiness turn? Mapping the Emergence of “Happiness Studies” Using Cited References. [Dataset]. http://doi.org/10.5878/002633(56000744)Available download formatsUnique identifierhttps://doi.org/10.5878/002633Dataset updatedJun 17, 2025Dataset provided byUniversity of GothenburgAuthorsChristopher Kullenberg; Gustaf NelhansTime period coveredJan 1, 1960 - Dec 31, 2013DescriptionThe study analyzes “happiness studies” as an emerging field of inquiry throughout various scientific disciplines and research areas. Utilizing four operationalized search terms in the Web of Science; “happiness”, “subjective well-being”, “life satisfaction” and “positive affect”, a dataset was created for empirical citation analysis. Combined with qualitative interpretations of the publications, the results show how happiness studies have developed over time, in what journals the citing papers have been published, and which authors and researchers are the most productive within this set. The conclusion is that “happiness studies” have emerged in many different disciplinary contexts and progressively been integrated and standardized. Moreover, beginning at the turn of the millennium, happiness studies have even begun to shape an autonomous field of inquiry, in which happiness becomes a key research problem for itself, and we may even speak of a “happiness turn”.
Purpose:
The study aims at drawing a more precise map of the scientific research contexts in which happiness studies have become a core activity, an integrated part of research, or a peripheral side-activity to normal science within a pre-existing discipline. The aim is to show how a new research field - ‘‘happiness studies’’ - has emerged, consolidated and become integrated into practices of research.
World Happiness Report 2012-2024 (SDSN)
- sdgstoday-sdsn.hub.arcgis.com
Updated Mar 16, 2024+ more versionsShareFacebookTwitterEmailClick to copy linkLink copiedCiteSustainable Development Solutions Network (2024). World Happiness Report 2012-2024 (SDSN) [Dataset]. https://sdgstoday-sdsn.hub.arcgis.com/maps/aaf6c6564f3047af9a0c600f736d7c00Dataset updatedMar 16, 2024LicenseAttribution-NonCommercial-ShareAlike 4.0 (CC BY-NC-SA 4.0)https://creativecommons.org/licenses/by-nc-sa/4.0/
License information was derived automaticallyArea coveredDescriptionThis map is part of SDGs Today. Please see sdgstoday.org.The World Happiness Report is a landmark survey of the state of global happiness that ranks 150+ countries by how happy their citizens perceive themselves to be.Much of the growing international interest in happiness exists, thanks to Bhutan. They sponsored Resolution 65/309, “Happiness: Towards a holistic approach to development,” adopted by the General Assembly of the United Nations on 19 July 2011, inviting national governments to “give more importance to happiness and well-being in determining how to achieve and measure social and economic development.” The gross domestic product (GDP) indicator was not designed to and did not adequately reflect the happiness and well-being of people.Life evaluations from the Gallup World Poll provide the basis for the annual happiness rankings. They are based on answers to the main life evaluation question, the Cantril ladder. The rankings are from nationally representative samples over three years.
- N
Movie clips: importance map LRP 3 Happiness
- neurovault.org
niftiUpdated Jan 9, 2018+ more versionsShareFacebookTwitterEmailClick to copy linkLink copiedCite(2018). Movie clips: importance map LRP 3 Happiness [Dataset]. http://identifiers.org/neurovault.image:58827niftiAvailable download formatsUnique identifierhttps://identifiers.org/neurovault.image:58827Dataset updatedJan 9, 2018LicenseCC0 1.0 Universal Public Domain Dedicationhttps://creativecommons.org/publicdomain/zero/1.0/
License information was derived automaticallyDescriptionFSL4.0
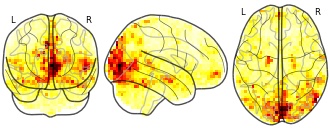
Collection description
Subject species
homo sapiens
Map type
Other
Happy Valley 1:100 000 topographic map
- data.gov.au
html, tiffUpdated Jan 1, 1981ShareFacebookTwitterEmailClick to copy linkLink copiedCiteCommonwealth of Australia (Geoscience Australia) (1981). Happy Valley 1:100 000 topographic map [Dataset]. https://data.gov.au/dataset/ds-ga-a05f7892-e736-7506-e044-00144fdd4fa6/details?q=tiff, htmlAvailable download formatsDataset updatedJan 1, 1981LicenseAttribution 4.0 (CC BY 4.0)https://creativecommons.org/licenses/by/4.0/
License information was derived automaticallyDescriptionAt this scale 1cm on the map represents 1km on the ground. Each map covers a minimum area of 0.5 degrees longitude by 0.5 degrees latitude or about 54 kilometres by 54 kilometres. The contour …Show full descriptionAt this scale 1cm on the map represents 1km on the ground. Each map covers a minimum area of 0.5 degrees longitude by 0.5 degrees latitude or about 54 kilometres by 54 kilometres. The contour interval is 20 metres. Many maps are supplemented by hill shading. These maps contain natural and constructed features including road and rail infrastructure, vegetation, hydrography, contours, localities and some administrative boundaries. Product Specifications Coverage: Australia is covered by more than 3000 x 1:100 000 scale maps, of which 1600 have been published as printed maps. Unpublished maps are available as compilations. Currency: Ranges from 1961 to 2009. Average 1997. Coordinates: Geographical and either AMG or MGA coordinates. Datum: AGD66, GDA94; AHD Projection: Universal Transverse Mercator UTM. Medium: Printed maps: Paper, flat and folded copies. Compilations: Paper or film, flat copies only.
- N
Movie clips: Reproducibility map LRP p0.010 3 Happiness
- neurovault.org
niftiUpdated Jan 9, 2018+ more versionsShareFacebookTwitterEmailClick to copy linkLink copiedCite(2018). Movie clips: Reproducibility map LRP p0.010 3 Happiness [Dataset]. http://identifiers.org/neurovault.image:58801niftiAvailable download formatsUnique identifierhttps://identifiers.org/neurovault.image:58801Dataset updatedJan 9, 2018LicenseCC0 1.0 Universal Public Domain Dedicationhttps://creativecommons.org/publicdomain/zero/1.0/
License information was derived automaticallyDescriptionFSL4.0
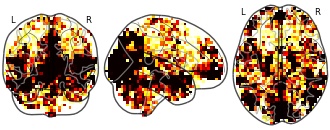
Collection description
Subject species
homo sapiens
Map type
Other
- a
Vibrant Basemap
- hub.arcgis.com
- cacgeoportal.com
Updated Aug 9, 2019+ more versionsShareFacebookTwitterEmailClick to copy linkLink copiedCiteArcGIS Maps for the Nation (2019). Vibrant Basemap [Dataset]. https://hub.arcgis.com/maps/nation::tc-nextgen-150m-geotiff/aboutDataset updatedAug 9, 2019Dataset authored and provided byArcGIS Maps for the NationArea coveredDescriptionThis basemap was designed with the Vizzuality team for use in the Half-Earth Project globe. The saturated palette and rich landcover tones are meant to engage an audience and to provide the sense that the earth is a charming and beautiful place worthy of thoughtful stewardship. As you zoom in, the saturated basemap is slowly replaced by imagery.This basemap is the major component of the Vibrant Map. The Vibrant Map is configured to use these basemap tiles from global to regional extents, then transition to Esri's World Imagery basemap tiles for a seamless transition from small to large scale.Find more information about this basemap, and its contributing data, here: https://www.esri.com/arcgis-blog/products/arcgis-pro/mapping/creating-the-half-earth-vibrant-basemap/Learn more about the Half-Earth Project here and explore highlighted areas of biodiversity here.Happy Mapping! John
- O
Happy Valley 1:100000 Mine Map Provisional 1970
- data.qld.gov.au
Updated May 9, 2023+ more versionsShareFacebookTwitterEmailClick to copy linkLink copiedCiteGeological Survey of Queensland (2023). Happy Valley 1:100000 Mine Map Provisional 1970 [Dataset]. https://www.data.qld.gov.au/dataset/mr009428Dataset updatedMay 9, 2023Dataset authored and provided byGeological Survey of QueenslandLicenseAttribution 4.0 (CC BY 4.0)https://creativecommons.org/licenses/by/4.0/
License information was derived automaticallyDescriptionURL: https://geoscience.data.qld.gov.au/dataset/mr009428
The HAPPY VALLEY Mine map was published in 1970 at 1:100 000 as part of the 1:100 000 series to administer permit and permit related spatial information. The map was maintained internally as a provisional office chart and is located within the Happy Valley (9547) 1:100 000 map area. The map product is available to all government agencies, industry and the public for reference. Title and Image reference number is HAPPY VALLEY_9841.
Cleanskin, colour. Maryborough Warden.
- d
ADMMR mining collection file: Happy Jack
- datadiscoverystudio.org
pdfUpdated Jul 31, 2013ShareFacebookTwitterEmailClick to copy linkLink copiedCiteKen A. Phillips (2013). ADMMR mining collection file: Happy Jack [Dataset]. http://datadiscoverystudio.org/geoportal/rest/metadata/item/57cbeb0f4e7b424baef033357173335f/htmlpdfAvailable download formatsDataset updatedJul 31, 2013AuthorsKen A. PhillipsArea coveredDescriptionThis location is part of the Arizona Mineral Industry Location System (AzMILS), an inventory of mineral occurences, prospects and mine locations in Arizona. Maricopa563 is located in T6N R5E Sec 3 C in the Humboldt Mtn - 7.5 Min quad. This collection consists of various reports, maps, records and related materials acquired by the Arizona Department of Mines and Mineral Resources regarding mining properties in Arizona. Information was obtained by various means, including the property owners, exploration companies, consultants, verbal interviews, field visits, newspapers and publications. Some sections may be redacted for copyright. Please see the access statement.
Digital Geologic Map of the Happy Valley Quadrangle, Arizona (NPS, GRD, GRI,...
- datasets.ai
- datadiscoverystudio.org
- +1more
55, 57Updated Aug 25, 2024ShareFacebookTwitterEmailClick to copy linkLink copiedCiteDepartment of the Interior (2024). Digital Geologic Map of the Happy Valley Quadrangle, Arizona (NPS, GRD, GRI, SAGU) [Dataset]. https://datasets.ai/datasets/digital-geologic-map-of-the-happy-valley-quadrangle-arizona-nps-grd-gri-sagu57, 55Available download formatsDataset updatedAug 25, 2024AuthorsDepartment of the InteriorArea coveredArizonaDescriptionThe Digital Geologic Map of the Happy Valley Quadrangle, Arizona is composed of GIS data layers, two ancillary GIS tables, a Windows Help File with ancillary map text, figures and tables, GIS data layer and table FGDC metadata and ArcView 3.X legend (.AVL) files. The data were completed as a component of the Geologic Resources Inventory (GRI) program, a National Park Service (NPS) Inventory and Monitoring (I&M) funded program that is administered by the NPS Geologic Resources Division (GRD). All GIS and ancillary tables were produced as per the NPS GIS-Geology Coverage/Shapefile Data Model (available at: http://science.nature.nps.gov/im/inventory/geology/GeologyGISDataModel.cfm). The GIS data is available as coverage and table export (.E00) files, and as a shapefile (.SHP) and DBASEIV (.DBF) table files. The GIS data projection is NAD83, UTM Zone 12N. That data is within the area of interest of Saguaro National Park.
- u
Tactile Maps of Canada-Maps For Transportation And Tourism-City Approach...
- data.urbandatacentre.ca
- beta.data.urbandatacentre.ca
Updated Oct 1, 2024+ more versionsShareFacebookTwitterEmailClick to copy linkLink copiedCite(2024). Tactile Maps of Canada-Maps For Transportation And Tourism-City Approach Maps-Happy Valley - Goose Bay - Catalogue - Canadian Urban Data Catalogue (CUDC) [Dataset]. https://data.urbandatacentre.ca/dataset/gov-canada-6081d56e-8b0a-5909-be33-0b06fcdd7d92Dataset updatedOct 1, 2024LicenseOpen Government Licence - Canada 2.0https://open.canada.ca/en/open-government-licence-canada
License information was derived automaticallyArea coveredHappy Valley-Goose Bay, CanadaDescriptionThe map title is Happy Valley-Goose Bay. Tactile map scale. 2 centimetres = 3 kilometres North arrow pointing to the north. Happy Valley-Goose Bay and surrounding area. Goose Bay is shown with a wavy symbol to indicate water. The Churchill River, shown with a wavy symbol to indicate water, flows left to right into Goose Bay. Main road, Trans Labrador Highway. A circle with the shape of an airplane in it indicates Goose Bay Airport to the west of the city. Tactile maps are designed with Braille, large text, and raised features for visually impaired and low vision users. The Tactile Maps of Canada collection includes: (a) Maps for Education: tactile maps showing the general geography of Canada, including the Tactile Atlas of Canada (maps of the provinces and territories showing political boundaries, lakes, rivers and major cities), and the Thematic Tactile Atlas of Canada (maps showing climatic regions, relief, forest types, physiographic regions, rock types, soil types, and vegetation). (b) Maps for Mobility: to help visually impaired persons navigate spaces and routes in major cities by providing information about streets, buildings and other features of a travel route in the downtown area of a city. (c) Maps for Transportation and Tourism: to assist visually impaired persons in planning travel to new destinations in Canada, showing how to get to a city, and streets in the downtown area.
- g
Patterned-Ground 10 x 10 m Grids - Happy Valley - Datasets - Alaska Arctic...
- arcticatlas.geobotany.org
Updated Nov 24, 2020+ more versionsShareFacebookTwitterEmailClick to copy linkLink copiedCite(2020). Patterned-Ground 10 x 10 m Grids - Happy Valley - Datasets - Alaska Arctic Geoecological Atlas [Dataset]. https://arcticatlas.geobotany.org/catalog/dataset/patterned-ground-10-x-10-m-grids-happy-valleyDataset updatedNov 24, 2020LicenseAttribution 4.0 (CC BY 4.0)https://creativecommons.org/licenses/by/4.0/
License information was derived automaticallyArea coveredAlaska, Arctic, Arctic AlaskaDescriptionThe Happy Valley patterned-ground grids are located in Subzone E, the warmest part of the Arctic, in the foothills of the Brooks Range, just west of the Sagavanirktok River and the Dalton Highway. There are three 10 x 10-m grids along a hill slope, one on the crest of the hill (dry), one on the mid-slope (mesic), and one on the toe slope (wet). All three have tussock-sedge, erect dwarf-shrub, moss vegetation. Back to: Patterned-Ground 10 x 10 m Grids (Raynolds et al. 2005) Go to Website :: Biocomplexity of Frost Boil Ecosystems below for more information. Links to Biocomplexity of Patterned Ground Locations Happy Valley, Sagwon, Franklin Bluffs, Deadhorse, West Dock, Howe Island Map Themes: Vegetation, thaw depth, snow depth, NDVI References Raynolds, M. K., D. A. Walker, and H. A. Maier. 2005. Plant community-level mapping of arctic Alaska based on the Circumpolar Arctic Vegetation Map. Phytocoenologia 35:821-848. doi 10.1127/0340-269X/2005/0035-0821
- d
ADMMR mining collection file: Happy Jack
- datadiscoverystudio.org
pdfUpdated Jul 31, 2013ShareFacebookTwitterEmailClick to copy linkLink copiedCiteAnthony Lane; Michael N. Greeley; Ken A. Phillips (2013). ADMMR mining collection file: Happy Jack [Dataset]. http://datadiscoverystudio.org/geoportal/rest/metadata/item/052fca04508944299ec37afeea071769/htmlpdfAvailable download formatsDataset updatedJul 31, 2013AuthorsAnthony Lane; Michael N. Greeley; Ken A. PhillipsArea coveredDescriptionThis location is part of the Arizona Mineral Industry Location System (AzMILS), an inventory of mineral occurences, prospects and mine locations in Arizona. Pima843 is located in T12S R8E Sec 25 SE in the Silver Bell Peak - 15 Min quad. This collection consists of various reports, maps, records and related materials acquired by the Arizona Department of Mines and Mineral Resources regarding mining properties in Arizona. Information was obtained by various means, including the property owners, exploration companies, consultants, verbal interviews, field visits, newspapers and publications. Some sections may be redacted for copyright. Please see the access statement.
- n
Happy Valley Patterned-Ground 10 x 10 m Grids - Dataset - iAOS Portal
- portal-intaros.nersc.no
Updated Sep 16, 2020ShareFacebookTwitterEmailClick to copy linkLink copiedCite(2020). Happy Valley Patterned-Ground 10 x 10 m Grids - Dataset - iAOS Portal [Dataset]. https://portal-intaros.nersc.no/dataset/happy-valley-patterned-ground-10-x-10-m-gridsDataset updatedSep 16, 2020LicenseAttribution 4.0 (CC BY 4.0)https://creativecommons.org/licenses/by/4.0/
License information was derived automaticallyDescriptionThe Happy Valley patterned-ground grids are located in Subzone E, the warmest part of the Arctic, in the foothills of the Brooks Range, just west of the Sagavanirktok River and the Dalton Highway. There are three 10 x 10-m grids along a hill slope, one on the crest of the hill (dry), one on the mid-slope (mesic), and one on the toe slope (wet). All three have tussock-sedge, erect dwarf-shrub, moss vegetation. Back to: Patterned-Ground 10 x 10 m Grids (Raynolds et al. 2005) Go to Website :: Project Site below for more information. Links to Biocomplexity of Patterned Ground Sites Happy Valley, Sagwon, Franklin Bluffs, Deadhorse, West Dock, Howe Island Map Themes: Vegetation, thaw depth, snow depth, NDVI References Raynolds, M. K., D. A. Walker, and H. A. Maier. 2005. Plant community-level mapping of arctic Alaska based on the Circumpolar Arctic Vegetation Map. Phytocoenologia 35:821-848. doi 10.1127/0340-269X/2005/0035-0821
- d
USGS US Topo 7.5-minute map for Happy Camp, CA 2012
- datadiscoverystudio.org
geopdfUpdated Mar 23, 2012ShareFacebookTwitterEmailClick to copy linkLink copiedCiteU.S. Geological Survey (2012). USGS US Topo 7.5-minute map for Happy Camp, CA 2012 [Dataset]. http://datadiscoverystudio.org/geoportal/rest/metadata/item/625210b406fe4d49b6c14b38e8e067d4/htmlgeopdf(24.48922)Available download formatsDataset updatedMar 23, 2012Area coveredDescriptionLayered GeoPDF 7.5 Minute Quadrangle Map. Layers of geospatial data include orthoimagery, roads, grids, geographic names, elevation contours, hydrography, and other selected map features.
- c
Boundary
- cacgeoportal.com
- share-open-data-crawfordcountypa.opendata.arcgis.com
Updated Aug 9, 2019+ more versionsShareFacebookTwitterEmailClick to copy linkLink copiedCiteArcGIS Maps for the Nation (2019). Boundary [Dataset]. https://www.cacgeoportal.com/datasets/nation::boundaryDataset updatedAug 9, 2019Dataset authored and provided byArcGIS Maps for the NationArea coveredDescriptionThis basemap was designed with the Vizzuality team for use in the Half-Earth Project globe. The saturated palette and rich landcover tones are meant to engage an audience and to provide the sense that the earth is a charming and beautiful place worthy of thoughtful stewardship. As you zoom in, the saturated basemap is slowly replaced by imagery.This basemap is the major component of the Vibrant Map. The Vibrant Map is configured to use these basemap tiles from global to regional extents, then transition to Esri's World Imagery basemap tiles for a seamless transition from small to large scale.Find more information about this basemap, and its contributing data, here: https://www.esri.com/arcgis-blog/products/arcgis-pro/mapping/creating-the-half-earth-vibrant-basemap/Learn more about the Half-Earth Project here and explore highlighted areas of biodiversity here.Happy Mapping! John
- O
Happy Valley 1:100000 Geology Map Compilation 2018
- data.qld.gov.au
Updated May 9, 2023+ more versionsShareFacebookTwitterEmailClick to copy linkLink copiedCiteGeological Survey of Queensland (2023). Happy Valley 1:100000 Geology Map Compilation 2018 [Dataset]. https://www.data.qld.gov.au/dataset/mr002388Dataset updatedMay 9, 2023Dataset authored and provided byGeological Survey of QueenslandLicenseAttribution 4.0 (CC BY 4.0)https://creativecommons.org/licenses/by/4.0/
License information was derived automaticallyDescriptionURL: https://geoscience.data.qld.gov.au/dataset/mr002388
The Happy Valley series map was compiled in 2018 at 1:100 000 as part of the Geological 1:100 000 Compilation series to provide an interpretation of known basement geology information. The map product is available to all government agencies, industry and the public for reference and is located within the Happy Valley (9547) 1:100 000 map area.
- f
Comparison of BAP mapping and conventional HAPPY mapping.
- plos.figshare.com
xlsUpdated Jun 3, 2023ShareFacebookTwitterEmailClick to copy linkLink copiedCiteGiang T. H. Vu; Paul H. Dear; Peter D. S. Caligari; Mike J. Wilkinson (2023). Comparison of BAP mapping and conventional HAPPY mapping. [Dataset]. http://doi.org/10.1371/journal.pone.0009089.t001xlsAvailable download formatsUnique identifierhttps://doi.org/10.1371/journal.pone.0009089.t001Dataset updatedJun 3, 2023Dataset provided byPLOS ONEAuthorsGiang T. H. Vu; Paul H. Dear; Peter D. S. Caligari; Mike J. WilkinsonLicenseAttribution 4.0 (CC BY 4.0)https://creativecommons.org/licenses/by/4.0/
License information was derived automaticallyDescriptionComparison of BAP mapping and conventional HAPPY mapping.
- d
Shoreline Mapping Program of Mississippi River, Bohemia to Happy Jack, LA,...
- catalog.data.gov
Updated Oct 31, 2024+ more versionsShareFacebookTwitterEmailClick to copy linkLink copiedCiteNGS Communications and Outreach Branch (Point of Contact, Custodian) (2024). Shoreline Mapping Program of Mississippi River, Bohemia to Happy Jack, LA, LA1605-CM-T [Dataset]. https://catalog.data.gov/dataset/shoreline-mapping-program-of-mississippi-river-bohemia-to-happy-jack-la-la1605-cm-t1Dataset updatedOct 31, 2024Dataset provided byNGS Communications and Outreach Branch (Point of Contact, Custodian)Area coveredMississippi River, Happy JackDescriptionThese data provide an accurate high-resolution shoreline compiled from imagery of Mississippi River, Bohemia to Happy Jack, LA . This vector shoreline data is based on an office interpretation of imagery that may be suitable as a geographic information system (GIS) data layer. This metadata describes information for both the line and point shapefiles. The NGS attribution scheme 'Coastal Cartographic Object Attribute Source Table (C-COAST)' was developed to conform the attribution of various sources of shoreline data into one attribution catalog. C-COAST is not a recognized standard, but was influenced by the International Hydrographic Organization's S-57 Object-Attribute standard so the data would be more accurately translated into S-57. This resource is a member of https://www.fisheries.noaa.gov/inport/item/39808
FacebookTwitterTransportation Happiness Map
About this itemThe Minneapolis-St. Paul Transportation Happiness Map illustrates spatiotemporal differences in travelers’ happiness ratings on the streets and roads in the Minneapolis-St. Paul metropolitan region. The data powering the map was collected using the Daynamica smartphone application, which is developed by University of Minnesota researchers. The map makes self-reported emotional experience data easily accessible through visualization. Users can select among 10 travel mode options, 7 time options, 8 emotion options, and two statistic options to visualize patterns of transportation happiness.Author/ContributorYingling FanOrganizationUniversity of MinnesotaOrg Websitewww.hhh.umn.edu