- U
Recorded Crime Summary Data for London: Ward Level
- data.ubdc.ac.uk
csvUpdated Nov 9, 2023+ more versions Share
Share Facebook
 Twitter
 EmailClick to copy linkLink copiedCiteGreater London Authority (2023). Recorded Crime Summary Data for London: Ward Level [Dataset]. https://data.ubdc.ac.uk/dataset/recorded-crime-summary-data-london-ward-levelcsvAvailable download formatsDataset updatedNov 9, 2023Dataset provided byGreater London AuthorityDescription
Part of Release: Official Sub-Ward, Ward and Borough level crime counts.
Choose from the three data sets (‘Sub-Ward data’, ‘Ward data’ or ‘Borough data’) according to your requirements.
This page contains the ward level data file
Click here for corresponding LSOA level data: Recorded Crime Summary Data for London: LSOA Level
Click here for corresponding Borough level data: Recorded Crime Summary Data for London: Borough Level
Choose from the three data sets (‘Sub-Ward data’, ‘Ward data’ or ‘Borough data’) according to your requirements.
‘Sub-Ward data’ counts the number of crimes in each sub ward area of London (Census Lower Super Output Area or LSOA) per month according to crime type. Use this data if you need to analyse crime data at a sub ward level. Because not all crimes can be matched to a specific LSOA area, you should not use this data set to count crimes by ward or borough. For these purposes use one of the other datasets according to the level of geographic precision you need.
‘Ward data’ counts the number of crimes in each ward area of London per month, according to crime type. Use this data if you need to analyse crime data according to the location of geographic wards. Because not all crimes can be matched to a ward area, you should not use this data set to count crimes by borough. For this purpose use one of the Borough level dataset provided.
‘Borough data’ counts the number of crimes in each borough area of London per month, according to crime type.
Each of the data sets will contain the latest two years of data available. The categories of crime counts within them may change from time to time. Below is a list of the crime types you can currently extract (*only at borough or ward level):
**Minor Category: Major Category **
Murder: ViolenceAgainstThePerson
CommonAssault: ViolenceAgainstThePerson
OffensiveWeapon: ViolenceAgainstThePerson
Harassment: ViolenceAgainstThePerson
Otherviolence: ViolenceAgainstThePerson
AssaultWithInjury: ViolenceAgainstThePerson
WoundingGBH: ViolenceAgainstThePerson
*Rape: SexualOffences
*OtherSexual: SexualOffences
PersonalProperty: Robbery
BusinessProperty: Robbery
BurglaryInADwelling: Burglary
BurglaryInOtherBuildings: Burglary
TheftOrTakingOfMotor: TheftAndHandling
TheftFromMotor: TheftAndHandling
MotorInterferenceAndTampering: TheftAndHandling
TheftFromShops: TheftAndHandling
TheftOrTakingOfPedalCycles: TheftAndHandling
OtherTheftPerson: TheftAndHandling
OtherTheft: TheftAndHandling
HandlingStolenGoods: TheftAndHandling
*CountedPerVictim: FraudOrForgery
*OtherFraudAndForgery: FraudOrForgery
CriminalDamageToADwelling: CriminalDamage
CriminalDamageToOtherBldg: CriminalDamage
CriminalDamageToMotor: CriminalDamage
OtherCriminalDamage: CriminalDamage
DrugTrafficking: Drugs
PossessionOfDrugs: Drugs
OtherDrugOffences: Drugs
GoingEquipped: OtherNotifiableOffences
OtherNotifiable: OtherNotifiableOffences
**Each row of data in the data sets contains: **
*The number of incidents according to the Month Recorded, the specific crime type, and the Location
*The Month Recorded
*The broad crime type (Major HO category – eg Robbery)
*The specific crime type (Minor HO category – eg Robbery: Personal Property)
*The Location (Sub –Ward, Ward or borough depending on the data set selected)
Data from: London Ward Well-Being Scores
- data.ubdc.ac.uk
- cloud.csiss.gmu.edu
xlsUpdated Nov 8, 2023+ more versionsShareFacebookTwitterEmailClick to copy linkLink copiedCiteGreater London Authority (2023). London Ward Well-Being Scores [Dataset]. https://data.ubdc.ac.uk/dataset/london-ward-well-being-scoresxlsAvailable download formatsDataset updatedNov 8, 2023Dataset provided byGreater Londonhttp://london.gov.uk/
Greater London Authorityhttp://www.london.gov.uk/DescriptionThese ward level well being scores present a combined measure of well-being indicators of the resident population based on 12 different indicators. Where possible each indicator score is compared with the England and Wales average, which is zero. Scores over 0 indicate a higher probability that the population on average will experience better well-being according to these measures.
Users can adjust the weight of each indicator depending on what they consider to be the more or less important, thus generating bespoke scores. This is done either by entering a number between 0 and 10 in the importance row or by moving the slider (each indicator is set to 10 by default). The scores throughout the spreadsheet will update automatically.
The tool combines data across a range of themes for the last five years of available data (2008-2012).
The well-being scores are then presented in a bar chart for each borough, and a map of London.
The spreadsheet highlights wards in the top and bottom 25 per cent in London. Wards that have shown significant improvement or reduction in their scores relative to the average over the five year period are also highlighted.
Borough figures are also provided underneath to assist with comparisons.
Rankings and summary tables are included. The data that the tool is based on is included in the spreadsheet.
https://s3-eu-west-1.amazonaws.com/londondatastore-upload/wellbeing-screen.PNG" alt="well-being risk scores">
This file is 7.9MB.
IMPORTANT NOTE, users must enable macros when prompted upon opening the Excel spreadsheet (or reset security to medium/low) for the map to function. The rest of the tool will function without macros.
If you cannot download the Excel file directly try this zip file (2.5MB).
If you experience any difficulties with downloading this spreadsheet, please contact Gareth Piggott in the Intelligence Unit.
Detailed information about definitions and sources is contained within the spreadsheet.
The 12 measures included are:
Health
- Life Expectancy
- Incapacity Benefits claimant rateEconomic security
- Unemployment rate
- Income Support claimant rateSafety
- Crime rate
- Deliberate FiresEducation
- GCSE point scoresChildren
- Unauthorised Pupil AbsenceFamilies
- Children in out-of-work householdsTransport
- Public Transport Accessibility Scores (PTALs)Environment
- Access to public open space & natureHappiness
- Composite Subjective Well-being Score (Life Satisfaction, Worthwhileness, Anxiety, and Happiness) (New data only available since 2011/12)With some measures if the data shows a high figure that indicates better well-being, and with other measures a low figure indicates better well-being. Therefore scores for Life Expectancy, GCSE scores, PTALs, and Access to Public Open Space/Nature have been reversed so that in all measures low scores indicate probable lower well-being.
The data has been turned into scores where each indicator in each year has a standard deviation of 10. This means that each indicator will have an equal effect on the final score when the weightings are set to equal.
Why should measuring well-being be important to policy makers?
Following research by the Cabinet Office and Office for National Statistics, the government is aiming to develop policy that is more focused on ‘all those things that make life worthwhile’ (David Cameron, November 2010). They are interested in developing new and better ways to understand how policy and public services affect well-being.Why measure well-being for local areas?
It is important for London policy makers to consider well-being at a local level (smaller than borough level) because of the often huge differences within boroughs. Local authorities rely on small area data in order to target resources, and with local authorities currently gaining more responsibilities from government, this is of increasing importance. But small area data is also of interest to academics, independent analysts and members of the public with an interest in the subject of well-being.How can well-being be measured within small areas?
The Office for National Statistics have been developing new measures of national well-being, and as part of this, at a national and regional level, the ONS has published some subjective data to measure happiness. ONS have not measured well-being for small areas, so this tool has been designed to fill this gap. However, DCLG have published a tool that models life satisfaction data for LSOAs based on a combination of national level happiness data, and 'ACORN' data. Happiness data is not available for small areas because there are no surveys large enough for this level of detail, and so at this geography the focus is on objective indicators. Data availability for small areas is far more limited than for districts, and this means the indicators that the scores are based on are not all perfect measures of well-being, though they are the best available. However, by using a relatively high number of measures across a number of years, this increases the reliability of the well-being scores.How can this tool be used to help policy makers?
Each neighbourhood will have its own priorities, but the data in this tool could help provide a solid evidence base for informed local policy-making, and the distribution of regeneration funds. In addition, it could assist users to identify the causes behind an improvement in well-being in certain wards, where examples of good practice could be applied elsewhere.**Differences to the previous report
**This is the 2013 edition of this publication, and there is one change from 2012. Indicators of Election turnout has been replaced with a composite score of subjective well-being indicators.
Past versions are still available for 2011 and 2012. The rationale/methodology paper from 2011 is here. The scores from the 2012 spreadsheet are also available in PDF format. The scores in Intelligence Update 21-2012 are based on equal weightings across each measure.
This tool was created by the GLA Intelligence Unit. Please contact datastore@london.gov.uk for more information.
- o
Electoral Wards/Divisions - United Kingdom
- smartregionidf.outscale-euw2.opendatasoft.com
- data.smartidf.services
- +1more
csv, excel, geojson +1Updated Jan 16, 2024+ more versionsShareFacebookTwitterEmailClick to copy linkLink copiedCite(2024). Electoral Wards/Divisions - United Kingdom [Dataset]. https://smartregionidf.outscale-euw2.opendatasoft.com/explore/dataset/georef-united-kingdom-ward-electoral-division/?flg=frcsv, excel, geojson, jsonAvailable download formatsDataset updatedJan 16, 2024LicenseOpen Government Licence 3.0http://www.nationalarchives.gov.uk/doc/open-government-licence/version/3/
License information was derived automaticallyArea coveredUnited KingdomDescriptionThis dataset is part of the Geographical repository maintained by Opendatasoft. This dataset contains data for wards/electoral divisions in the United Kingdom.Electoral wards (and electoral divisions) are the key building blocks of UK administrative geography. They are the spatial units used to elect local government councillors in metropolitan and non-metropolitan districts, UAs and the London boroughs in England; UAs in Wales; council areas in Scotland; and local government districts (LGD) in Northern Ireland. Electoral wards are found in Scotland, Wales, Northern Ireland and most of England. In the Isle of Wight and several of the UAs created as part of the Local Government Reorganisation in 2009, the equivalent areas are legally termed 'electoral divisions', although they are frequently referred to as wards. Wales changed to using the term 'electoral wards' instead of 'electoral divisions' in August 2013.The only part of the UK without electoral wards/divisions is the Isles of Scilly, which has its own council but no electoral zoning. For statistical purposes, however, ONS treats the islands' five parishes as electoral wards. Electoral wards/divisions (and the Scilly parishes) cover the whole of the UK; in addition, all higher administrative units are built from whole electoral wards/divisions. They are also used to constitute a range of other geographies such as the Eurostat Nomenclature of Territorial Units for Statistics (NUTS) geographies, health geographies and Westminster parliamentary constituencies. Electoral ward/division boundary changes are usually enacted on the first Thursday in May each year, to coincide with the local government elections.Processors and tools are using this data.EnhancementsAdd ISO 3166-3 codes.Simplify geometries to provide better performance across the services.Add administrative hierarchy.
Council Elections candidate results by ward, 2006
- data.ubdc.ac.uk
- gimi9.com
- +2more
csv, pdf, xlsUpdated Nov 8, 2023ShareFacebookTwitterEmailClick to copy linkLink copiedCiteGreater London Authority (2023). Council Elections candidate results by ward, 2006 [Dataset]. https://data.ubdc.ac.uk/dataset/groups/council-elections-candidate-results-ward-2006xls, csv, pdfAvailable download formatsDataset updatedNov 8, 2023DescriptionVoting statistics for the local elections in 2006, includes data on each candidate.
Data on turnout can also be accessed via the Excel spreadsheet.
More borough level data from this election can be found here.
The full 2006 report can be read here:
https://s3-eu-west-1.amazonaws.com/londondatastore-upload/london-borough-council-elections-2006.jpg" alt="">
https://s3-eu-west-1.amazonaws.com/londondatastore-upload/London-Borough-Council-Elections-2006.pdf
This report gives a detailed breakdown of election facts and figures, including results, full ward voting statistics, a list of all candidates, and a number of maps. This is the latest in a series of publications on London elections dating back to 1964.
Turnout statistics (CSV format)
- U
2011 Census Geography boundaries (Wards and Electoral Divisions)
- statistics.ukdataservice.ac.uk
zipUpdated Sep 20, 2022ShareFacebookTwitterEmailClick to copy linkLink copiedCiteBoundary (2022). 2011 Census Geography boundaries (Wards and Electoral Divisions) [Dataset]. https://statistics.ukdataservice.ac.uk/dataset/2011-census-geography-boundaries-wards-and-electoral-divisionszip(174707448), zip(338655660), zip(129161006), zip(328588), zip(125375563), zip(279347), zip(172098761), zip(328269596)Available download formatsDataset updatedSep 20, 2022Dataset provided byBoundaryLicensehttp://reference.data.gov.uk/id/open-government-licencehttp://reference.data.gov.uk/id/open-government-licence
DescriptionElectoral Wards/Divisions are the key building blocks of UK administrative geography. They are the spatial units used to elect local government councillors in metropolitan and non-metropolitan districts, unitary authorities and the London boroughs in England; unitary authorities in Wales; council areas in Scotland; and district council areas in Northern Ireland.
The Wards and Electoral Divisions list contains 9,481 areas of the following constituent geographies:
- 7,218 Census Wards in England
- 453 Census Electoral Divisions in England
- 7 Census Merged Wards in England
- 582 Census Wards in Northern Ireland
- 353 Census Wards in Scotland
- 856 Census Electoral Divisions in Wales
- 12 Census Merged Wards in Wales
Please visit ONS Beginner's Guide to UK Geography for more info.
The boundaries are available as either extent of the realm (usually this is the Mean Low Water mark but in some cases boundaries extend beyond this to include off shore islands) or
clipped to the coastline (Mean High Water mark).
Ward-level population estimates (official statistics in development)
- ons.gov.uk
- cy.ons.gov.uk
xlsxUpdated Mar 19, 2024+ more versionsShareFacebookTwitterEmailClick to copy linkLink copiedCiteOffice for National Statistics (2024). Ward-level population estimates (official statistics in development) [Dataset]. https://www.ons.gov.uk/peoplepopulationandcommunity/populationandmigration/populationestimates/datasets/wardlevelmidyearpopulationestimatesexperimentalxlsxAvailable download formatsDataset updatedMar 19, 2024LicenseOpen Government Licence 3.0http://www.nationalarchives.gov.uk/doc/open-government-licence/version/3/
License information was derived automaticallyDescriptionMid-year (30 June) estimates of the usual resident population for electoral wards in England and Wales.
- U
Ward Profiles and Atlas
- data.ubdc.ac.uk
csv, xlsUpdated Nov 8, 2023+ more versionsShareFacebookTwitterEmailClick to copy linkLink copiedCiteGreater London Authority (2023). Ward Profiles and Atlas [Dataset]. https://data.ubdc.ac.uk/dataset/ward-profiles-and-atlasxls, csvAvailable download formatsDataset updatedNov 8, 2023Dataset provided byGreater London AuthorityDescriptionThe ward profiles and ward atlas provide a range of demographic and related data for each ward in Greater London. They are designed to provide an overview of the population in these small areas by presenting a range of data on the population, diversity, households, life expectancy, housing, crime, benefits, land use, deprivation, and employment.
Indicators included here are population by age and sex, land area, projections, population density, household composition, religion, ethnicity, birth rates (general fertility rate), death rates (standardised mortality ratio), life expectancy, average house prices, properties sold, housing by council tax band, tenure, mortgage and landlord home repossession, employment and economic activity, Incapacity Benefit, Income Support and JobSeekers Allowance claimant rates, dependent children receiving child-tax credits by lone parents and out-of-work families, National Insurance Number registration rates for overseas nationals (NINo), GCSE results, pupil absence, crime rates (by type of crime), fires, ambulance call outs, road casualties, happiness and well-being, land use, access to public transport (PTALs), access to public greenspace, access to nature, air emissions / quality, car use, bicycle travel, Indices of Deprivation, and election turnout.
The **Ward Profiles **present key summary measures for the most recent year, using both Excel and InstantAtlas mapping software. This is a useful tool for displaying a large amount of data for numerous geographies, in one place.
The Ward Atlas presents a more detailed version of the data including trend data and generally includes the raw numbers as opposed to percentages or rates.
The Instant Atlas reports use HTML5 technology, which can be used in modern browsers, including on Apple machines, but will not function on older browsers.
WARD PROFILES
Compare the ward measure against the Borough, London and National average.

WARD ATLAS
Access the raw data for all London wards.

Tips:
- - Select a new indicator from the Data box on the left. Select the theme, then indicator and then year to show the data.
- To view data just for one borough*, use the filter tool.
- The legend settings can be altered by clicking on the pencil icon next to the Wards tick box within the map legend.
- The wards can be ranked in order by clicking at the top of the indicator column of the data table.
Note: Additional indicator information and sources are included within the spreadsheet and Instant Atlas report.
OTHER SMALL AREA PROFILES
Other profiles available include LSOA and MSOA atlases.
Data from these profiles were used to create the Well-being scores tool.
- The London boroughs are: City of London, Barking and Dagenham, Barnet, Bexley, Brent, Bromley, Camden, Croydon, Ealing, Enfield, Greenwich, Hackney, Hammersmith and Fulham, Haringey, Harrow, Havering, Hillingdon, Hounslow, Islington, Kensington and Chelsea, Kingston upon Thames, Lambeth, Lewisham, Merton, Newham, Redbridge, Richmond upon Thames, Southwark, Sutton, Tower Hamlets, Waltham Forest, Wandsworth, Westminster.
These profiles were created using the most up to date information available at the time of collection (February 2014).
Borough Council Election Results 2010
- data.ubdc.ac.uk
- gimi9.com
- +2more
csv, pdf, xlsUpdated Nov 8, 2023ShareFacebookTwitterEmailClick to copy linkLink copiedCiteGreater London Authority (2023). Borough Council Election Results 2010 [Dataset]. https://data.ubdc.ac.uk/dataset/borough-council-election-results-2010xls, pdf, csvAvailable download formatsDataset updatedNov 8, 2023Dataset provided byGreater London Authorityhttp://www.london.gov.uk/
Greater Londonhttp://london.gov.uk/DescriptionLondon Borough Council Elections - 6 May 2010
**
https://s3-eu-west-1.amazonaws.com/londondatastore-upload/boro-elections-2010-cover.png" alt="REPORT">**
With the aim of making the democratic process as transparent as possible to the London electorate, this report includes a great deal of detail on every aspect of the 2010 London Borough council general elections. No other single volume presents the full results and election statistics from the 32 London boroughs enabling the reader to analyse and compare the results across London in one place.
The report presents data for every candidate in every ward (excluding the City of London which operates on a different electoral model). Summaries are provided in the form of maps and tables, and to make comparisons easier, they mostly match those included in the 2006 report with a few useful additions.
Results of all council by-elections between the general elections in 2006 and 2010, as well as details of the elections in the three boroughs that directly elect a mayor, are also presented here. This is the latest report in a long series of council election reports dating back to 1964. Find other election reports at http://data.london.gov.uk/elections/
REPORT:
The report is available in PDF format.
Hard copies are available from the Intelligence Unit for £20. Please contact intelligence@london.gov.uk or tel 020 7983 4922 (credit card or cheque accepted).
https://s3-eu-west-1.amazonaws.com/londondatastore-upload/lbce-excel-thumb.png" alt="DATA">
DATA:
All the data contained within the 'London Borough Council Elections 2010' report can be accessed in this spreadsheet. This contains results for each candidate standing in all 624 wards in the London boroughs (excluding the City of London which operates on a different electoral model).
Also available in the following spreadsheets:
● Full results for every ward and every candidate from 2006 and 2010
● A summary of the number of seats won by each party by borough including political control.
● Ward and borough turnout data.
MOTION CHART:
https://s3-eu-west-1.amazonaws.com/londondatastore-upload/elections-motion-thumb.png" alt="CHART">
This motion chart shows the relationship, between share of votes and seats won by the major parties in elections since 1964 at borough level (requires Adobe Flash Player).
MAP:
 )
)These interactive ward maps help to geographically present election results from 2006 and 2010 and display results for each candidate (requires Adobe Flash Player).
Data for the elections in the three boroughs that directly elect a mayor (Newham, Lewisham and Hackney) are not included in the map but are included in the Excel spreadsheet of results.
Note 15/3/2013: A summary of local by-election results since the elections in May 2010 can be found here. This file will be periodically updated.
- U
Borough Council Election Results 2014
- data.ubdc.ac.uk
- data.europa.eu
pdf, xlsUpdated Nov 8, 2023+ more versionsShareFacebookTwitterEmailClick to copy linkLink copiedCiteGreater London Authority (2023). Borough Council Election Results 2014 [Dataset]. https://data.ubdc.ac.uk/dataset/borough-council-election-results-2014xls, pdfAvailable download formatsDataset updatedNov 8, 2023Dataset provided byGreater London AuthorityDescription
This report includes a great deal of detail on every aspect of the 2014 London Borough council general elections. No other single volume presents the full results and election statistics from the 32 London boroughs enabling the reader to analyse and compare the results across London in one place. The report presents data for every candidate in every ward (excluding the City of London which operates on a different electoral model). The report also contains analysis of the European election results for London that took place on the same day.
Printed Copies
After much discussion, we are now able to accept orders for hard copies £30, but please note there is a minimum number of orders we must receive before it can be sent to print. Click here for further details.
Details of all previous elections reports in the series can be found here.
Summary results of the 2014 local elections in London, showing number and percentage of seats won, turnout and political control.
Final 2014 ward results
These results show the number of votes for each candidate in each ward in London. Turnout, number of ballots, postal votes, and breakdown of rejected votes, Mayoral and European voting figures are also included where available.
Map showing political control in each ward.
https://londondatastore-upload.s3.amazonaws.com/images/London-ward-map-borough-election-2014-new-colours-small.png" alt="">
Also, using these ward results, Oliver O'Brien from CASA has created some eye catching interactive ward maps.
The borough map shows the summary results in both the 2010 and 2014 elections.
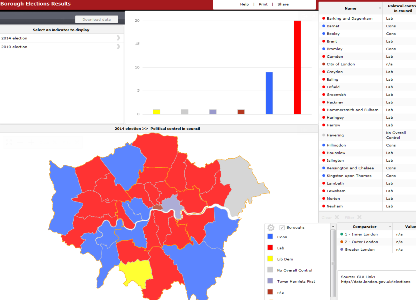
The ward interactive map shows the detailed results for each candidate at ward level for the last three elections between 2006 and 2014.

This motion chart shows the relationship, between share of votes and seats won by the major parties in elections since 1964 at borough level (requires Adobe Flash Player).
 )
) - g
Recorded Crime Summary Data for Barnet: Ward Level
- gimi9.com
- data.europa.eu
Updated Jan 18, 2013ShareFacebookTwitterEmailClick to copy linkLink copiedCite(2013). Recorded Crime Summary Data for Barnet: Ward Level [Dataset]. https://gimi9.com/dataset/uk_recorded-crime-summary-data-for-barnet-ward-levelDataset updatedJan 18, 2013LicenseOpen Government Licence 3.0http://www.nationalarchives.gov.uk/doc/open-government-licence/version/3/
License information was derived automaticallyArea coveredBarnetDescriptionExtract from GLA Release: Official Sub-Ward, Ward and Borough level crime counts. This page contains the ward level data file for London Borough of Barnet Click here for corresponding LSOA level data: Recorded Crime Summary Data for London: LSOA Level Click here for corresponding Borough level data: Recorded Crime Summary Data for London: Borough Level ‘Ward data’ counts the number of crimes in each ward area of London Borough of Barnet per month, according to crime type. Use this data if you need to analyse crime data according to the location of geographic wards. Because not all crimes can be matched to a ward area, you should not use this data set to count crimes by borough. For this purpose use the Borough level dataset linked to above. ‘Borough data’ counts the number of crimes in each borough area of London per month, according to crime type. Each of the data sets will contain the latest two years of data available. The categories of crime counts within them may change from time to time. Below is a list of the crime types you can currently extract (*only at borough or ward level): Minor Category: Major Category Murder: ViolenceAgainstThePerson CommonAssault: ViolenceAgainstThePerson OffensiveWeapon: ViolenceAgainstThePerson Harassment: ViolenceAgainstThePerson Otherviolence: ViolenceAgainstThePerson AssaultWithInjury: ViolenceAgainstThePerson WoundingGBH: ViolenceAgainstThePerson *Rape: SexualOffences *OtherSexual: SexualOffences PersonalProperty: Robbery BusinessProperty: Robbery BurglaryInADwelling: Burglary BurglaryInOtherBuildings: Burglary TheftOrTakingOfMotor: TheftAndHandling TheftFromMotor: TheftAndHandling MotorInterferenceAndTampering: TheftAndHandling TheftFromShops: TheftAndHandling TheftOrTakingOfPedalCycles: TheftAndHandling OtherTheftPerson: TheftAndHandling OtherTheft: TheftAndHandling HandlingStolenGoods: TheftAndHandling *CountedPerVictim: FraudOrForgery *OtherFraudAndForgery: FraudOrForgery CriminalDamageToADwelling: CriminalDamage CriminalDamageToOtherBldg: CriminalDamage CriminalDamageToMotor: CriminalDamage OtherCriminalDamage: CriminalDamage DrugTrafficking: Drugs PossessionOfDrugs: Drugs OtherDrugOffences: Drugs GoingEquipped: OtherNotifiableOffences OtherNotifiable: OtherNotifiableOffences Each row of data in the data sets contains: *The number of incidents according to the Month Recorded, the specific crime type, and the Location *The Month Recorded *The broad crime type (Major HO category – eg Robbery) *The specific crime type (Minor HO category – eg Robbery: Personal Property) *The Location (Sub –Ward, Ward or borough depending on the data set selected)
- g
Greater London Authority - Ward Profiles and Atlas | gimi9.com
- gimi9.com
+ more versionsShareFacebookTwitterEmailClick to copy linkLink copiedCiteGreater London Authority - Ward Profiles and Atlas | gimi9.com [Dataset]. https://gimi9.com/dataset/london_ward-profiles-and-atlasDescriptionThe ward profiles and ward atlas provide a range of demographic and related data for each ward in Greater London. They are designed to provide an overview of the population in these small areas by presenting a range of data on the population, diversity, households, life expectancy, housing, crime, benefits, land use, deprivation, and employment. Indicators included here are population by age and sex, land area, projections, population density, household composition, religion, ethnicity, birth rates (general fertility rate), death rates (standardised mortality ratio), life expectancy, average house prices, properties sold, housing by council tax band, tenure, property size (bedrooms), dwelling build period and type, mortgage and landlord home repossession, employment and economic activity, Incapacity Benefit, Housing Benefit, Household income, Income Support and JobSeekers Allowance claimant rates, dependent children receiving child-tax credits by lone parents and out-of-work families, child poverty, National Insurance Number registration rates for overseas nationals (NINo), GCSE results, A-level / Level 3 results (average point scores), pupil absence, child obesity, crime rates (by type of crime), fires, ambulance call outs, road casualties, happiness and well-being, land use, public transport accessibility (PTALs), access to public greenspace, access to nature, air emissions / quality, car use, bicycle travel, Indices of Deprivation, and election turnout. The Ward Profiles present key summary measures for the most recent year, using both Excel and InstantAtlas mapping software. This is a useful tool for displaying a large amount of data for numerous geographies, in one place. The Ward Atlas presents a more detailed version of the data including trend data and generally includes the raw numbers as opposed to percentages or rates. The Instant Atlas reports use HTML5 technology, which can be used in modern browsers, including on Apple machines, but will not function on older browsers. WARD ATLAS FOR 2014 BOUNDARIES In May 2014, ward boundaries changed in Hackney, Kensington and Chelsea, and Tower Hamlets. This version of the ward atlas gives data for these new wards, as well as retaining data on the unchanged wards in the rest of London for comparison purposes. Data for boroughs has also been included. Very few datasets have been published for the new ward boundaries, so the majority of data contained in this atlas have been modelled using a method of proportion of households from the old boundaries that are located in the new boundaries. Therefore, the data contained in this atlas are indicative only. Instant Atlas for 2014 Ward Atlas Tips: Select a new indicator from the Data box on the left. Select the theme, then indicator and then year to show the data. To view data just for one borough*, use the filter tool. Some legend settings can be altered by clicking on the cog icon next to the Wards tick box within the map legend. The wards can be ranked in order by clicking at the top of the indicator column of the data table. Note: Additional indicator information and sources are included within the spreadsheet and Instant Atlas report. OTHER SMALL AREA PROFILES Other profiles available include Borough, LSOA and MSOA atlases. Data from these profiles were used to create the Well-being scores tool. *The London boroughs are: City of London, Barking and Dagenham, Barnet, Bexley, Brent, Bromley, Camden, Croydon, Ealing, Enfield, Greenwich, Hackney, Hammersmith and Fulham, Haringey, Harrow, Havering, Hillingdon, Hounslow, Islington, Kensington and Chelsea, Kingston upon Thames, Lambeth, Lewisham, Merton, Newham, Redbridge, Richmond upon Thames, Southwark, Sutton, Tower Hamlets, Waltham Forest, Wandsworth, Westminster. These profiles were created using the most up to date information available at the time of collection (September 2015).
Ward to Local Authority District (May 2024) Lookup in the UK
- geoportal.statistics.gov.uk
- hub.arcgis.com
Updated May 20, 2024+ more versionsShareFacebookTwitterEmailClick to copy linkLink copiedCiteOffice for National Statistics (2024). Ward to Local Authority District (May 2024) Lookup in the UK [Dataset]. https://geoportal.statistics.gov.uk/datasets/ons::ward-to-local-authority-district-may-2024-lookup-in-the-uk/aboutDataset updatedMay 20, 2024Licensehttps://www.ons.gov.uk/methodology/geography/licenceshttps://www.ons.gov.uk/methodology/geography/licences
Area coveredDescriptionThis is a lookup file between electoral wards/divisions and local authority districts in the United Kingdom as at 2nd May 2024. (File Size - 1.4 MB) Field Names - WD24CD, WD24NM, WD24NMW LAD24CD, LAD24NM, LAD24NMWField Types - Text, Text, Text, Text, Text, TextField Lengths - 9, 53, 45 9, 36, 24
- d
2001 Census Ward Profiles All Wards
- data.gov.uk
- data.europa.eu
pdfUpdated Aug 30, 2015ShareFacebookTwitterEmailClick to copy linkLink copiedCiteLondon Borough of Camden (2015). 2001 Census Ward Profiles All Wards [Dataset]. https://data.gov.uk/dataset/e5b53bc2-1c49-49ac-b5cf-01c709cf7bf3/2001-census-ward-profiles-all-wardspdfAvailable download formatsDataset updatedAug 30, 2015Dataset authored and provided byLondon Borough of CamdenLicensehttps://data.gov.uk/dataset/e5b53bc2-1c49-49ac-b5cf-01c709cf7bf3/2001-census-ward-profiles-all-wards#licence-infohttps://data.gov.uk/dataset/e5b53bc2-1c49-49ac-b5cf-01c709cf7bf3/2001-census-ward-profiles-all-wards#licence-info
Description2001 Census ward profile set for Camden's 18 electoral wards that were implemented in May 2002. Includes map, ward description, key statistics and charts.
- U
Office for National Statistics (ONS) Population Estimates, Borough and Ward
- data.ubdc.ac.uk
- data.wu.ac.at
csv, xlsUpdated Nov 8, 2023+ more versionsShareFacebookTwitterEmailClick to copy linkLink copiedCiteGreater London Authority (2023). Office for National Statistics (ONS) Population Estimates, Borough and Ward [Dataset]. https://data.ubdc.ac.uk/dataset/office-national-statistics-ons-population-estimates-boroughcsv, xlsAvailable download formatsDataset updatedNov 8, 2023Dataset provided byGreater London AuthorityDescriptionONS Mid-year estimates (MYE) of resident populations for London boroughs are available in the following files:
Read the GLA Intelligence Updates about the MYE data for 2011 and 2012.
Mid-year population by single year of age (SYA) and sex, for each year 1999 to 2013.
ONS mid-year estimates data back to 1961 total population for each year since 1961.
These files take into account the revised estimates released in 2010.
Ward level Population Estimates
London wards single year of age data covering each year since 2002.
Custom Age Range Tool
An Excel tool is available that uses Single year of age data that enables users to select any age range required.
ONS policy is to publish population estimates rounded to at least the nearest hundred persons. Estimates by single year of age, and the detailed components of change are provided in units to facilitate further calculations. They cannot be guaranteed to be as exact as the level of detail implied by unit figures.
Estimates are calculated by single year of age but these figures are less reliable and ONS advise that they should be aggregated to at least five-year age groupings for use in further calculations, onwards circulation, or for presentation purposes. (Splitting into 0 year olds and 1-4 year olds is an acceptable exception).
ONS mid-year population estimates data by 5 year age groups going all the way back to 1981, are available on the NOMIS website.
Data are Crown Copyright and users should include a source accreditation to ONS - Source: Office for National Statistics. Under the terms of the Open Government License (OGL) and UK Government Licensing Framework, anyone wishing to use or re-use ONS material, whether commercially or privately, may do so freely without a specific application. For further information, go to http://www.nationalarchives.gov.uk/doc/open-government-licence/ or phone 020 8876 3444.
For a detailed explanation of the methodology used in population estimates, see papers available on the Population Estimates section of the ONS website www.statistics.gsi.gov.uk/popest. Additional information can also be obtained from Population Estimates Customer Services at pop.info@ons.gsi.gov.uk (Tel: 01329 444661).
- a
UK Ward Canopy Cover
- data-forestry.opendata.arcgis.com
- find.data.gov.scot
- +2more
Updated Mar 30, 2023ShareFacebookTwitterEmailClick to copy linkLink copiedCitemapping.geodata_forestry (2023). UK Ward Canopy Cover [Dataset]. https://data-forestry.opendata.arcgis.com/datasets/ecba26cfaf9d4b61bddc0e3284348d79Dataset updatedMar 30, 2023Dataset authored and provided bymapping.geodata_forestryArea coveredDescriptionData were gathered through citizen science volunteers, who used the i-Tree Canopy tool (https://canopy.itreetools.org/) to assess percentage canopy cover within ward boundaries. A User Guide was provided to the volunteers, with step-by-step instructions and pictorial support (https://cdn.forestresearch.gov.uk/2018/11/canopy_cover_webmap_user_guide_-_updated_march_2021.pdf). i-Tree Canopy randomly distributes points within a study area (ward boundary), overlain on Google aerial imagery. Users examine the points in sequence to determine whether the point lies over a tree canopy or not, classifying each point as either “tree” or “non-tree” accordingly. Typically 350 to 600 points were assessed per ward, leading to a standard error of less than 2%. Percentage tree canopy cover was calculated as (n/N)*100 where n is the number of “tree” points and N is the total number of sample points. Results were returned to Forest Research in the form of percentage canopy cover, standard error, number of points, and the i-Tree Canopy project file. Data quality was monitored through screening of submitted results by Forest Research project staff for all new participants, and at regular intervals for experienced contributors. Most wards were assessed only once. Where a ward was assessed by more than one contributor, the results were combined where possible. Field Attributes;country [Country] The country within which the Ward is located as defined by the Ward code. [E050000xx = England; N08000xxx = Northern Ireland; S1300xxxx = Scotland; W050000xx = Wales] wardcode [Ward code] The unique code associated with the Ward boundary. Ward boundaries are based on OS Boundary-Line data (OS data © Crown copyright and database right 2017). Most Ward boundaries are from the 2017 OS Boundary-Line dataset. However, a few users returned boundaries from the 2018 OS Boundary-Line dataset; the dataset was amended to reflect which boundary was used in the i-Tree Canopy assessment. wardname [Ward name] The name of the Ward boundary. Ward boundaries are based on OS Boundary-Line data (OS data © Crown copyright and database right 2017). Most Ward boundaries are from the 2017 OS Boundary-Line dataset. However, a few users returned boundaries from the 2018 OS Boundary-Line dataset; the dataset was amended to reflect which boundary was used in the i-Tree Canopy assessment. designated [Urban/Rural] Whether the Ward has been identified as an Urban or Rural Ward. Wards were classified as Urban or Rural based on size: wards larger than 1,000 Ha were classed as Rural. status [Status] Current analysis status of the ward. All Wards in the dataset have been Completed.survyear [Survey year] The year the i-Tree Canopy assessment was completed. Data collected between 2018 and 2022. percancov [Percentage canopy cover] The average canopy cover for the ward boundary as calculated by the i-Tree Canopy model. standerr [Standard Error] The Standard Error associated with the average canopy cover value as calculated by the i-Tree Canopy model. numpts [Number of points] Number of points completed for the i-Tree Canopy assessment of the ward. warea [Ward area] The area of the Ward boundary (m2)
- g
Children in low income families | gimi9.com
- gimi9.com
Updated May 2, 2024ShareFacebookTwitterEmailClick to copy linkLink copiedCite(2024). Children in low income families | gimi9.com [Dataset]. https://gimi9.com/dataset/london_children-in-low-income-familiesDataset updatedMay 2, 2024LicenseCC0 1.0 Universal Public Domain Dedicationhttps://creativecommons.org/publicdomain/zero/1.0/
License information was derived automaticallyDescriptionAbout the dataset This dataset uses information from the DWP benefit system to provide estimates of children living in poverty for wards in London. In order to be counted in this dataset, a family must have claimed Child Benefit and at least one other household benefit (Universal Credit, tax credits or Housing Benefit) during the year. The numbers are calibrated to the Households Below Average Income (HBAI) dataset used to provide the government's headline poverty statistics. The definition of relative low income is living in a household with equivalised* income before housing costs (BHC) below 60% of contemporary national median income. The income measure includes contributions from earnings, state support and pensions. Further detail on the estimates of dependent children living in relative low income, including alternative geographical breakdowns and additional variables, such as age of children, family type and work status are available from DWP's statistical tabulation tool Stat-Xplore. Minor adjustments to the data have been applied to guard against the identification of individual claimants. This dataset replaced the DWP children in out-of-work benefit households and HMRC children in low income families local measure releases. This dataset includes estimates for all wards in London of numbers of dependent children living in relative low income families for each financial year from 2014/15 to the latest available (2022/23). The figures for the latest year are provisional and are subject to minor revision when the next dataset is released by DWP. Headlines Number of children The number of dependent children living in relative low income across London, rose from below 310,000 in the financial year ending 2015 to over 420,000 in the financial year ending 2020, but has decreased since then to below 350,000, which is well below the number for financial year ending 2018. While many wards in London have followed a similar pattern, the numbers of children in low income families in some wards have fallen more sharply, while the numbers in other wards have continued to grow. Proportion of children in each London ward Ward population sizes vary across London, the age profile of that population also varies and both the size and make-up of the population can change over time, so in order to make more meaningful comparisons between wards or over time, DWP have also published rates, though see note below regarding caution when using these figures. A dependent child is anyone aged under 16; or aged 16 to 19 in full-time non-advanced education or in unwaged government training. Ward level estimates for the total number of dependent children are not available, so percentages cannot be derived. Ward level estimates for the percentage of children under 16 living in low income families are usually published by DWP but, in its latest release, ward-level population estimates were not available at the time, so no rates were published. To derive the rates in this dataset, the GLA has used the ONS's latest ward-level population estimates (official statistics in development). Percentages for 2021/22 are calculated using the 2021 mid year estimates, while percentages for 2022/23 are calculated using the 2022 mid year estimates. As these are official statistics in development, rates therefore need to be treated with some caution. Notes *equivalised income is adjusted for household size and composition in order to compare living standards between households of different types.
- U
Excel Mapping Template for London Boroughs, and Wards
- data.ubdc.ac.uk
- data.europa.eu
xlsUpdated Nov 8, 2023ShareFacebookTwitterEmailClick to copy linkLink copiedCiteGreater London Authority (2023). Excel Mapping Template for London Boroughs, and Wards [Dataset]. https://data.ubdc.ac.uk/dataset/excel-mapping-template-for-london-boroughs-and-wardsxlsAvailable download formatsDataset updatedNov 8, 2023Dataset provided byGreater London AuthorityArea coveredLondonDescriptionHave you ever wanted to create a quick thematic map of London but lacked the GIS skills or software to do it yourself?
These free mapping tools from the GLA Intelligence Unit allows the user to input their own data to create an instant map that can be copied over into Word or another application of your choice. The user can also copy over the legend, and add labels.
The template allows the user to select either 4 or 5 ranges, and it even has a function to change the colours on the map (default colours are blue).
The tool now also allows users to input their own ranges, which will override the automatic ranges.
There is: Standard borough thematic map

Borough thematic map for categories (as opposed to numbers).
And ward maps for individual boroughs see list below.
Copyright notice: If you publish these maps, a copyright notice must be included within the report saying: "Contains Ordnance Survey data © Crown copyright and database rights."
Ward maps
Ward mapping tools for each borough have also been created. Select the borough you require from the list below:
All London Wards map with pre-2014 boundaries
Barking and Dagenham, Barnet, Bexley, Brent, Bromley, Camden, Croydon, Ealing, Enfield, Greenwich, Hackney (pre 2014), Hammersmith and Fulham, Haringey, Harrow, Havering, Hillingdon, Hounslow, Islington, Kensington and Chelsea (pre 2014), Kingston upon Thames, Lambeth, Lewisham, Merton, Newham, Redbridge, Richmond upon Thames, Southwark, Sutton, Tower Hamlets (pre 2014), Waltham Forest, Wandsworth, Westminster
New ward boundaries - came into effect from May 2014
All London wards map 2014 including the new ward boundaries for Hackney, Kensington and Chelsea, and Tower Hamlets following changes in May 2014.
Hackney, Kensington and Chelsea, Tower Hamlets
https://londondatastore-upload.s3.amazonaws.com/london-excel-map-thumb.JPG" alt="Alt text">
NOTE: Excel 2003 users must 'ungroup' the map for it to work.
Full instructions are contained within the spreadsheet. If you have any questions about these tools please contact Gareth Piggott.
Macros
The tool works in any version of Excel. But the user MUST ENABLE MACROS, for the features to work. There a some restrictions on functionality in the ward maps in Excel 2003 and earlier - full instructions are included in the spreadsheet.
To check whether the macros are enabled in Excel 2003 click Tools, Macro, Security and change the setting to Medium. Then you have to re-start Excel for the changes to take effect. When Excel starts up a prompt will ask if you want to enable macros - click yes.
In Excel 2007 and later, it should be set by default to the correct setting, but if it has been changed, click on the Windows Office button in the top corner, then Excel options (at the bottom), Trust Centre, Trust Centre Settings, and make sure it is set to 'Disable all macros with notification'. Then when you open the spreadsheet, a prompt labelled 'Options' will appear at the top for you to enable macros.
To create your own thematic borough maps in Excel using the ward map tool as a starting point, read these instructions. You will need to be a confident Excel user, and have access to your boundaries as a picture file from elsewhere. The mapping tools created here are all fully open access with no passwords.
- W
ONS Mid-Year Population Estimates - Custom Age Tables
- cloud.csiss.gmu.edu
- data.ubdc.ac.uk
- +2more
xlsUpdated Aug 14, 2018+ more versionsShareFacebookTwitterEmailClick to copy linkLink copiedCiteGreater London Authority (GLA) (2018). ONS Mid-Year Population Estimates - Custom Age Tables [Dataset]. https://cloud.csiss.gmu.edu/uddi/dataset/ons-mid-year-population-estimates-custom-age-tablesxlsAvailable download formatsDataset updatedAug 14, 2018Dataset provided byGreater London Authority (GLA)Licensehttp://reference.data.gov.uk/id/open-government-licencehttp://reference.data.gov.uk/id/open-government-licence
DescriptionExcel Age-Range creator for Office for National Statistics (ONS) Mid year population estimates (MYE) covering each year between 1999 and 2016

These files take into account the revised estimates for 2002-2010 released in April 2013 down to Local Authority level and the post 2011 estimates based on the Census results. Scotland and Northern Ireland data has not been revised, so Great Britain and United Kingdom totals comprise the original data for these plus revised England and Wales figures.
This Excel based tool enables users to query the single year of age raw data so that any age range can easily be calculated without having to carry out often complex, and time consuming formulas that could also be open to human error. Simply select the lower and upper age range for both males and females and the spreadsheet will return the total population for the range. Please adhere to the terms and conditions of supply contained within the file.
Tip: You can copy and paste the rows you are interested in to another worksheet by using the filters at the top of the columns and then select all by pressing Ctrl+A. Then simply copy and paste the cells to a new location.
ONS Mid year population estimates
Open Excel tool (London Boroughs, Regions and National, 1999-2016)
Also available is a custom-age tool for all geographies in the UK. Open the tool for all UK geographies (local authority and above) for: 2010, 2011, 2012, 2013, 2014 and 2015.
This full MYE dataset by single year of age (SYA) age and gender is available as a Datastore package here.
Ward Level Population estimates
Single year of age population tool for 2002 to 2015 for all wards in London.
New 2014 Ward boundary estimates
Ward boundary changes in May 2014 only affected three London boroughs - Hackney, Kensington and Chelsea, and Tower Hamlets. The estimates between 2001-2013 have been calculated by the GLA by taking the proportion of a the old ward that falls within the new ward based on the proportion of population living in each area at the 2011 Census. Therefore, these estimates are purely indicative and are not official statistics and not endorsed by ONS. From 2014 onwards, ONS began publishing official estimates for the new ward boundaries. Download here.
- U
London Fuel Poverty Risk Indicators, Wards
- data.ubdc.ac.uk
- data.europa.eu
- +1more
xlsUpdated Nov 8, 2023+ more versionsShareFacebookTwitterEmailClick to copy linkLink copiedCiteGreater London Authority (2023). London Fuel Poverty Risk Indicators, Wards [Dataset]. https://data.ubdc.ac.uk/dataset/london-fuel-poverty-risk-indicators-wardsxlsAvailable download formatsDataset updatedNov 8, 2023Dataset provided byGreater London AuthorityArea coveredLondonDescriptionThese fuel poverty risk indicators provide users with a nuanced picture of the impact of various risk factors, exacerbating factors and indicators for fuel poverty. It was developed with the Assembly Health and Public Services Committee in their investigation into fuel poverty in London. The Committee's report explains how the tool could be used strategically to help organisations target specific wards that are at high risk of fuel poverty. Appendix 4 in the report set out the rationale for the risk factors present in the tool.
Users can adjust the weighting of the indicators to show their relative significance. Isolating specific indicators could help organisations determine what type of support is likely to have greatest impact in an area. For example, wards with a low score for cavity wall insulation would indicate wards that could be targeted for promoting uptake of cavity wall insulation.
Read Victoria Borwick's blog "Using public data to tackle fuel poverty - can you help?"
The fuel poverty scores measure risk of fuel poverty based on 12 indicators. The England and Wales average each year is 0. Scores below 0 are more likely to be at risk from fuel poverty according to these measures.
The indicators are:
**Housing **
Dwellings without central heating
Cavity walls that are uninsulated
Lofts with less than 150mm insulation**Health **
Health Deprivation & Disability domain (ID2010)
Standardised Mortality Ratio
Incapacity Benefit claimant rate**Older people **
People aged 60 and over
Older people claiming pension credit**Worklessness **
UnemploymentPoverty
Income Support claimant rate
Child Poverty rates
Households classified 'fuel poor'The Excel tool includes a ward map, charts and rankings.
Note: Users must enable macros when prompted upon opening the spreadsheet (or reset security to medium/low) for the map to function. The rest of the tool will function without macros.
https://s3-eu-west-1.amazonaws.com/londondatastore-upload/fp-dashboard-map.jpg" alt="Excel Tool">
Residential property sales by ward: HPSSA dataset 36
- ons.gov.uk
- cy.ons.gov.uk
zipUpdated Sep 20, 2023+ more versionsShareFacebookTwitterEmailClick to copy linkLink copiedCiteOffice for National Statistics (2023). Residential property sales by ward: HPSSA dataset 36 [Dataset]. https://www.ons.gov.uk/peoplepopulationandcommunity/housing/datasets/numberofresidentialpropertysalesbywardhpssadataset36zipAvailable download formatsDataset updatedSep 20, 2023LicenseOpen Government Licence 3.0http://www.nationalarchives.gov.uk/doc/open-government-licence/version/3/
License information was derived automaticallyDescriptionNumber of residential property sales in England and Wales, by property type and electoral ward. Annual data.
FacebookTwitterPart of Release: Official Sub-Ward, Ward and Borough level crime counts.
Choose from the three data sets (‘Sub-Ward data’, ‘Ward data’ or ‘Borough data’) according to your requirements.
This page contains the ward level data file
Click here for corresponding LSOA level data: Recorded Crime Summary Data for London: LSOA Level
Click here for corresponding Borough level data: Recorded Crime Summary Data for London: Borough Level
Choose from the three data sets (‘Sub-Ward data’, ‘Ward data’ or ‘Borough data’) according to your requirements.
‘Sub-Ward data’ counts the number of crimes in each sub ward area of London (Census Lower Super Output Area or LSOA) per month according to crime type. Use this data if you need to analyse crime data at a sub ward level. Because not all crimes can be matched to a specific LSOA area, you should not use this data set to count crimes by ward or borough. For these purposes use one of the other datasets according to the level of geographic precision you need.
‘Ward data’ counts the number of crimes in each ward area of London per month, according to crime type. Use this data if you need to analyse crime data according to the location of geographic wards. Because not all crimes can be matched to a ward area, you should not use this data set to count crimes by borough. For this purpose use one of the Borough level dataset provided.
‘Borough data’ counts the number of crimes in each borough area of London per month, according to crime type.
Each of the data sets will contain the latest two years of data available. The categories of crime counts within them may change from time to time. Below is a list of the crime types you can currently extract (*only at borough or ward level):
**Minor Category: Major Category **
Murder: ViolenceAgainstThePerson
CommonAssault: ViolenceAgainstThePerson
OffensiveWeapon: ViolenceAgainstThePerson
Harassment: ViolenceAgainstThePerson
Otherviolence: ViolenceAgainstThePerson
AssaultWithInjury: ViolenceAgainstThePerson
WoundingGBH: ViolenceAgainstThePerson
*Rape: SexualOffences
*OtherSexual: SexualOffences
PersonalProperty: Robbery
BusinessProperty: Robbery
BurglaryInADwelling: Burglary
BurglaryInOtherBuildings: Burglary
TheftOrTakingOfMotor: TheftAndHandling
TheftFromMotor: TheftAndHandling
MotorInterferenceAndTampering: TheftAndHandling
TheftFromShops: TheftAndHandling
TheftOrTakingOfPedalCycles: TheftAndHandling
OtherTheftPerson: TheftAndHandling
OtherTheft: TheftAndHandling
HandlingStolenGoods: TheftAndHandling
*CountedPerVictim: FraudOrForgery
*OtherFraudAndForgery: FraudOrForgery
CriminalDamageToADwelling: CriminalDamage
CriminalDamageToOtherBldg: CriminalDamage
CriminalDamageToMotor: CriminalDamage
OtherCriminalDamage: CriminalDamage
DrugTrafficking: Drugs
PossessionOfDrugs: Drugs
OtherDrugOffences: Drugs
GoingEquipped: OtherNotifiableOffences
OtherNotifiable: OtherNotifiableOffences
**Each row of data in the data sets contains: **
*The number of incidents according to the Month Recorded, the specific crime type, and the Location
*The Month Recorded
*The broad crime type (Major HO category – eg Robbery)
*The specific crime type (Minor HO category – eg Robbery: Personal Property)
*The Location (Sub –Ward, Ward or borough depending on the data set selected)