- i
Human Geography Map
- indianamap.org
- data.baltimorecity.gov
- +15more
Updated Feb 2, 2017 Share
Share Facebook
 Twitter
 EmailClick to copy linkLink copiedCiteEsri (2017). Human Geography Map [Dataset]. https://www.indianamap.org/maps/3582b744bba84668b52a16b0b6942544Dataset updatedFeb 2, 2017Dataset authored and provided byEsriArea coveredDescription
The Human Geography Map (World Edition) web map provides a detailed vector basemap with a monochromatic style and content adjusted to support Human Geography information. Where possible, the map content has been adjusted so that it observes WCAG contrast criteria.This basemap, included in the ArcGIS Living Atlas of the World, uses 3 vector tile layers:Human Geography Label, a label reference layer including cities and communities, countries, administrative units, and at larger scales street names.Human Geography Detail, a detail reference layer including administrative boundaries, roads and highways, and larger bodies of water. This layer is designed to be used with a high degree of transparency so that the detail does not compete with your information. It is set at approximately 50% in this web map, but can be adjusted.Human Geography Base, a simple basemap consisting of land areas in a very light gray only.The vector tile layers in this web map are built using the same data sources used for other Esri Vector Basemaps. For details on data sources contributed by the GIS community, view the map of Community Maps Basemap Contributors. Esri Vector Basemaps are updated monthly.Learn more about this basemap from the cartographic designer in Introducing a Human Geography Basemap.Use this MapThis map is designed to be used as a basemap for overlaying other layers of information or as a stand-alone reference map. You can add layers to this web map and save as your own map. If you like, you can add this web map to a custom basemap gallery for others in your organization to use in creating web maps. If you would like to add this map as a layer in other maps you are creating, you may use the tile layer item referenced in this map.
- Z
Data for detailed temporal mapping of global human modification from 1990 to...
- data.niaid.nih.gov
- zenodo.org
Updated Jun 18, 2023+ more versionsShareFacebookTwitterEmailClick to copy linkLink copiedCiteBaruch-Mordo, Sharon (2023). Data for detailed temporal mapping of global human modification from 1990 to 2017 [Dataset]. https://data.niaid.nih.gov/resources?id=zenodo_3963012Dataset updatedJun 18, 2023Dataset provided byKennedy, Christina
Theobald, David M.
Kiesecker, Joe
Oakleaf, James
Baruch-Mordo, Sharon
Chen, BinLicenseAttribution 1.0 (CC BY 1.0)https://creativecommons.org/licenses/by/1.0/
License information was derived automaticallyDescriptionData on the extent, patterns, and trends of human land use are critically important to support global and national priorities for conservation and sustainable development. To inform these issues, we created a series of detailed global datasets for 1990, 1995, 2000, 2005, 2010, 2015, and 2017 to evaluate temporal changes and spatial patterns of land use modification of terrestrial lands (excluding Antarctica). These data were calculated using the degree of human modification approach that combines the proportion of a pixel of a given stressor (i.e. footprint) times the intensity of that stressor (ranging from 0 to 1.0). Our novel datasets are detailed (0.09 km^2 resolution), temporally consistent (for 1990-2015, every 5 years), comprehensive (11 change stressors, 14 current), robust (using an established framework and incorporating classification errors and parameter uncertainty), and strongly validated. We also provide a dataset that represents ~2017 conditions and has 14 stressors for an even more comprehensive dataset, but the 2017 results should not be used to calculate change with the other datasets (1990-2015). Note that because of repo file size limits, the datasets for the for the HM overall for 1990 and 1995, as well as major stressors for all years, are located this Google Drive.
This version 1.5 provides the following updates:
Datasets are provided for each of the 6 stressor groups: built-up areas (BU), agricultural/timber harvest (AG), extractive energy and mining (EX), human intrusions (HI), natural system modifications (NS), and transportation & infrastructure (TI), available now at 300 m resolution for each of the time steps in the 1990-2015 time series.
It provides the addition datasets for the years 1995 and 2005, calculated using linear interpolation when stressor data do not provide data at the specific year.
The ESA 150 m water-mask dataset (Lamarche et al. 2017) was used to provide better and more consistent alignment of datasets at the ocean-land-inland water interfaces.
The built-up stressor uses an updated version of the Global Human Settlement Layer (v2022A).
Values provided are 32-bit floating point values, with human modification values ranging from 0.0 to 1.0.
For more details on the approach and methods, please see: Theobald, D. M., Kennedy, C., Chen, B., Oakleaf, J., Baruch-Mordo, S., and Kiesecker, J.: Earth transformed: detailed mapping of global human modification from 1990 to 2017, Earth Syst. Sci. Data., https://doi.org/10.5194/essd-2019-252, 2020.
Version 1.5 was completed in collaboration with the Center for Biodiversity and Global Change at Yale University and supported by the E.O. Wilson Biodiversity Foundation.
- c
Human Geography Map
- cacgeoportal.com
- hub.arcgis.com
Updated Apr 2, 2024ShareFacebookTwitterEmailClick to copy linkLink copiedCiteCentral Asia and the Caucasus GeoPortal (2024). Human Geography Map [Dataset]. https://www.cacgeoportal.com/maps/fab47203217543328f50448dd03d90efDataset updatedApr 2, 2024Dataset authored and provided byCentral Asia and the Caucasus GeoPortalArea coveredDescriptionThis is a subset of World Biomass Image Layer to focus on Central Asia and Caucasus Region. Use this web map to visualize and understand the Biomass for that region. Use image layer for your analysis. Plants play a central role in the carbon cycle by absorbing carbon dioxide from the atmosphere and incorporating it in the structure of the plant. Globally living plants contain 500 billion metric tons of carbon, more than 60 times the amount of carbon released to the atmosphere by humans each year. Understanding the distribution of the carbon stored in living plants, known as biomass, is key to estimating the effects of land use change on the climate.Dataset SummaryThis layer provides access to a 1-km cell-sized raster with data on the density of carbon stored in living plants in metric tons per hectare for the year 2000. It was published by the Oak Ridge National Laboratory Carbon Dioxide Information Analysis Center in 2008.The authors of these data request that they be cited as:Ruesch, Aaron, and Holly K. Gibbs. 2008. New IPCC Tier-1 Global Biomass Carbon Map For the Year 2000. Available online from the Carbon Dioxide Information Analysis Center, Oak Ridge National Laboratory, Oak Ridge, Tennessee.What can you do with this layer?This layer is suitable for both visualization and analysis. It can be used in ArcGIS Online in web maps and applications and can be used in ArcGIS Desktop.This layer has query, identify, and export image services available. This layer is restricted to a maximum area of 16,000 x 16,000 pixels - an area 4,000 kilometers on a side or an area approximately the size of Europe. The Esri Insider Blog provides an introduction to the Ecophysiographic Mapping project.
- a
Procedural Human Action Videos - Depth Maps
- academictorrents.com
bittorrentUpdated Jul 14, 2017+ more versionsShareFacebookTwitterEmailClick to copy linkLink copiedCiteCesar Roberto de Souza and Adrien Gaidon and Yohann Cabon and Antonio Manuel Lopez Pena (2017). Procedural Human Action Videos - Depth Maps [Dataset]. https://academictorrents.com/details/eb1ae18213ba0fb97e33ed773eea900a8374efd0bittorrent(124045814703)Available download formatsDataset updatedJul 14, 2017Dataset authored and provided byCesar Roberto de Souza and Adrien Gaidon and Yohann Cabon and Antonio Manuel Lopez PenaLicensehttps://academictorrents.com/nolicensespecifiedhttps://academictorrents.com/nolicensespecified
DescriptionProcedural Human Action Videos (PHAV) ——————————————————- This torrent contains the Procedural Human Action Videos (PHAV) dataset. This version of the dataset contains 39,982 videos that have been generated by a computer. The dataset is made available under the Creative Commons BY-NC-SA (Attribution-NonCommercial-ShareAlike 4.0 International) license. This sub- directory contains the Depth Map data modality of these videos. A human-readable version of the license terms is available at: - The full license terms are available at: - By using PHAV, you agree to abide to the terms of the Creative Commons BY-NC-SA license. If you do not agree with the terms of this license, please contact the dataset authors for other licensing options. For more information, including details
Data from: Tox21BodyMap: A webtool to map chemical effects on the human body...
- catalog.data.gov
Updated Nov 12, 2020ShareFacebookTwitterEmailClick to copy linkLink copiedCiteU.S. EPA Office of Research and Development (ORD) (2020). Tox21BodyMap: A webtool to map chemical effects on the human body [Dataset]. https://catalog.data.gov/dataset/tox21bodymap-a-webtool-to-map-chemical-effects-on-the-human-bodyDataset updatedNov 12, 2020DescriptionThis manuscript describes development of a novel tool called Tox21BodyMap. This tool is designed to map biological assay data onto organs of the human body, facilitating predictions between chemical exposure and apical effects. Tox21BodyMap maps chemical effects to biological target tissues uses tissue-specific gene expression and high throughput screening data. High throughput screening sources includes ToxCast and Tox21. Tox21BodyMap is a freely available, online tool. This dataset is associated with the following publication: Borrel, A., S. Auerbach, K. Houck, and N. Kleinstreuer. Tox21BodyMap: A webtool to map chemical effects on the human body. NUCLEIC ACIDS RESEARCH. Oxford University Press, Cary, NC, USA, 48(W1): W472-W476, (2020).
- c
The Cuban Human Brain Mapping Project (EEG, MRI, and Cognition dataset)
- portal.conp.ca
- portal-test.conp.ca
- +1more
Updated Jul 29, 2020ShareFacebookTwitterEmailClick to copy linkLink copiedCiteCuban Center for Neuroscience, La Habana, Cuba (2020). The Cuban Human Brain Mapping Project (EEG, MRI, and Cognition dataset) [Dataset]. https://portal.conp.ca/dataset?id=projects/CHBMPDataset updatedJul 29, 2020Dataset provided byCuban Center for Neuroscience, La Habana, Cuba
Pedro A. Valdes-SosaDescriptionThe Cuban Human Brain Mapping Project (CHBMP) repository is an open multimodal neuroimaging and cognitive dataset from 282 healthy participants (31.9 ± 9.3 years, age range 18–68 years). This dataset was acquired from 2004 to 2008 as a subset of a larger stratified random sample of 2,019 participants from La Lisa municipality in La Habana, Cuba. The exclusion included presence of disease or brain dysfunctions. The information made available for all participants comprises: high-density (64-120 channels) resting state electroencephalograms (EEG), magnetic resonance images (MRI), psychological tests (MMSE, Wechsler Adult Intelligence Scale -WAIS III, computerized reaction time tests using a go no-go paradigm), as well as general information (age, gender, education, ethnicity, handedness and weight). The EEG data contains recordings with at least 30 minutes duration including the following conditions: eyes closed, eyes open, hyperventilation and subsequent recovery. The MRI consisted in anatomical T1 as well as diffusion weighted (DWI) images acquired on a 1.5 Tesla system. The data is available for registered users on the LORIS database which is part of the MNI neuroinformatics ecosystem.
- N
Data from: Mapping Lesions That Cause Psychosis to a Human Brain Circuit and...
- neurovault.org
zipUpdated Apr 29, 2025ShareFacebookTwitterEmailClick to copy linkLink copiedCite(2025). Mapping Lesions That Cause Psychosis to a Human Brain Circuit and Proposed Stimulation Target [Dataset]. http://identifiers.org/neurovault.collection:20510zipAvailable download formatsUnique identifierhttps://identifiers.org/neurovault.collection:20510Dataset updatedApr 29, 2025LicenseCC0 1.0 Universal Public Domain Dedicationhttps://creativecommons.org/publicdomain/zero/1.0/
License information was derived automaticallyDescriptionA collection of 1 brain maps. Each brain map is a 3D array of values representing properties of the brain at different locations.
Collection description
Pines AR, Frandsen SB, Drew W, Meyer GM, Howard C, Palm ST, Schaper FLWVJ, Lin C, Butenko K, Ferguson MA, Friedrich MU, Grafman JH, Kappel AD, Neudorfer C, Rost NS, Sanderson LL, Taylor JJ, Wu O, Kletenik I, Vogel JW, Cohen AL, Horn A, Fox MD, Silbersweig D, Siddiqi SH. Mapping Lesions That Cause Psychosis to a Human Brain Circuit and Proposed Stimulation Target. JAMA Psychiatry. 2025 Apr 1;82(4):368-378.
Human Geography Regions Map Analysis
- library.ncge.org
Updated Jul 28, 2021ShareFacebookTwitterEmailClick to copy linkLink copiedCiteNCGE (2021). Human Geography Regions Map Analysis [Dataset]. https://library.ncge.org/documents/6ef711a51646406e9eff1bd92b61777dDataset updatedJul 28, 2021AuthorsNCGELicenseAttribution-NonCommercial-ShareAlike 4.0 (CC BY-NC-SA 4.0)https://creativecommons.org/licenses/by-nc-sa/4.0/
License information was derived automaticallyDescriptionAuthor: Ann Wurst, consultantGrade/Audience: ap human geographyResource type: activitySubject topic(s): regional geography, maps, human geographyRegion: worldStandards: AP Human Geography CED TOPIC 1.7 Regional Analysis LEARNING OBJECTIVE SPS-1.A Describe different ways that geographers define regions. ESSENTIAL KNOWLEDGE SPS-1.A.1 Regions are defined on the basis of one or more unifying characteristics or on patterns of activity. SPS-1.A.2 Types of regions include formal, functional, and perceptual/vernacular. SPS-1.A.3 Regional boundaries are transitional and often contested and overlapping. SPS-1.A.4 Geographers apply regional analysis at local, national, and global scales.Objectives: Students will be able to describe different ways that geographers define regions. Students wll be able to define Regions on the basis of one ormore unifying characteristics or on patterns of activity. Students will be able to identify the types of regions (formal, functional, and perceptual/vernacular.) Students will understand that Geographers apply regional analysis at local, national, and global scales. Summary: A mapping activity that helps students identify and reflect on the regions used in AP Human Geography classes. Students will be expected to answer some culminating questions after creating their map.
- a
Data from: Human Footprint
- hub.arcgis.com
Updated Nov 16, 2023ShareFacebookTwitterEmailClick to copy linkLink copiedCiteMapMaker (2023). Human Footprint [Dataset]. https://hub.arcgis.com/datasets/326d2a6e21524d8783004cf76741c7ebDataset updatedNov 16, 2023Dataset authored and provided byMapMakerLicenseAttribution 4.0 (CC BY 4.0)https://creativecommons.org/licenses/by/4.0/
License information was derived automaticallyArea coveredDescriptionHumans need food, shelter, and water to survive. Our planet provides the resources to help fulfill these needs and many more. But exactly how much of an impact are we making on our planet? And will we reach a point at which the Earth can no longer support our growing population?Just like a bank account tracks money spent and earned, the relationship between human consumption of resources and the number of resources the Earth can supply—our human footprint—can be measured. Our human footprint can be calculated for an individual, town, or country, and quantifies the intensity of human pressures on the environment. The Human Footprint map layer is designed to do this by deriving a value representing the magnitude of the human footprint per one square kilometer (0.39 square miles) for every biome.This map layer was created by scientists with data from NASA's Socioeconomic Data and Applications Center to highlight where human pressures are most extreme in hopes to reduce environmental damage. The Human Footprint map asks the question, where are the least influenced, most “wild” parts of the world?The Human Footprint map was produced by combining thirteen global data layers that spatially visualize what is presumed to be the most prominent ways humans influence the environment. These layers include human population pressure (population density), human land use and infrastructure (built-up areas, nighttime lights, land use/land cover), and human access (coastlines, roads, railroads, navigable rivers). Based on the amount of overlap between layers, each square kilometer value is scaled between zero and one for each biome. Meaning that if an area in a Moist Tropical Forest biome scored a value of one, that square kilometer of land is part of the one percent least influenced/most wild area in its biome. Knowing this, we can help preserve the more wild areas in every biome, while also highlighting where to start mitigating human pressures in areas with high human footprints.So how can you reduce your individual human footprint? Here are just a few ways:Recycle: Recycling helps conserve resources, reduces water and air pollution, and helps save space in overcrowded landfills.Use less water: The average American uses 310 liters (82 gallons) of water a day. Reduce water consumption by taking shorter showers, turning off the water when brushing your teeth, avoiding pouring excess drinking water down the sink, and washing fruits and vegetables in a bowl of water rather than under the tap.Reduce driving: When you can, walk, bike, or take a bus instead of driving. Even 3 kilometers (2 miles) in a car puts about two pounds of carbon dioxide (CO2) into the atmosphere. If you must drive, try to carpool to reduce pollution. Lastly, skip the drive-through. You pollute more when you sit in a line while your car is emitting pollutant gases.Know how much you’re consuming: Most people are unaware of how much they are consuming every day. Calculate your individual ecological footprint to see how you can reduce your consumption here.Systemic implications: Individually, we are a rounding error. Take some time to understand how our individual actions can inform more systemic changes that may ultimately have a bigger impact on reducing humanity's overarching footprint.
Human Geography Dark Map
- data.baltimorecity.gov
- noveladata.com
- +13more
Updated May 4, 2017ShareFacebookTwitterEmailClick to copy linkLink copiedCiteEsri (2017). Human Geography Dark Map [Dataset]. https://data.baltimorecity.gov/maps/4f2e99ba65e34bb8af49733d9778fb8eDataset updatedMay 4, 2017Area coveredDescriptionThe Human Geography Dark Map (World Edition) web map provides a detailed world basemap with a dark monochromatic style and content adjusted to support human geography information. Where possible, the map content has been adjusted so that it observes WCAG contrast criteria.This basemap, included in the ArcGIS Living Atlas of the World, uses 3 vector tile layers:Human Geography Dark Label, a label reference layer including cities and communities, countries, administrative units, and at larger scales street names.Human Geography Dark Detail, a detail reference layer including administrative boundaries, roads and highways, and larger bodies of water. This layer is designed to be used with a high degree of transparency so that the detail does not compete with your information. It is set at approximately 50% in this web map, but can be adjusted.Human Geography Dark Base, a simple basemap consisting of land areas in a very dark gray only.The vector tile layers in this web map are built using the same data sources used for other Esri Vector Basemaps. For details on data sources contributed by the GIS community, view the map of Community Maps Basemap Contributors. Esri Vector Basemaps are updated monthly.Learn more about this basemap from the cartographic designer in A Dark Version of the Human Geography Basemap.Use this MapThis map is designed to be used as a basemap for overlaying other layers of information or as a stand-alone reference map. You can add layers to this web map and save as your own map. If you like, you can add this web map to a custom basemap gallery for others in your organization to use in creating web maps. If you would like to add this map as a layer in other maps you are creating, you may use the tile layers referenced in this map.
Global 100m Terrestrial Human Footprint (HFP-100)
- data.niaid.nih.gov
- datadryad.org
zipUpdated Nov 1, 2023ShareFacebookTwitterEmailClick to copy linkLink copiedCiteJoseph Mazzariello; Francis Gassert (2023). Global 100m Terrestrial Human Footprint (HFP-100) [Dataset]. http://doi.org/10.5061/dryad.ttdz08m1fzipAvailable download formatsUnique identifierhttps://doi.org/10.5061/dryad.ttdz08m1fDataset updatedNov 1, 2023Dataset provided byVizzuality (Spain)
Impact Observatory, Inc.AuthorsJoseph Mazzariello; Francis GassertLicensehttps://spdx.org/licenses/CC0-1.0.htmlhttps://spdx.org/licenses/CC0-1.0.html
DescriptionMaps depicting the intensity of human pressure on the environment have become a critical tool for spatial planning and management, monitoring the extent of human influence across Earth, and identifying critical remaining intact habitat. Yet, these maps are often years out of date by the time they are available to scientists and policy-makers. Here we provide an updated Human Footprint methodology to run on an annual basis to monitor changing anthropogenic pressures. Software and methods are parameterized to enable regular updates in the future. In addition, we release a 100-meter global dataset for the years 2015–2019 and 2020 based on land use, population, infrastructure, and accessibility data. Results show high levels of agreement in validation against expert-interpreted satellite imagery and improved performance compared to previous iterations of similar datasets. These maps are directly relevant to measuring progress towards national and international targets related to biodiversity conservation and sustainable development. Methods This dataset was created by combining data on human pressures across the period 2015 to 2019 and for 2020 to map: 1) Land cover change (built environments, crop lands, and pasture lands), 2) population density, 3) electric infrastructure, 4) roadways, 5) railways, and 6) navigable waterways. Each pressure layer is assigned a score relative to its level of human pressure, then computed into a standardized scale of 0–50 as the sum of all pressure layers. Pressures are not mutually exclusive, rather the co-occurrence of pressures is intended to identify the greatest levels of human impact. The majority of layers cover the complete time period of 2015–2020, however, pressures from pasture, roads, and railways are treated as static in the Human Footprint maps due to limitations in the input datasets. Scripts used to produce this data are available at: https://gitlab.com/impactobservatory/dwi-humanfootprint Overall methodology is based on the following: --B. A. Williams, O. Venter, J. R. Allan, S. C. Atkinson, J. A. Rehbein, M. Ward, M. Di Marco, H. S. Grantham, J. Ervin, S. J. Goetz, A. J. Hansen, P. Jantz, R. Pillay, S. Rodríguez-Buriticá, C. Supples, A. L. S. Virnig, J. E. M. Watson, Change in Terrestrial Human Footprint Drives Continued Loss of Intact Ecosystems. One Earth. 3, 371–382 (2020). --E. W. Sanderson, M. Jaiteh, M. A. Levy, K. H. Redford, A. V. Wannebo, G. Woolmer, The Human Footprint and the Last of the Wild: The human footprint is a global map of human influence on the land surface, which suggests that human beings are stewards of nature, whether we like it or not. BioScience. 52, 891–904 (2002). --O. Venter, E. W. Sanderson, A. Magrach, J. R. Allan, J. Beher, K. R. Jones, H. P. Possingham, W. F. Laurance, P. Wood, B. M. Fekete, M. A. Levy, J. E. M. Watson, Global terrestrial Human Footprint maps for 1993 and 2009. Sci. Data. 3, 160067 (2016). Please see the following for more detail: Gassert F, Venter O, Watson JEM, Brumby SP, Mazzariello JC, Atkinson SC and Hyde S, An operational approach to near real-time global high-resolution mapping of the terrestrial human footprint. Front. Remote Sens. 4:1130896. doi: 10.3389/frsen.2023.1130896 (2023)
- e
Data from: A draft map of the human proteome
- ebi.ac.uk
- data.niaid.nih.gov
Updated Apr 24, 2014ShareFacebookTwitterEmailClick to copy linkLink copiedCiteAkhilesh Pandey (2014). A draft map of the human proteome [Dataset]. https://www.ebi.ac.uk/pride/archive/projects/PXD000561Dataset updatedApr 24, 2014AuthorsAkhilesh PandeyVariables measuredProteomicsDescriptionThe availability of human genome sequence has transformed biomedical research over the past decade. However, an equivalent map for the human proteome with direct measurements of proteins and peptides does not exist yet. Here, we report a draft map of the human proteome based on high resolution Fourier transform mass spectrometry-based proteomics technology. In-depth proteomic profiling of 30 histologically normal human samples including 17 adult tissues, 7 fetal tissues and 6 purified primary hematopoietic cells resulted in identification of proteins encoded by greater than 17,000 genes accounting for ~84% of the total annotated protein-coding genes in humans. This large human proteome catalog (available as an interactive web-based resource at http://www.humanproteomemap.org) will complement available human genome and transcriptome data to accelerate biomedical research in health and disease. The authors request that those considering use of this dataset for commercial purposes contact pandey@jhmi.edu.
- N
Atlases of cognition with large-scale human brain mapping: human sound
- neurovault.org
niftiUpdated Dec 3, 2018+ more versionsShareFacebookTwitterEmailClick to copy linkLink copiedCite(2018). Atlases of cognition with large-scale human brain mapping: human sound [Dataset]. http://identifiers.org/neurovault.image:109669niftiAvailable download formatsUnique identifierhttps://identifiers.org/neurovault.image:109669Dataset updatedDec 3, 2018LicenseCC0 1.0 Universal Public Domain Dedicationhttps://creativecommons.org/publicdomain/zero/1.0/
License information was derived automaticallyDescriptionhuman_sound.nii.gz
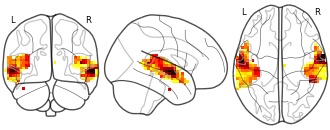
Collection description
Atlases of various aspects of cognition estimated via large-scale decoding across many studies
Subject species
homo sapiens
Map type
Other
- N
Non-invasive mapping of connections between human thalamus and cortex using...
- neurovault.org
zipUpdated Jun 30, 2018ShareFacebookTwitterEmailClick to copy linkLink copiedCite(2018). Non-invasive mapping of connections between human thalamus and cortex using diffusion imaging [Dataset]. http://identifiers.org/neurovault.collection:1056zipAvailable download formatsUnique identifierhttps://identifiers.org/neurovault.collection:1056Dataset updatedJun 30, 2018LicenseCC0 1.0 Universal Public Domain Dedicationhttps://creativecommons.org/publicdomain/zero/1.0/
License information was derived automaticallyDescriptionA collection of 20 brain maps. Each brain map is a 3D array of values representing properties of the brain at different locations.
Collection description
- N
Atlases of cognition with large-scale human brain mapping: horizontal...
- neurovault.org
niftiUpdated Dec 3, 2018+ more versionsShareFacebookTwitterEmailClick to copy linkLink copiedCite(2018). Atlases of cognition with large-scale human brain mapping: horizontal checkerboard [Dataset]. http://identifiers.org/neurovault.image:109668niftiAvailable download formatsUnique identifierhttps://identifiers.org/neurovault.image:109668Dataset updatedDec 3, 2018LicenseCC0 1.0 Universal Public Domain Dedicationhttps://creativecommons.org/publicdomain/zero/1.0/
License information was derived automaticallyDescriptionhorizontal_checkerboard.nii.gz
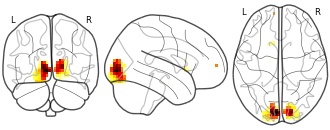
Collection description
Atlases of various aspects of cognition estimated via large-scale decoding across many studies
Subject species
homo sapiens
Map type
Other
Human Mitogen Activated Protein MAP Kinase Interactome
- johnsnowlabs.com
csvUpdated Jan 20, 2021ShareFacebookTwitterEmailClick to copy linkLink copiedCiteJohn Snow Labs (2021). Human Mitogen Activated Protein MAP Kinase Interactome [Dataset]. https://www.johnsnowlabs.com/marketplace/human-mitogen-activated-protein-map-kinase-interactome/csvAvailable download formatsDataset updatedJan 20, 2021Dataset authored and provided byJohn Snow LabsArea coveredN/ADescriptionThis dataset contains the interaction data published in A Human Map Kinase Interactome by Bandyopadhyay S. et al. - 2010, which reported all interactions for the human protein Mitogen Activated Protein (MAP) kinase as well as associated annotation data obtained from the Biological General Repository for Interaction databases (BIOGRID) for humans including the protein used to find the modification (bait), and annotations on the proteins pulled during the interaction experiment.
- d
Detailed temporal mapping of global human modification from 1990 to 2017
- datadryad.org
- data.niaid.nih.gov
- +2more
zipUpdated Jan 31, 2020ShareFacebookTwitterEmailClick to copy linkLink copiedCiteDavid Theobald; Christina Kennedy; Bin Chen; James Oakleaf; Joe Kiesecker; Sharon Baruch-Mordo (2020). Detailed temporal mapping of global human modification from 1990 to 2017 [Dataset]. http://doi.org/10.5061/dryad.n5tb2rbs1zipAvailable download formatsUnique identifierhttps://doi.org/10.5061/dryad.n5tb2rbs1Dataset updatedJan 31, 2020Dataset provided byDryadAuthorsDavid Theobald; Christina Kennedy; Bin Chen; James Oakleaf; Joe Kiesecker; Sharon Baruch-MordoTime period covered2020DescriptionThe file naming convention for the zip-files that contain the datasets provided here is as follows:
gHM_landLakeReservoirOcean300m.zip - contains TIFs at 300 m resolution to represent the following classes: 1=land, 2=lake (natural water bodies), 3=reservoirs (water bodies created by dams), and 4=ocean.
gHMv1_300m_1990_change.zip - contains TIFs at 300 m resolution for calculating change between 1990 and 2000, 2010, or 2015.
gHMv1_300m_2000_change.zip - contains TIFs at 300 m resolution for calculating change between 2000 and 1990, 2010, or 2015.
gHMv1_300m_2010_change.zip - contains TIFs at 300 m resolution for calculating change between 2010 and 1990, 2000, or 2015.
gHMv1_300m_2015_change.zip - contains TIFs at 300 m resolution for calculating change between 2015 and 1990, 2000, or 2010.
gHMv1_300m_2017_static.zip - contains TIFs at 300 m resolution that contains all stressors that represents ~2017 conditions. This is NOT to be used to compare to other "change" datasets.
gH...
- w
Dataset of books about Human gene mapping
- workwithdata.com
Updated Apr 17, 2025ShareFacebookTwitterEmailClick to copy linkLink copiedCiteWork With Data (2025). Dataset of books about Human gene mapping [Dataset]. https://www.workwithdata.com/datasets/books?f=1&fcol0=j0-book_subject&fop0=%3D&fval0=Human+gene+mapping&j=1&j0=book_subjectsDataset updatedApr 17, 2025Dataset authored and provided byWork With DataLicenseAttribution 4.0 (CC BY 4.0)https://creativecommons.org/licenses/by/4.0/
License information was derived automaticallyDescriptionThis dataset is about books. It has 19 rows and is filtered where the book subjects is Human gene mapping. It features 9 columns including author, publication date, language, and book publisher.
Largest Dataset Mapping Human Brain
- kaggle.com
Updated Jun 13, 2021ShareFacebookTwitterEmailClick to copy linkLink copiedCiteBaris Dincer (2021). Largest Dataset Mapping Human Brain [Dataset]. https://www.kaggle.com/brsdincer/largest-dataset-mapping-human-brain/codeCroissantCroissant is a format for machine-learning datasets. Learn more about this at mlcommons.org/croissant.Dataset updatedJun 13, 2021AuthorsBaris DincerLicensehttp://opendatacommons.org/licenses/dbcl/1.0/http://opendatacommons.org/licenses/dbcl/1.0/
DescriptionLargest Dataset Mapping Human Brain
In collaboration with the Lichtman Laboratory at Harvard University, Google is releasing the “H01” dataset, a 1.4 petabyte rendering of a small sample of human brain tissue, along with a companion paper, “A connectomic study of a petascale fragment of human cerebral cortex.” The H01 sample was imaged at 4nm-resolution by serial section electron microscopy, reconstructed and annotated by automated computational techniques, and analyzed for preliminary insights into the structure of the human cortex. The dataset comprises imaging data that covers roughly one cubic millimeter of brain tissue, and includes tens of thousands of reconstructed neurons, millions of neuron fragments, 130 million annotated synapses, 104 proofread cells, and many additional subcellular annotations and structures — all easily accessible with the Neuroglancer browser interface.
This dataset contains videos of specific networks. It is shared for the first time on Kaggle. It is suitable for Computer Vision and DCGAN structures.
INCLUDE
- Full Connected
- Hemibrain Connection
- EM
- Central Complex Structures
- Connects Regions: ADL02od PCT
- Connects Regions: ADM10t
- Connects Regions: APL
- Connects Regions: AVL01lo PCT
- Connects Regions: ExR3
- Connects Regions: MBON01
- Connects Regions: Olfactory LN
- Connects Regions: Ovil N
- d
Raw Stressor Data: A Global Map of Human Impact on Marine Ecosystems, 2008
- search.dataone.org
- knb.ecoinformatics.org
- +1more
Updated Dec 7, 2018+ more versionsShareFacebookTwitterEmailClick to copy linkLink copiedCiteBenjamin Halpern; Shaun Walbridge; Kimberly Selkoe; Carrie Kappel; Fiorenza Micheli; Caterina D'Agrosa; John Bruno; Kenneth Casey; Colin Ebert; Helen Fox; Rod Fujita; Dennis Heinemann; Hunter Lenihan; Elizabeth Madin; Matthew Perry; Elizabeth Selig; Mark Spalding; Robert Steneck; Reg Watson (2018). Raw Stressor Data: A Global Map of Human Impact on Marine Ecosystems, 2008 [Dataset]. http://doi.org/10.5063/F1JW8C4RUnique identifierhttps://doi.org/10.5063/F1JW8C4RDataset updatedDec 7, 2018Dataset provided byKnowledge Network for BiocomplexityAuthorsBenjamin Halpern; Shaun Walbridge; Kimberly Selkoe; Carrie Kappel; Fiorenza Micheli; Caterina D'Agrosa; John Bruno; Kenneth Casey; Colin Ebert; Helen Fox; Rod Fujita; Dennis Heinemann; Hunter Lenihan; Elizabeth Madin; Matthew Perry; Elizabeth Selig; Mark Spalding; Robert Steneck; Reg WatsonTime period coveredJan 1, 2008Area coveredEarthDescriptionWhat happens in the vast stretches of the world's oceans - both wondrous and worrisome - has too often been out of sight, out of mind. The sea represents the last major scientific frontier on planet earth - a place where expeditions continue to discover not only new species, but even new phyla. The role of these species in the ecosystem, where they sit in the tree of life, and how they respond to environmental changes really do constitute mysteries of the deep. Despite technological advances that now allow people to access, exploit or affect nearly all parts of the ocean, we still understand very little of the ocean's biodiversity and how it is changing under our influence. The goal of the research presented here is to estimate and visualize, for the first time, the global impact humans are having on the ocean's ecosystems. Our analysis, published in Science, February 15, 2008 (http://doi.org/10.1126/science.1149345), shows that over 40% of the world's oceans are heavily affected by human activities and few if any areas remain untouched. This dataset contains raw stressor data from 17 different human activities that directly or indirectly have an impact on the ecological communities in the ocean's ecosystems. For more information on specific dataset, see the methods section. All data are projected in WGS 1984 Mollweide.
FacebookTwitterThe Human Geography Map (World Edition) web map provides a detailed vector basemap with a monochromatic style and content adjusted to support Human Geography information. Where possible, the map content has been adjusted so that it observes WCAG contrast criteria.This basemap, included in the ArcGIS Living Atlas of the World, uses 3 vector tile layers:Human Geography Label, a label reference layer including cities and communities, countries, administrative units, and at larger scales street names.Human Geography Detail, a detail reference layer including administrative boundaries, roads and highways, and larger bodies of water. This layer is designed to be used with a high degree of transparency so that the detail does not compete with your information. It is set at approximately 50% in this web map, but can be adjusted.Human Geography Base, a simple basemap consisting of land areas in a very light gray only.The vector tile layers in this web map are built using the same data sources used for other Esri Vector Basemaps. For details on data sources contributed by the GIS community, view the map of Community Maps Basemap Contributors. Esri Vector Basemaps are updated monthly.Learn more about this basemap from the cartographic designer in Introducing a Human Geography Basemap.Use this MapThis map is designed to be used as a basemap for overlaying other layers of information or as a stand-alone reference map. You can add layers to this web map and save as your own map. If you like, you can add this web map to a custom basemap gallery for others in your organization to use in creating web maps. If you would like to add this map as a layer in other maps you are creating, you may use the tile layer item referenced in this map.