United Kingdom Govt Secs: Gross Issuance: Market Value: Index Linked Gilts
- ceicdata.com
Updated Feb 15, 2025 Share
Share Facebook
 Twitter
 EmailClick to copy linkLink copiedCiteCEICdata.com (2025). United Kingdom Govt Secs: Gross Issuance: Market Value: Index Linked Gilts [Dataset]. https://www.ceicdata.com/en/united-kingdom/debt-management-office-debt-securities-statistics/govt-secs-gross-issuance-market-value-index-linked-giltsDataset updatedFeb 15, 2025Dataset provided byCEIC DataLicense
Attribution 4.0 (CC BY 4.0)https://creativecommons.org/licenses/by/4.0/
License information was derived automaticallyTime period coveredJun 1, 2015 - Mar 1, 2018Area coveredUnited KingdomVariables measuredSecurities IssuanceDescriptionUnited Kingdom Govt Secs: Gross Issuance: Market Value: Index Linked Gilts data was reported at 664.784 GBP mn in Mar 2018. This records an increase from the previous number of 656.350 GBP mn for Dec 2017. United Kingdom Govt Secs: Gross Issuance: Market Value: Index Linked Gilts data is updated quarterly, averaging 267.695 GBP mn from Mar 2004 (Median) to Mar 2018, with 57 observations. The data reached an all-time high of 664.784 GBP mn in Mar 2018 and a record low of 88.432 GBP mn in Mar 2004. United Kingdom Govt Secs: Gross Issuance: Market Value: Index Linked Gilts data remains active status in CEIC and is reported by Debt Management Office. The data is categorized under Global Database’s UK – Table UK.Z016: Debt Management Office: Debt Securities Statistics.
Quality assurance of administrative data in the UK House Price Index
- gov.uk
- s3.amazonaws.com
Updated Dec 22, 2023ShareFacebookTwitterEmailClick to copy linkLink copiedCiteHM Land Registry (2023). Quality assurance of administrative data in the UK House Price Index [Dataset]. https://www.gov.uk/government/statistics/quality-assurance-of-administrative-data-in-the-uk-house-price-indexDataset updatedDec 22, 2023AuthorsHM Land RegistryArea coveredUnited KingdomDescriptionIn this document:
- HM Land Registry data
- Annex A: HM Land Registry capture process for Price Paid Data
- Annex B: Property type classification HM Land Registry
- Registers of Scotland data
- Annex A: Registers of Scotland data collection process map
- Annex B: Registers of Scotland data extraction and fields
- Annex C: Registers of Scotland field classifications and explanations
- Annex D: Registers of Scotland data quality assurance process
- Annex E: Registers of Scotland data strengths and weaknesses
- Land & Property Services Northern Ireland valuation list
- Valuation Office Agency Council Tax Valuation Lists
- Annex A: Valuation Office Agency collection flow process
- Regulated Mortgage Survey data provided by UK Finance
- Scottish Energy Performance Certificates
- Acorn consumer classification (CACI)
- Annex A: Summary of UK HPI production process within the Office for National Statistics
- Northern Ireland HMRC Stamp Duty Land Tax data
Related content
United Kingdom Govt Secs: Net Issuance: Nominal Value: Index Linked Gilts
- ceicdata.com
Updated Feb 15, 2025+ more versionsShareFacebookTwitterEmailClick to copy linkLink copiedCiteCEICdata.com (2025). United Kingdom Govt Secs: Net Issuance: Nominal Value: Index Linked Gilts [Dataset]. https://www.ceicdata.com/en/united-kingdom/debt-management-office-debt-securities-statistics/govt-secs-net-issuance-nominal-value-index-linked-giltsDataset updatedFeb 15, 2025Dataset provided byCEIC DataLicenseAttribution 4.0 (CC BY 4.0)https://creativecommons.org/licenses/by/4.0/
License information was derived automaticallyTime period coveredJun 1, 2015 - Mar 1, 2018Area coveredUnited KingdomVariables measuredSecurities IssuanceDescriptionUnited Kingdom Govt Secs: Net Issuance: Nominal Value: Index Linked Gilts data was reported at 419.767 GBP mn in Sep 2018. This records an increase from the previous number of 411.858 GBP mn for Jun 2018. United Kingdom Govt Secs: Net Issuance: Nominal Value: Index Linked Gilts data is updated quarterly, averaging 249.783 GBP mn from Jun 2005 (Median) to Sep 2018, with 54 observations. The data reached an all-time high of 419.767 GBP mn in Sep 2018 and a record low of 90.063 GBP mn in Jun 2005. United Kingdom Govt Secs: Net Issuance: Nominal Value: Index Linked Gilts data remains active status in CEIC and is reported by Debt Management Office. The data is categorized under Global Database’s United Kingdom – Table UK.Z016: Debt Management Office: Debt Securities Statistics.
- u
New housing price indexes, total selling prices including lot value indexed...
- data.urbandatacentre.ca
- beta.data.urbandatacentre.ca
Updated Oct 1, 2024+ more versionsShareFacebookTwitterEmailClick to copy linkLink copiedCite(2024). New housing price indexes, total selling prices including lot value indexed for metropolitan areas - Catalogue - Canadian Urban Data Catalogue (CUDC) [Dataset]. https://data.urbandatacentre.ca/dataset/gov-canada-49abd82e-e2a3-4d10-b50c-d32389453c11Dataset updatedOct 1, 2024LicenseOpen Government Licence - Canada 2.0https://open.canada.ca/en/open-government-licence-canada
License information was derived automaticallyArea coveredCanadaDescriptionThis table contains 174 series, with data for years 1981 - 1997 (not all combinations necessarily have data for all years). This table contains data described by the following dimensions (Not all combinations are available): Geography (37 items: Canada; Atlantic Region; Halifax; Nova Scotia; St. John's; Newfoundland and Labrador ...), New housing price indexes (3 items: Total (house and land);Land only; House only ...), Index base period (2 items: 1986=100;1981=100 ...).
- F
All-Transactions House Price Index for Utah
- fred.stlouisfed.org
jsonUpdated May 27, 2025ShareFacebookTwitterEmailClick to copy linkLink copiedCite(2025). All-Transactions House Price Index for Utah [Dataset]. https://fred.stlouisfed.org/series/UTSTHPIjsonAvailable download formatsDataset updatedMay 27, 2025Licensehttps://fred.stlouisfed.org/legal/#copyright-public-domainhttps://fred.stlouisfed.org/legal/#copyright-public-domain
Area coveredUtahDescriptionGraph and download economic data for All-Transactions House Price Index for Utah (UTSTHPI) from Q1 1975 to Q1 2025 about UT, appraisers, HPI, housing, price index, indexes, price, and USA.
Price Paid Data
- gov.uk
Updated Jun 27, 2025ShareFacebookTwitterEmailClick to copy linkLink copiedCiteHM Land Registry (2025). Price Paid Data [Dataset]. https://www.gov.uk/government/statistical-data-sets/price-paid-data-downloadsDataset updatedJun 27, 2025AuthorsHM Land RegistryDescriptionOur Price Paid Data includes information on all property sales in England and Wales that are sold for value and are lodged with us for registration.
Get up to date with the permitted use of our Price Paid Data:
check what to consider when using or publishing our Price Paid DataUsing or publishing our Price Paid Data
If you use or publish our Price Paid Data, you must add the following attribution statement:
Contains HM Land Registry data © Crown copyright and database right 2021. This data is licensed under the Open Government Licence v3.0.
Price Paid Data is released under the http://www.nationalarchives.gov.uk/doc/open-government-licence/version/3/" class="govuk-link">Open Government Licence (OGL). You need to make sure you understand the terms of the OGL before using the data.
Under the OGL, HM Land Registry permits you to use the Price Paid Data for commercial or non-commercial purposes. However, OGL does not cover the use of third party rights, which we are not authorised to license.
Price Paid Data contains address data processed against Ordnance Survey’s AddressBase Premium product, which incorporates Royal Mail’s PAF® database (Address Data). Royal Mail and Ordnance Survey permit your use of Address Data in the Price Paid Data:
- for personal and/or non-commercial use
- to display for the purpose of providing residential property price information services
If you want to use the Address Data in any other way, you must contact Royal Mail. Email address.management@royalmail.com.
Address data
The following fields comprise the address data included in Price Paid Data:
- Postcode
- PAON Primary Addressable Object Name (typically the house number or name)
- SAON Secondary Addressable Object Name – if there is a sub-building, for example, the building is divided into flats, there will be a SAON
- Street
- Locality
- Town/City
- District
- County
May 2025 data (current month)
The May 2025 release includes:
- the first release of data for May 2025 (transactions received from the first to the last day of the month)
- updates to earlier data releases
- Standard Price Paid Data (SPPD) and Additional Price Paid Data (APPD) transactions
As we will be adding to the April data in future releases, we would not recommend using it in isolation as an indication of market or HM Land Registry activity. When the full dataset is viewed alongside the data we’ve previously published, it adds to the overall picture of market activity.
Your use of Price Paid Data is governed by conditions and by downloading the data you are agreeing to those conditions.
Google Chrome (Chrome 88 onwards) is blocking downloads of our Price Paid Data. Please use another internet browser while we resolve this issue. We apologise for any inconvenience caused.
We update the data on the 20th working day of each month. You can download the:
- http://prod.publicdata.landregistry.gov.uk.s3-website-eu-west-1.amazonaws.com/pp-monthly-update-new-version.csv" class="govuk-link">current month as a CSV file (CSV, 18.5MB)
- http://prod.publicdata.landregistry.gov.uk.s3-website-eu-west-1.amazonaws.com/pp-monthly-update.txt" class="govuk-link">current month as a text file (TXT, 17.9MB)
Single file
These include standard and additional price paid data transactions received at HM Land Registry from 1 January 1995 to the most current monthly data.
Your use of Price Paid Data is governed by conditions and by downloading the data you are agreeing to those conditions.
The data is updated monthly and the average size of this file is 3.7 GB, you can download:
- <a re
- g
Price index figures on the production of buildings, 2000 - 2016 | gimi9.com
- gimi9.com
Updated May 3, 2025+ more versionsShareFacebookTwitterEmailClick to copy linkLink copiedCite(2025). Price index figures on the production of buildings, 2000 - 2016 | gimi9.com [Dataset]. https://gimi9.com/dataset/nl_4507-price-index-figures-on-the-production-of-buildings--2000---2016/Dataset updatedMay 3, 2025LicenseAttribution 4.0 (CC BY 4.0)https://creativecommons.org/licenses/by/4.0/
License information was derived automaticallyDescriptionIndex figures on production prices of dwellings and other buildings reflect the relation between the output value and the output volume and can be used to convert the value of construction output from current prices to fixed prices. The output price index is derived from the series "New dwellings; output indices 2000=100". From the 2nd quarter 2009 on, the figures of the series 2005 = 100 are used and linked to the series 2000 = 100. Statistics Netherlands publishes data on the value of construction output. The volume of construction output, however, cannot be deduced from the value, which is subject to price changes. The price index on the building costs of new dwellings eliminates the effect of price changes. The price index on construction output is calculated by distributing the value of the output (current prices) over the quarters essential to the price setting of the building project. Subsequently, the quarterly output is calculated in fixed prices by using the price index on the building costs of new dwellings. The index figure of the output price is the sum of the current prices divided by the sum of the fixed prices (*100). Possibilities for selection: - Total construction - Total construction of new dwellings/buildings - New dwellings - New buildings in the private sector - New buildings in the non-commercial sector - Total other buildings - Other dwellings - Other buildings in the private sector - Other buildings in the non-commercial sector Data available from 1st quarter 2000 till 4th quarter 2016 Frequency: discontinued Status of the figures: The figures of 2016 are provisional. Since this table has been discontinued, the data will not become definitive. Changes as of January 29 2018 None, this table is discontinued. When will new figures become available? This table is succeeded by Production on buildings; price index 2015 = 100. See paragraph 3. Linking recommendation If you want to compile long-term series with linked price indices on production of buildings, you can link the figures on price level 1995 with the figures on price level 2000. For that, the percentage change from the 2nd quarter 2005 with the 1st quarter 2005 must be calculated, as the price index for the 1st quarter 2005 is the last figure published on price level 1995. This change must then be adjusted to the figures for the 1st quarter 2005 of the series 1995. The 2nd quarter index of the linked series is calculated by calculating the difference between the 1st quarter 2005 and the 2nd quarter 2005 according to the series on price level 2000 and multiplying this by the index for the 1st quarter 2005 according to the series on price level 1995. In the example: (119/120) x 148=147 (rounded). For the 3rd quarter 2005 the index is calculated analogously, where because of rounding problems the first quarter figures must be used for the link.
United Kingdom Govt Secs: Net Issuance: Market Value: Index Linked Gilts
- ceicdata.com
Updated Feb 15, 2025ShareFacebookTwitterEmailClick to copy linkLink copiedCiteCEICdata.com (2025). United Kingdom Govt Secs: Net Issuance: Market Value: Index Linked Gilts [Dataset]. https://www.ceicdata.com/en/united-kingdom/debt-management-office-debt-securities-statistics/govt-secs-net-issuance-market-value-index-linked-giltsDataset updatedFeb 15, 2025Dataset provided byCEIC DataLicenseAttribution 4.0 (CC BY 4.0)https://creativecommons.org/licenses/by/4.0/
License information was derived automaticallyTime period coveredJun 1, 2015 - Mar 1, 2018Area coveredUnited KingdomVariables measuredSecurities IssuanceDescriptionUnited Kingdom Govt Secs: Net Issuance: Market Value: Index Linked Gilts data was reported at 648.883 GBP mn in Sep 2018. This records a decrease from the previous number of 650.174 GBP mn for Jun 2018. United Kingdom Govt Secs: Net Issuance: Market Value: Index Linked Gilts data is updated quarterly, averaging 321.103 GBP mn from Jun 2005 (Median) to Sep 2018, with 54 observations. The data reached an all-time high of 653.274 GBP mn in Mar 2018 and a record low of 102.470 GBP mn in Jun 2005. United Kingdom Govt Secs: Net Issuance: Market Value: Index Linked Gilts data remains active status in CEIC and is reported by Debt Management Office. The data is categorized under Global Database’s United Kingdom – Table UK.Z016: Debt Management Office: Debt Securities Statistics.
- T
Index of total agricultural output value of Qinghai Province (link index)...
- data.tpdc.ac.cn
- tpdc.ac.cn
zipUpdated Apr 12, 2021+ more versionsShareFacebookTwitterEmailClick to copy linkLink copiedCiteProvincial Qinghai (2021). Index of total agricultural output value of Qinghai Province (link index) (1952-2000) [Dataset]. https://data.tpdc.ac.cn/en/data/3988b702-ced5-4206-bd8b-a658aed21c46zipAvailable download formatsDataset updatedApr 12, 2021Dataset provided byTPDCAuthorsProvincial QinghaiArea coveredDescriptionThe data set records the total agricultural output value index of Qinghai Province, which is divided by the composition of the total agricultural output value. The data are collected from the statistical yearbook of Qinghai Province issued by the Bureau of statistics of Qinghai Province. The data set consists of three data tables Agricultural output value index (link index) 1952-1998.xls, Agricultural output value index (link index) 1952-1999.xls, Agricultural output value index (link index) 1952-2000.xls. The data table structure is the same. For example, there are six fields in the data table of agricultural output value index (link index) from 1952 to 1998 Field 1: composition of total agricultural output value Field 2: Forestry Field 3: Animal Husbandry Field 4: Fisheries
- N
Neural Substrates of Food Valuation and Its Relationship With BMI and...
- neurovault.org
niftiUpdated Dec 9, 2020+ more versionsShareFacebookTwitterEmailClick to copy linkLink copiedCite(2020). Neural Substrates of Food Valuation and Its Relationship With BMI and Healthy Eating in Higher BMI Individuals: BMI x All Food Valuation: Valuation Beta [Dataset]. http://identifiers.org/neurovault.image:439781niftiAvailable download formatsUnique identifierhttps://identifiers.org/neurovault.image:439781Dataset updatedDec 9, 2020LicenseCC0 1.0 Universal Public Domain Dedicationhttps://creativecommons.org/publicdomain/zero/1.0/
License information was derived automaticallyDescriptionBMIxAllFoodValuation_Value_Beta.nii.gz
Collection description
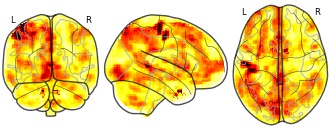
Considerable evidence points to a link between body mass index (BMI), eating behavior, and the brain's reward system. However, much of this research focuses on food cue reactivity without examining the subjective valuation process as a potential mechanism driving individual differences in BMI and eating behavior. The current pre-registered study (https://osf.io/n4c95/) examined the relationship between BMI, healthy eating, and subjective valuation of healthy and unhealthy foods in a community sample of individuals with higher BMI who intended to eat more healthily. Particularly, we examined: (1) alterations in neurocognitive measures of subjective valuation related to BMI and healthy eating; (2) differences in the neurocognitive valuation for healthy and unhealthy foods and their relation to BMI and healthy eating; (3) and whether we could conceptually replicate prior findings demonstrating differences in neural reactivity to palatable vs. plain foods. To this end, we scanned 105 participants with BMIs ranging from 23 to 42 using fMRI during a willingness-to-pay task that quantifies trial-by-trial valuation of 30 healthy and 30 unhealthy food items. We measured out of lab eating behavior via the Automated Self-Administered 24 H Dietary Assessment Tool, which allowed us to calculate a Healthy Eating Index (HEI). We found that our sample exhibited robust, positive linear relationships between self-reported value and neural responses in regions previously implicated in studies of subjective value, suggesting an intact valuation system. However, we found no relationship between valuation and BMI nor HEI, with Bayes Factor indicating moderate evidence for a null relationship. Separating the food types revealed that healthy eating, as measured by the HEI, was inversely related to subjective valuation of unhealthy foods. Imaging data further revealed a stronger linkage between valuation of healthy (compared to unhealthy) foods and corresponding response in the ventromedial prefrontal cortex (vmPFC), and that the interaction between healthy and unhealthy food valuation in this region is related to HEI. Finally, our results did not replicate reactivity differences demonstrated in prior work, likely due to differences in the mapping between food healthiness and palatability. Together, our findings point to disruptions in the valuation of unhealthy foods in the vmPFC as a potential mechanism influencing healthy eating.
Subject species
homo sapiens
Modality
fMRI-BOLD
Analysis level
group
Cognitive paradigm (task)
Dietary Decisions Task
Map type
U
- e
Health index
- data.europa.eu
excel xlsShareFacebookTwitterEmailClick to copy linkLink copiedCiteNorth Gate II & III - INS (STATBEL - Statistics Belgium), Health index [Dataset]. https://data.europa.eu/data/datasets/2d799e04338f86f4dd29b43f5a13f41ee9c2899e?locale=enexcel xlsAvailable download formatsDataset authored and provided byNorth Gate II & III - INS (STATBEL - Statistics Belgium)DescriptionFrom 1994 onwards The consumer price index, which takes into account price trends of all goods and services, forms the basis of another index: the health index. This health index has been calculated since January 1994 (introduced by the Royal Decree of 24 December 1993). The value of this index is determined by removing a number of products from the consumer price index product basket, in particular alcoholic beverages (bought in a shop or consumed in a bar), tobacco products and motor fuels except for LPG. What is the purpose of the health index? The health index is used for the indexation of housing rents. The health index is defined in the Law of 23 April 2015 on employment promotion (Belgian Official Journal of 27 April 2015). The smoothed health index, also called smoothed index (the average value of the health indexes of the last 4 months) is used as a basis for the indexation of retirement pensions, social security benefits and some salaries and wages. Public wages and social benefits are indexed as soon as the smoothed index reaches a given value, called the central index. The smoothed index is also called moving average. In order to perform a 2% index jump (laid down in the Law of 23 April 2015 on employment promotion), the smoothed health index has been temporarily blocked at its value of March 2015 (100.66). The smoothed health index was then reduced by 2% from April 2015. When the reduced smoothed health index (also called the reference index) had increased again by 2% or in other words when it had exceeded the value of 100.66, the index was no longer blocked. It occurred in April 2016. Since April 2016 the smoothed health index is calculated in the same manner as the reference index and therefore corresponds to the arithmetical mean of the health indexes of the last 4 months multiplied by a factor of 0.98. More information All health indices from 1994 onward can be found through our index-search. Simply enter the desired year and month to view the consumer price index and the health index on all available bases. Health index: list of excluded products (PDF, 83.29 Kb) More information on the index link to public services wages and pensions can be found on the website of the Wages Service of the FPS Finances:https://persopoint.be/fr/services/administration-des-salaires/principes-generaux-de-l-index. The table below shows the health index of the 13 most recent available months. be.STAT allows you to search from 1994 onward. Purpose and brief description The health index was introduced in January 1994 (by Royal Decree of 24 December 1993 implementing the law of 6 January 1989 on the safeguarding of the country's competitiveness) and is derived from the consumer price index. The value of the health index is obtained by excluding a number of products from the product and service basket from the consumer price index, in particular alcoholic beverages (bought in the shop or consumed in a café), tobacco products and motor fuels (with the exception of LPG). Population Belgian private households Frequency Monthly Timing of publication The results are available on the penultimate working day of the reference period Remarks Remark Confidentiality consumer price indices - Although the headings are published in the index and are therefore generally known, the exact definition of the goods and services is kept secret. This confidentiality is required to prevent attempts to manipulate the index, by resolute actions on certain goods and services. The confidentiality of the definitions guarantees the index objectiveness. Metadata Consumer price index - Health index.pdf
Taiwan Import Value Index: Reference Year=2016: Chain Linked
- ceicdata.com
ShareFacebookTwitterEmailClick to copy linkLink copiedCiteCEICdata.com, Taiwan Import Value Index: Reference Year=2016: Chain Linked [Dataset]. https://www.ceicdata.com/en/taiwan/trade-index/import-value-index-reference-year2016-chain-linkedDataset provided byCEIC DataLicenseAttribution 4.0 (CC BY 4.0)https://creativecommons.org/licenses/by/4.0/
License information was derived automaticallyTime period coveredJul 1, 2017 - Jun 1, 2018Area coveredTaiwanVariables measuredMerchandise TradeDescriptionTaiwan Import Value Index: Reference Year=2016: Chain Linked data was reported at 130.410 2016=100 in Oct 2018. This records an increase from the previous number of 125.680 2016=100 for Sep 2018. Taiwan Import Value Index: Reference Year=2016: Chain Linked data is updated monthly, averaging 108.305 2016=100 from Jan 2011 (Median) to Oct 2018, with 94 observations. The data reached an all-time high of 130.410 2016=100 in Oct 2018 and a record low of 73.020 2016=100 in Feb 2016. Taiwan Import Value Index: Reference Year=2016: Chain Linked data remains active status in CEIC and is reported by Ministry of Finance. The data is categorized under Global Database’s Taiwan – Table TW.JA090: Trade Index.
- D
Equity Indexed Life Insurance Market Report | Global Forecast From 2025 To...
- dataintelo.com
csv, pdf, pptxUpdated Jan 7, 2025ShareFacebookTwitterEmailClick to copy linkLink copiedCiteDataintelo (2025). Equity Indexed Life Insurance Market Report | Global Forecast From 2025 To 2033 [Dataset]. https://dataintelo.com/report/equity-indexed-life-insurance-marketpptx, pdf, csvAvailable download formatsDataset updatedJan 7, 2025AuthorsDatainteloLicensehttps://dataintelo.com/privacy-and-policyhttps://dataintelo.com/privacy-and-policy
Time period covered2024 - 2032Area coveredGlobalDescriptionEquity Indexed Life Insurance Market Outlook
The global equity indexed life insurance market size was valued at approximately USD 43.2 billion in 2023 and is projected to reach USD 89.7 billion by 2032, growing at a CAGR of 8.3% during the forecast period. The market is poised for significant growth driven by increasing consumer demand for hybrid insurance products that combine security with potential for higher returns.
One of the primary growth factors for the equity indexed life insurance market is the rising awareness among consumers regarding the benefits of life insurance products that provide equity market-linked returns. Traditional life insurance products often fail to offer competitive returns, especially in low-interest-rate environments. Equity indexed life insurance, however, offers the potential for higher returns by linking the policy's cash value growth to a market index, such as the S&P 500. This hybrid approach appeals to both risk-averse consumers and those seeking more robust financial growth opportunities, thus driving market expansion.
Another key factor fueling the market's growth is the increasing financial literacy among consumers. As people become more educated about various financial products and their benefits, they are more likely to opt for policies that not only provide death benefits but also serve as investment vehicles. Equity indexed life insurance products fill this need by offering a balance between security and growth potential. Additionally, the availability of online resources and tools has made it easier for consumers to compare and understand different insurance products, further contributing to the market's growth.
The aging population is also a significant driver for the equity indexed life insurance market. As people live longer, there is a growing need for financial products that can provide long-term financial security. Equity indexed life insurance products are particularly attractive to older adults who are planning for retirement but still want the opportunity for their investments to grow. The combination of life insurance and investment opportunities makes these products highly appealing to this demographic.
In addition to equity indexed life insurance, Straight Life Insurance remains a fundamental option for many consumers seeking straightforward and reliable coverage. Straight Life Insurance, also known as whole life insurance, provides lifelong protection with fixed premiums and a guaranteed death benefit. This type of insurance is particularly appealing to those who prefer stability and predictability in their financial planning. Unlike equity indexed options, Straight Life Insurance does not link its cash value growth to market indices, offering a more conservative approach to life insurance. This makes it a suitable choice for individuals who prioritize certainty over potential investment gains. As financial literacy continues to rise, consumers are better equipped to choose between these diverse insurance products based on their unique financial goals and risk tolerance.
From a regional perspective, North America holds the largest share in the equity indexed life insurance market due to the high level of consumer awareness and the well-established insurance industry. The region is expected to maintain its dominance throughout the forecast period. However, the Asia Pacific region is anticipated to exhibit the highest growth rate, driven by the rapid economic development, increasing disposable incomes, and a growing middle class. Countries like China and India are expected to be major contributors to this growth, as they have large populations and increasing adoption of insurance products.
Product Type Analysis
The equity indexed life insurance market can be segmented by product type into Universal Life Insurance, Whole Life Insurance, and Term Life Insurance. Universal Life Insurance is a flexible product that allows policyholders to adjust their premiums and death benefits. This flexibility makes it a popular choice among consumers who want a customizable insurance solution. Universal life insurance policies often come with an option to allocate part of the premium towards an investment component, which can grow based on a market index. This feature makes it a hybrid product combining traditional insurance with investment opportunities, thereby attracting a diverse customer base.
Whole Life Insurance, on the other hand
Market value of government bonds in the United Kingdom 2000-2024
- statista.com
- ai-chatbox.pro
Updated Jun 26, 2025ShareFacebookTwitterEmailClick to copy linkLink copiedCiteStatista (2025). Market value of government bonds in the United Kingdom 2000-2024 [Dataset]. https://www.statista.com/statistics/1118604/market-value-of-government-bonds-in-the-united-kingdom/Dataset updatedJun 26, 2025Area coveredUnited KingdomDescriptionThe total market size of gilts in the United Kingdom (UK) amounted to approximately *** trillion British pounds as of December 2024. The majority of gilts in the UK are made up of ****************************.
Quarterly value of Bank of England sterling indexed long-term repo 2014-2022...
- statista.com
- ai-chatbox.pro
Updated Feb 22, 2024ShareFacebookTwitterEmailClick to copy linkLink copiedCiteStatista (2024). Quarterly value of Bank of England sterling indexed long-term repo 2014-2022 [Dataset]. https://www.statista.com/statistics/1422463/bank-of-england-value-of-indexed-long-term-repo/Dataset updatedFeb 22, 2024Area coveredUnited KingdomDescriptionThe total outstanding amounts of the Bank of England's sterling-indexed long-term repo (ILTR) operation fluctuated significantly between 2014 and 2022. In the third quarter of 2022, ILTR amounted to roughly three billion British pounds. ILTR is a regular market-wide operation and a part of the Bank of England's liquidity framework. It allows market participants to borrow central bank reserves (cash) for a six-month period in exchange for other, less liquid assets (collateral).
- F
All-Transactions House Price Index for Austin-Round Rock-Georgetown, TX...
- fred.stlouisfed.org
jsonUpdated May 27, 2025ShareFacebookTwitterEmailClick to copy linkLink copiedCite(2025). All-Transactions House Price Index for Austin-Round Rock-Georgetown, TX (MSA) [Dataset]. https://fred.stlouisfed.org/series/ATNHPIUS12420QjsonAvailable download formatsDataset updatedMay 27, 2025Licensehttps://fred.stlouisfed.org/legal/#copyright-public-domainhttps://fred.stlouisfed.org/legal/#copyright-public-domain
Area coveredGeorgetown, Austin Metropolitan Area, TexasDescriptionGraph and download economic data for All-Transactions House Price Index for Austin-Round Rock-Georgetown, TX (MSA) (ATNHPIUS12420Q) from Q2 1977 to Q1 2025 about Austin, appraisers, HPI, TX, housing, price index, indexes, price, and USA.
Finland - Debt sec, inflation-linked, issued by residents, in all markets at...
- data.bis.org
csv, xlsUpdated Jan 20, 2024+ more versionsShareFacebookTwitterEmailClick to copy linkLink copiedCiteBank for International Settlements (2024). Finland - Debt sec, inflation-linked, issued by residents, in all markets at all original maturities denominated in all currencies at nominal value stocks [Dataset]. https://data.bis.org/topics/IDS/BIS,WS_NA_SEC_DSS,1.0/Q.N.FI.XW.S1.S1.N.L.LE.F3VRA.T._Z.EUR._T.N.V.N._Tcsv, xlsAvailable download formatsDataset updatedJan 20, 2024Licensehttps://data.bis.org/help/legalhttps://data.bis.org/help/legal
DescriptionFinland - Debt sec, inflation-linked, issued by residents, in all markets at all original maturities denominated in all currencies at nominal value stocks
France - Debt sec, inflation-linked, issued by central gov, in all markets...
- data.bis.org
csv, xlsShareFacebookTwitterEmailClick to copy linkLink copiedCiteBank for International Settlements, France - Debt sec, inflation-linked, issued by central gov, in all markets at all original maturities denominated in all currencies at nominal value stocks [Dataset]. https://data.bis.org/topics/DSS/BIS,WS_NA_SEC_DSS,1.0/Q.N.FR.XW.S1311.S1.N.L.LE.F3VRA.T._Z.EUR._T.N.V.N._Txls, csvAvailable download formatsLicensehttps://data.bis.org/help/legalhttps://data.bis.org/help/legal
Area coveredFranceDescriptionFrance - Debt sec, inflation-linked, issued by central gov, in all markets at all original maturities denominated in all currencies at nominal value stocks
Total indexed greenhouse gas emissions in Turkey 2009 to 2020
- statista.com
Updated Jun 18, 2025ShareFacebookTwitterEmailClick to copy linkLink copiedCiteStatista (2025). Total indexed greenhouse gas emissions in Turkey 2009 to 2020 [Dataset]. https://www.statista.com/statistics/672347/total-indexed-greenhouse-gas-emissions-in-turkey/Dataset updatedJun 18, 2025Area coveredTurkeyDescriptionThe total greenhouse gas emissions index in Turkey saw no significant changes in 2020 in comparison to the previous year 2019 and remained at around 240.5 points. The index shows the total greenhouse gas emissions in CO2 equivalent with the reference year 1990. Therefore, it measures total national emissions (from both ESD and ETS sectors) including international aviation of the so called Kyoto basket of greenhouse gases, including carbon dioxide (CO2), methane (CH4), nitrous oxide (N2O), and the so-called F-gases (hydrofluorocarbons, perfluorocarbons, nitrogen triflouride (NF3) and sulphur hexafluoride (SF6)) from all sectors of the GHG emission inventories (including international aviation and indirect CO2).Find more statistics on other topics about Turkey with key insights such as GGE from the energy sector, GGE from industrial processing, GGE from the agriculture sector, and GGE from the transport sector.
Netherlands - Debt sec, inflation-linked, issued by residents, in all...
- data.bis.org
csv, xlsUpdated Jan 25, 2024+ more versionsShareFacebookTwitterEmailClick to copy linkLink copiedCiteBank for International Settlements (2024). Netherlands - Debt sec, inflation-linked, issued by residents, in all markets at all original maturities denominated in all currencies at nominal value stocks [Dataset]. https://data.bis.org/topics/DSS/BIS,WS_NA_SEC_DSS,1.0/Q.N.NL.XW.S1.S1.N.L.LE.F3VRA.T._Z.EUR._T.N.V.N._Tcsv, xlsAvailable download formatsDataset updatedJan 25, 2024Licensehttps://data.bis.org/help/legalhttps://data.bis.org/help/legal
DescriptionNetherlands - Debt sec, inflation-linked, issued by residents, in all markets at all original maturities denominated in all currencies at nominal value stocks
FacebookTwitterAttribution 4.0 (CC BY 4.0)https://creativecommons.org/licenses/by/4.0/
License information was derived automatically
United Kingdom Govt Secs: Gross Issuance: Market Value: Index Linked Gilts data was reported at 664.784 GBP mn in Mar 2018. This records an increase from the previous number of 656.350 GBP mn for Dec 2017. United Kingdom Govt Secs: Gross Issuance: Market Value: Index Linked Gilts data is updated quarterly, averaging 267.695 GBP mn from Mar 2004 (Median) to Mar 2018, with 57 observations. The data reached an all-time high of 664.784 GBP mn in Mar 2018 and a record low of 88.432 GBP mn in Mar 2004. United Kingdom Govt Secs: Gross Issuance: Market Value: Index Linked Gilts data remains active status in CEIC and is reported by Debt Management Office. The data is categorized under Global Database’s UK – Table UK.Z016: Debt Management Office: Debt Securities Statistics.