UK House Price Index: data downloads July 2025
- gov.uk
Updated Sep 17, 2025+ more versions Share
Share Facebook
 Twitter
 EmailClick to copy linkLink copiedCiteHM Land Registry (2025). UK House Price Index: data downloads July 2025 [Dataset]. https://www.gov.uk/government/statistical-data-sets/uk-house-price-index-data-downloads-july-2025Dataset updatedSep 17, 2025AuthorsHM Land RegistryArea coveredUnited KingdomDescription
The UK House Price Index is a National Statistic.
Create your report
Download the full UK House Price Index data below, or use our tool to https://landregistry.data.gov.uk/app/ukhpi?utm_medium=GOV.UK&utm_source=datadownload&utm_campaign=tool&utm_term=9.30_17_09_25">create your own bespoke reports.
Download the data
Datasets are available as CSV files. Find out about republishing and making use of the data.
Full file
This file includes a derived back series for the new UK HPI. Under the UK HPI, data is available from 1995 for England and Wales, 2004 for Scotland and 2005 for Northern Ireland. A longer back series has been derived by using the historic path of the Office for National Statistics HPI to construct a series back to 1968.
Download the full UK HPI background file:
- https://publicdata.landregistry.gov.uk/market-trend-data/house-price-index-data/UK-HPI-full-file-2025-07.csv?utm_medium=GOV.UK&utm_source=datadownload&utm_campaign=full_fil&utm_term=9.30_17_09_25">UK HPI full file (CSV, 33KB)
Individual attributes files
If you are interested in a specific attribute, we have separated them into these CSV files:
-
https://publicdata.landregistry.gov.uk/market-trend-data/house-price-index-data/Average-prices-2025-07.csv?utm_medium=GOV.UK&utm_source=datadownload&utm_campaign=average_price&utm_term=9.30_17_09_25">Average price (CSV, 7.1KB)
-
https://publicdata.landregistry.gov.uk/market-trend-data/house-price-index-data/Average-prices-Property-Type-2025-07.csv?utm_medium=GOV.UK&utm_source=datadownload&utm_campaign=average_price_property_price&utm_term=9.30_17_09_25">Average price by property type (CSV, 15.5KB)
-
https://publicdata.landregistry.gov.uk/market-trend-data/house-price-index-data/Cash-mortgage-sales-2025-07.csv?utm_medium=GOV.UK&utm_source=datadownload&utm_campaign=cash_mortgage-sales&utm_term=9.30_17_09_25">Cash mortgage sales (CSV, 5KB)
-
https://publicdata.landregistry.gov.uk/market-trend-data/house-price-index-data/First-Time-Buyer-Former-Owner-Occupied-2025-07.csv?utm_medium=GOV.UK&utm_source=datadownload&utm_campaign=FTNFOO&utm_term=9.30_17_09_25">First time buyer and former owner occupier (CSV, 4.6KB)
-
https://publicdata.landregistry.gov.uk/market-trend-data/house-price-index-data/New-and-Old-2025-07.csv?utm_medium=GOV.UK&utm_source=datadownload&utm_campaign=new_build&utm_term=9.30_17_09_25">New build and existing resold property (CSV, 11KB)
-
https://publicdata.landregistry.gov.uk/market-trend-data/house-price-index-data/Indices-seasonally-adjusted-2025-07.csv?utm_medium=GOV.UK&utm_source=datadownload&utm_campaign=index_season_adjusted&utm_term=9.30_17_09_25">Index seasonally adjusted (CSV, 197KB)
-
https://publicdata.landregistry.gov.uk/market-trend-data/house-price-index-data/Average-price-seasonally-adjusted-2025-07.csv?utm_medium=GOV.UK&utm_source=datadownload&utm_campaign=average-price_season_adjusted&utm_term=9.30_17_09_25">Average price seasonally adjusted (CSV, 207KB)
-
https://publicdata.landregistry.gov.uk/market-trend-data/house-price-index-data/Repossession-2025-07.csv?utm_medium=GOV.UK&utm_source=datadownload&utm_campaign=repossession&utm_term=9.30_17_09_25">Repossessions (CSV, 44KB)
For more information about the data in these files, see <a href="https://www.gov.uk/government/publications/about-the-uk-house-price-index/about-the-uk-house-price-index#data-ta
- c
Climate extreme indices and heat stress indicators derived from CMIP6 global...
- cds.climate.copernicus.eu
netcdfUpdated Jan 31, 2025ShareFacebookTwitterEmailClick to copy linkLink copiedCiteECMWF (2025). Climate extreme indices and heat stress indicators derived from CMIP6 global climate projections [Dataset]. http://doi.org/10.24381/cds.776e08bdnetcdfAvailable download formatsUnique identifierhttps://doi.org/10.24381/cds.776e08bdDataset updatedJan 31, 2025Dataset authored and provided byECMWFLicensehttps://object-store.os-api.cci2.ecmwf.int:443/cci2-prod-catalogue/licences/cicero-cmip6-indicators-licence/cicero-cmip6-indicators-licence_ba997e52f2423143e053ae30684aaaee1769d2e827611938366112bedccac5a1.pdfhttps://object-store.os-api.cci2.ecmwf.int:443/cci2-prod-catalogue/licences/cicero-cmip6-indicators-licence/cicero-cmip6-indicators-licence_ba997e52f2423143e053ae30684aaaee1769d2e827611938366112bedccac5a1.pdf
DescriptionThe dataset provides climate extreme indices related to temperature and precipitation as defined by the Expert Team on Climate Change Detection and Indices (ETCCDI), as well as selected heat stress indicators (HSI). The indices are provided for historical and future climate projections (SSP1-2.6, SSP2-4.5, SSP3-7.0, SSP5-8.5) included in the Coupled Model Intercomparison Project Phase 6 (CMIP6) and used in the 6th Assessment Report of the Intergovernmental Panel on Climate Change (IPCC). This dataset provides a comprehensive source of pre-calculated and consistent ETCCDI and heat stress indicators commonly used by the climate science and impact communities. The majority of models used in this catalogue entry are now available in the Climate Data Store though the indices offered in this entry additionally include ensemble members obtained from the Earth System Grid Federation. The indices are calculated from CMIP6 models that have the necessary daily resolved data for both historical and at least two of the future projections. In addition, four of the chosen models contained a large number of ensemble members in order to enable the estimation of the associated uncertainty in the spread of model outcomes when calculating the ETCCDI indices (CanESM5, EC-Earth3, MIROC6 and MPI-ESM1-2-LR). All the ETCCDI indices in this dataset are calculated using the climdex.pcic R package, which was developed, evaluated and approved by the ETCCDI. To facilitate the usage of heat stress indicators in combination with thresholds on absolute values, this dataset additionally provides bias-adjusted heat stress indicators. Bias adjustment is carried out using the ISIMIP3b bias-adjustment method and employs the WATCH Forcing Data methodology applied to ERA5 (WFDE5) dataset as reference. Providing both pre-calculated bias-adjusted data and data without bias adjustment is of great value for climate and impact studies since the calculation of these datasets also are computationally expensive. The WFDE5 dataset is also available in the Climate Data Store. The heat stress indicators combine near-surface air temperature, near-surface specific humidity, and surface air pressure to give indications of adverse effects of heat on human health. Other variables like wind or solar radiation are not considered, and the selected heat stress indicators thus represent indoor conditions or calm conditions in the shade. This dataset was produced on behalf of the Copernicus Climate Change Service.
- a
Statistically downscaled climate indices from CMIP6 global climate models...
- catalogue.arctic-sdi.org
- data.urbandatacentre.ca
- +2more
Updated May 10, 2025+ more versionsShareFacebookTwitterEmailClick to copy linkLink copiedCite(2025). Statistically downscaled climate indices from CMIP6 global climate models (CanDCS-U6 & CanDCS-M6) [Dataset]. https://catalogue.arctic-sdi.org/geonetwork/srv/search?keyword=Statistical%20analysisDataset updatedMay 10, 2025DescriptionEnvironment and Climate Change Canada’s (ECCC) Climate Research Division (CRD) and the Pacific Climate Impacts Consortium (PCIC) previously produced statistically downscaled climate scenarios based on simulations from climate models that participated in the Coupled Model Intercomparison Project phase 5 (CMIP5) in 2015. ECCC and PCIC have now updated the CMIP5-based downscaled scenarios with two new sets of downscaled scenarios based on the next generation of climate projections from the Coupled Model Intercomparison Project phase 6 (CMIP6). The scenarios are named Canadian Downscaled Climate Scenarios–Univariate method from CMIP6 (CanDCS-U6) and Canadian Downscaled Climate Scenarios–Multivariate method from CMIP6 (CanDCS-M6). CMIP6 climate projections are based on both updated global climate models and new emissions scenarios called “Shared Socioeconomic Pathways” (SSPs). Statistically downscaled datasets have been produced from 26 CMIP6 global climate models (GCMs) under three different emission scenarios (i.e., SSP1-2.6, SSP2-4.5, and SSP5-8.5), with PCIC later adding SSP3-7.0 to the CanDCS-M6 dataset. The CanDCS-U6 was downscaled using the Bias Correction/Constructed Analogues with Quantile mapping version 2 (BCCAQv2) procedure, and the CanDCS-M6 was downscaled using the N-dimensional Multivariate Bias Correction (MBCn) method. The CanDCS-U6 dataset was produced using the same downscaling target data (NRCANmet) as the CMIP5-based downscaled scenarios, while the CanDCS-M6 dataset implements a new target dataset (ANUSPLIN and PNWNAmet blended dataset). Statistically downscaled individual model output and ensembles are available for download. Downscaled climate indices are available across Canada at 10km grid spatial resolution for the 1950-2014 historical period and for the 2015-2100 period following each of the three emission scenarios. A total of 31 climate indices have been calculated using the CanDCS-U6 and CanDCS-M6 datasets. The climate indices include 27 Climdex indices established by the Expert Team on Climate Change Detection and Indices (ETCCDI) and 4 additional indices that are slightly modified from the Climdex indices. These indices are calculated from daily precipitation and temperature values from the downscaled simulations and are available at annual or monthly temporal resolution, depending on the index. Monthly indices are also available in seasonal and annual versions. Note: projected future changes by statistically downscaled products are not necessarily more credible than those by the underlying climate model outputs. In many cases, especially for absolute threshold-based indices, projections based on downscaled data have a smaller spread because of the removal of model biases. However, this is not the case for all indices. Downscaling from GCM resolution to the fine resolution needed for impacts assessment increases the level of spatial detail and temporal variability to better match observations. Since these adjustments are GCM dependent, the resulting indices could have a wider spread when computed from downscaled data as compared to those directly computed from GCM output. In the latter case, it is not the downscaling procedure that makes future projection more uncertain; rather, it is indicative of higher variability associated with finer spatial scale. Individual model datasets and all related derived products are subject to the terms of use (https://pcmdi.llnl.gov/CMIP6/TermsOfUse/TermsOfUse6-1.html) of the source organization.
- F
S&P 500
- fred.stlouisfed.org
jsonUpdated Sep 19, 2025ShareFacebookTwitterEmailClick to copy linkLink copiedCite(2025). S&P 500 [Dataset]. https://fred.stlouisfed.org/series/SP500jsonAvailable download formatsDataset updatedSep 19, 2025Licensehttps://fred.stlouisfed.org/legal/#copyright-pre-approvalhttps://fred.stlouisfed.org/legal/#copyright-pre-approval
DescriptionView data of the S&P 500, an index of the stocks of 500 leading companies in the US economy, which provides a gauge of the U.S. equity market.
- F
NASDAQ Composite Index
- fred.stlouisfed.org
jsonUpdated Sep 18, 2025+ more versionsShareFacebookTwitterEmailClick to copy linkLink copiedCite(2025). NASDAQ Composite Index [Dataset]. https://fred.stlouisfed.org/series/NASDAQCOMjsonAvailable download formatsDataset updatedSep 18, 2025Licensehttps://fred.stlouisfed.org/legal/#copyright-citation-requiredhttps://fred.stlouisfed.org/legal/#copyright-citation-required
DescriptionGraph and download economic data for NASDAQ Composite Index (NASDAQCOM) from 1971-02-05 to 2025-09-18 about composite, NASDAQ, stock market, indexes, and USA.
- F
Consumer Price Index: All Items: Total for India
- fred.stlouisfed.org
jsonUpdated Apr 10, 2024+ more versionsShareFacebookTwitterEmailClick to copy linkLink copiedCite(2024). Consumer Price Index: All Items: Total for India [Dataset]. https://fred.stlouisfed.org/series/CPALTT01INM657NjsonAvailable download formatsDataset updatedApr 10, 2024Licensehttps://fred.stlouisfed.org/legal/#copyright-citation-requiredhttps://fred.stlouisfed.org/legal/#copyright-citation-required
Area coveredIndiaDescriptionGraph and download economic data for Consumer Price Index: All Items: Total for India (CPALTT01INM657N) from Feb 1957 to Jan 2024 about India, all items, CPI, price index, indexes, and price.
- F
Dow Jones Industrial Average
- fred.stlouisfed.org
jsonUpdated Sep 19, 2025+ more versionsShareFacebookTwitterEmailClick to copy linkLink copiedCite(2025). Dow Jones Industrial Average [Dataset]. https://fred.stlouisfed.org/series/DJIAjsonAvailable download formatsDataset updatedSep 19, 2025Licensehttps://fred.stlouisfed.org/legal/#copyright-pre-approvalhttps://fred.stlouisfed.org/legal/#copyright-pre-approval
DescriptionGraph and download economic data for Dow Jones Industrial Average (DJIA) from 2015-09-21 to 2025-09-19 about stock market, average, industry, and USA.
- h
browsecomp-plus-indexes
- huggingface.co
Updated Sep 4, 2025ShareFacebookTwitterEmailClick to copy linkLink copiedCiteTevatron (2025). browsecomp-plus-indexes [Dataset]. https://huggingface.co/datasets/Tevatron/browsecomp-plus-indexesDataset updatedSep 4, 2025Dataset authored and provided byTevatronLicenseMIT Licensehttps://opensource.org/licenses/MIT
License information was derived automaticallyDescriptionBM25, embedding index used in BrowseComp-Plus. For downloading the index: huggingface-cli download Tevatron/browsecomp-plus-indexes --repo-type=dataset --include="bm25/*" --local-dir ./indexes huggingface-cli download Tevatron/browsecomp-plus-indexes --repo-type=dataset --include="qwen3-embedding-0.6b/*" --local-dir ./indexes huggingface-cli download Tevatron/browsecomp-plus-indexes --repo-type=dataset --include="qwen3-embedding-4b/*" --local-dir ./indexes huggingface-cli download… See the full description on the dataset page: https://huggingface.co/datasets/Tevatron/browsecomp-plus-indexes.
- F
Dow-Jones Industrial Stock Price Index for United States
- fred.stlouisfed.org
jsonUpdated Aug 15, 2012+ more versionsShareFacebookTwitterEmailClick to copy linkLink copiedCite(2012). Dow-Jones Industrial Stock Price Index for United States [Dataset]. https://fred.stlouisfed.org/series/M1109BUSM293NNBRjsonAvailable download formatsDataset updatedAug 15, 2012Licensehttps://fred.stlouisfed.org/legal/#copyright-citation-requiredhttps://fred.stlouisfed.org/legal/#copyright-citation-required
Area coveredUnited StatesDescriptionGraph and download economic data for Dow-Jones Industrial Stock Price Index for United States (M1109BUSM293NNBR) from Dec 1914 to Dec 1968 about stock market, industry, price index, indexes, price, and USA.
- F
Global Price Index of All Commodities
- fred.stlouisfed.org
jsonUpdated Jul 18, 2025+ more versionsShareFacebookTwitterEmailClick to copy linkLink copiedCite(2025). Global Price Index of All Commodities [Dataset]. https://fred.stlouisfed.org/series/PALLFNFINDEXQjsonAvailable download formatsDataset updatedJul 18, 2025Licensehttps://fred.stlouisfed.org/legal/#copyright-citation-requiredhttps://fred.stlouisfed.org/legal/#copyright-citation-required
DescriptionGraph and download economic data for Global Price Index of All Commodities (PALLFNFINDEXQ) from Q1 2003 to Q2 2025 about World, commodities, price index, indexes, and price.
- g
AI Global Index Dataset
- gts.ai
jsonUpdated Oct 8, 2024+ more versionsShareFacebookTwitterEmailClick to copy linkLink copiedCiteGTS (2024). AI Global Index Dataset [Dataset]. https://gts.ai/dataset-download/ai-global-index-dataset/jsonAvailable download formatsDataset updatedOct 8, 2024Dataset provided byGLOBOSE TECHNOLOGY SOLUTIONS PRIVATE LIMITEDAuthorsGTSLicenseCC0 1.0 Universal Public Domain Dedicationhttps://creativecommons.org/publicdomain/zero/1.0/
License information was derived automaticallyDescriptionExplore the AI Global Index Dataset, which benchmarks 62 countries based on AI investment, innovation, and implementation.
- F
CBOE Volatility Index: VIX
- fred.stlouisfed.org
jsonUpdated Sep 19, 2025+ more versionsShareFacebookTwitterEmailClick to copy linkLink copiedCite(2025). CBOE Volatility Index: VIX [Dataset]. https://fred.stlouisfed.org/series/VIXCLSjsonAvailable download formatsDataset updatedSep 19, 2025Licensehttps://fred.stlouisfed.org/legal/#copyright-citation-requiredhttps://fred.stlouisfed.org/legal/#copyright-citation-required
DescriptionGraph and download economic data for CBOE Volatility Index: VIX (VIXCLS) from 1990-01-02 to 2025-09-18 about VIX, volatility, stock market, and USA.
UK House Price Index: data downloads January 2020
- gov.uk
Updated Mar 25, 2020+ more versionsShareFacebookTwitterEmailClick to copy linkLink copiedCiteHM Land Registry (2020). UK House Price Index: data downloads January 2020 [Dataset]. https://www.gov.uk/government/statistical-data-sets/uk-house-price-index-data-downloads-january-2020Dataset updatedMar 25, 2020AuthorsHM Land RegistryArea coveredUnited KingdomDescriptionThe UK House Price Index is a National Statistic.
Data error
Average price by property type data for Northern Ireland was published with errors between July 2018 and September 2019. The data was corrected on 18 December 2019.
Create your report
Download the full UK House Price Index data below, or use our tool to http://landregistry.data.gov.uk/app/ukhpi?utm_medium=GOV.UK&utm_source=datadownload&utm_campaign=tool&utm_term=9.30_25_03_20" class="govuk-link">create your own bespoke reports.
Download the data
Datasets are available as CSV files. Find out about republishing and making use of the data.
Full file
This file includes a derived back series for the new UK HPI. Under the UK HPI, data is available from 1995 for England and Wales, 2004 for Scotland and 2005 for Northern Ireland. A longer back series has been derived by using the historic path of the Office for National Statistics HPI to construct a series back to 1968.
Download the full UK HPI background file:
- http://publicdata.landregistry.gov.uk/market-trend-data/house-price-index-data/UK-HPI-full-file-2020-01.csv?utm_medium=GOV.UK&utm_source=datadownload&utm_campaign=full_fil&utm_term=9.30_25_03_20" class="govuk-link">UK HPI full file (CSV, 57MB)
Individual attributes files
If you are interested in a specific attribute, we have separated them into these CSV files:
-
http://publicdata.landregistry.gov.uk/market-trend-data/house-price-index-data/Average-prices-2020-01.csv?utm_medium=GOV.UK&utm_source=datadownload&utm_campaign=average_price&utm_term=9.30_25_03_20" class="govuk-link">Average price (CSV, 9MB)
-
http://publicdata.landregistry.gov.uk/market-trend-data/house-price-index-data/Average-prices-Property-Type-2020-01.csv?utm_medium=GOV.UK&utm_source=datadownload&utm_campaign=average_price_property_price&utm_term=9.30_25_03_20" class="govuk-link">Average price by property type (CSV, 27.5MB)
-
http://publicdata.landregistry.gov.uk/market-trend-data/house-price-index-data/Sales-2020-01.csv?utm_medium=GOV.UK&utm_source=datadownload&utm_campaign=sales&utm_term=9.30_25_03_20" class="govuk-link">Sales (CSV, 4.6MB)
-
http://publicdata.landregistry.gov.uk/market-trend-data/house-price-index-data/Cash-mortgage-sales-2020-01.csv?utm_medium=GOV.UK&utm_source=datadownload&utm_campaign=cash_mortgage-sales&utm_term=9.30_25_03_20" class="govuk-link">Cash mortgage sales (CSV, 5.4MB)
-
http://publicdata.landregistry.gov.uk/market-trend-data/house-price-index-data/First-Time-Buyer-Former-Owner-Occupied-2020-01.csv?utm_medium=GOV.UK&utm_source=datadownload&utm_campaign=FTNFOO&utm_term=9.30_25_03_20" class="govuk-link">First time buyer and former owner occupier (CSV, 5.2MB)
-
http://publicdata.landregistry.gov.uk/market-trend-data/house-price-index-data/New-and-Old-2020-01.csv?utm_medium=GOV.UK&utm_source=datadownload&utm_campaign=new_build&utm_term=9.30_25_03_20" class="govuk-link">New build and existing resold property (CSV, 16.6MB)
-
http://publicdata.landregistry.gov.uk/market-trend-data/house-price-index-data/Indices-2020-01.csv?utm_medium=GOV.UK&utm_source=datadownload&utm_campaign=index&utm_term=9.30_25_03_20" class="govuk-link">Index (CSV, 5.8MB)
-
http://publicdata.landregistry.gov.uk/market-trend-data/house-price-index-data/Indices-seasonally-adjusted-2020-01.csv?utm_medium=GOV.UK&utm_source=datadownload&utm_campaign=index_season_adjusted&utm_term=9.30_25_03_20" class="govuk-link">Index seasonally adjusted (CSV, 181KB)
-
http://publicdata.landregistry.gov.uk/market-trend-data/house-price-index-data/Average-price-seasonally-adjusted-2020-01.csv?utm_medium=GOV.UK&utm_source=datadownload&utm_campaign=average-price_season_adjusted&utm_term=9.30_25_03_20" class="govuk-link">Average price seasonally adjusted (CSV, 189KB)
- F
Consumer Price Indices (CPIs, HICPs), COICOP 1999: Consumer Price Index:...
- fred.stlouisfed.org
jsonUpdated Apr 15, 2025+ more versionsShareFacebookTwitterEmailClick to copy linkLink copiedCite(2025). Consumer Price Indices (CPIs, HICPs), COICOP 1999: Consumer Price Index: Total for Sweden [Dataset]. https://fred.stlouisfed.org/series/SWECPIALLMINMEIjsonAvailable download formatsDataset updatedApr 15, 2025Licensehttps://fred.stlouisfed.org/legal/#copyright-citation-requiredhttps://fred.stlouisfed.org/legal/#copyright-citation-required
Area coveredSwedenDescriptionGraph and download economic data for Consumer Price Indices (CPIs, HICPs), COICOP 1999: Consumer Price Index: Total for Sweden (SWECPIALLMINMEI) from Jan 1955 to Mar 2025 about Sweden, all items, CPI, price index, indexes, and price.
- c
Fire danger indices historical data from the Copernicus Emergency Management...
- ewds.climate.copernicus.eu
gribUpdated Sep 22, 2025ShareFacebookTwitterEmailClick to copy linkLink copiedCiteECMWF (2025). Fire danger indices historical data from the Copernicus Emergency Management Service [Dataset]. http://doi.org/10.24381/cds.0e89c522gribAvailable download formatsUnique identifierhttps://doi.org/10.24381/cds.0e89c522Dataset updatedSep 22, 2025Dataset authored and provided byECMWFLicensehttps://object-store.os-api.cci2.ecmwf.int:443/cci2-prod-catalogue/licences/cc-by/cc-by_f24dc630aa52ab8c52a0ac85c03bc35e0abc850b4d7453bdc083535b41d5a5c3.pdfhttps://object-store.os-api.cci2.ecmwf.int:443/cci2-prod-catalogue/licences/cc-by/cc-by_f24dc630aa52ab8c52a0ac85c03bc35e0abc850b4d7453bdc083535b41d5a5c3.pdf
Time period coveredJan 3, 1940 - Sep 20, 2025DescriptionThis data set provides complete historical reconstruction of meteorological conditions favourable to the start, spread and sustainability of fires. The fire danger metrics provided are part of a vast dataset produced by the Copernicus Emergency Management Service for the European Forest Fire Information System (EFFIS). The European Forest Fire Information System incorporates the fire danger indices for three different models developed in Canada, United States and Australia. In this dataset the fire danger indices are calculated using weather forecast from historical simulations provided by ECMWF ERA5 reanalysis. ERA5 by combining model data and a vast set of quality controlled observations provides a globally complete and consistent data-set and is regarded as a good proxy for observed atmospheric conditions. The selected data records in this data set are regularly extended with time as ERA5 forcing data become available. This dataset is produced by ECMWF in its role of the computational centre for fire danger forecast of the CEMS, on behalf of the Joint Research Centre which is the managing entity of the service.
Upwelling Index, 48N 125W, 6-hourly
- catalog.data.gov
- datasets.ai
- +2more
Updated Jun 10, 2023+ more versionsShareFacebookTwitterEmailClick to copy linkLink copiedCiteNOAA/SWFSC Environmental Research Division (Point of Contact) (2023). Upwelling Index, 48N 125W, 6-hourly [Dataset]. https://catalog.data.gov/dataset/upwelling-index-48n-125w-6-hourlyDataset updatedJun 10, 2023DescriptionUpwelling index computed from 1-degree FNMOC sea level pressure for 15 locations off the North American West Coast at each 3 degrees of latitude from 21N to 60N. The coastal Upwelling Index is an index of the strength of the wind forcing on the ocean which has been used in many studies of the effects of ocean variability on the reproductive and recruitment success of many fish and invertebrate species.
- d
Standard and Poor's (S&P) 500 Index Data including Dividend, Earnings and...
- datahub.io
- economagic.com
Updated Feb 1, 2002+ more versionsShareFacebookTwitterEmailClick to copy linkLink copiedCite(2002). Standard and Poor's (S&P) 500 Index Data including Dividend, Earnings and P/E Ratio [Dataset]. https://datahub.io/core/s-and-p-500Dataset updatedFeb 1, 2002LicenseODC Public Domain Dedication and Licence (PDDL) v1.0http://www.opendatacommons.org/licenses/pddl/1.0/
License information was derived automaticallyDescriptionS&P 500 index data including level, dividend, earnings and P/E ratio on a monthly basis since 1870. The S&P 500 (Standard and Poor's 500) is a free-float, capitalization-weighted index of the top ...
- F
Consumer Price Index: All Items: Total for Denmark
- fred.stlouisfed.org
jsonUpdated Jan 12, 2024+ more versionsShareFacebookTwitterEmailClick to copy linkLink copiedCite(2024). Consumer Price Index: All Items: Total for Denmark [Dataset]. https://fred.stlouisfed.org/series/DNKCPALTT01IXNBMjsonAvailable download formatsDataset updatedJan 12, 2024Licensehttps://fred.stlouisfed.org/legal/#copyright-citation-requiredhttps://fred.stlouisfed.org/legal/#copyright-citation-required
Area coveredDenmarkDescriptionGraph and download economic data for Consumer Price Index: All Items: Total for Denmark (DNKCPALTT01IXNBM) from Jan 1967 to Dec 2023 about Denmark, all items, CPI, price index, indexes, and price.
AQI - Air Quality Index
- kaggle.com
Updated Aug 7, 2025ShareFacebookTwitterEmailClick to copy linkLink copiedCiteAzmine Toushik Wasi (2025). AQI - Air Quality Index [Dataset]. http://doi.org/10.34740/kaggle/ds/2354989CroissantCroissant is a format for machine-learning datasets. Learn more about this at mlcommons.org/croissant.Unique identifierhttps://doi.org/10.34740/kaggle/ds/2354989Dataset updatedAug 7, 2025AuthorsAzmine Toushik WasiLicenseOpen Database License (ODbL) v1.0https://www.opendatacommons.org/licenses/odbl/1.0/
License information was derived automaticallyDescriptionContext
This dataset contains Air Quality Index of most the countries of the world.
Challenges
- Time Series Analysis and Prediction
- Seasonality finding
- Geospatial Analysis
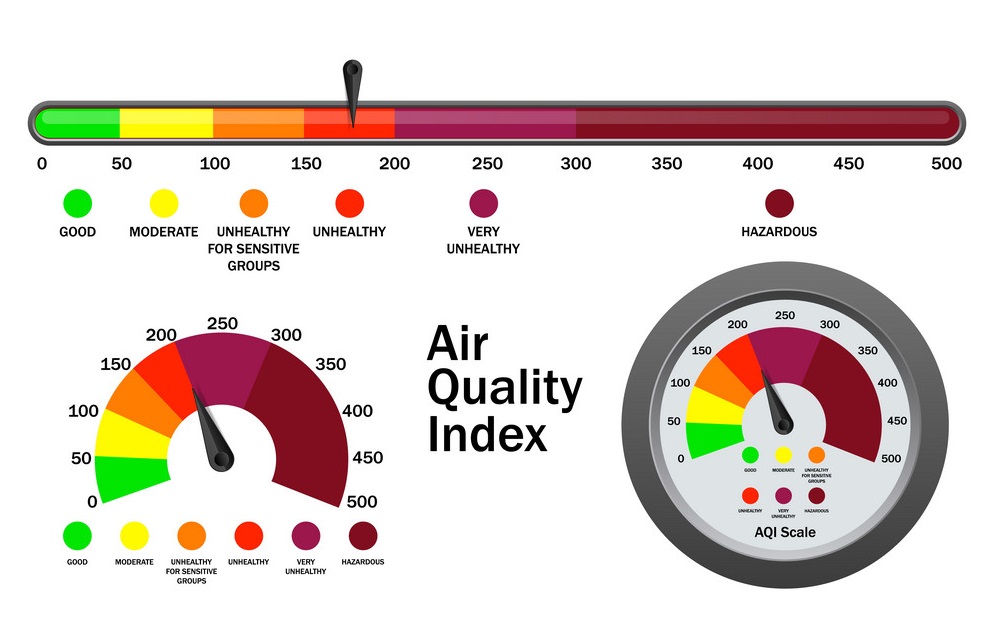
About Air Quality Index (AQI
The Air Quality Index (AQI) is used for reporting daily air quality. It tells you how clean or polluted your air is, and what associated health effects might be a concern for you. The AQI focuses on health effects you may experience within a few hours or days after breathing polluted air.
Content
- data_date.csv - date wise organised
Related Notebooks
Download
- kaggle API Command
!kaggle datasets download -d azminetoushikwasi/aqi-air-quality-index-scheduled-daily-update
Disclaimer
- The data collected are all publicly available and it's intended for educational purposes only.
Acknowledgement
- Cover image taken from internet.
Appreciate, Support, Share
- g
Simple download service (Atom) of the dataset: CS Indices not specifically...
- gimi9.com
+ more versionsShareFacebookTwitterEmailClick to copy linkLink copiedCiteSimple download service (Atom) of the dataset: CS Indices not specifically located | gimi9.com [Dataset]. https://gimi9.com/dataset/eu_fr-120066022-srv-cb433f0a-e688-4b7d-af49-35e599fa6dda/LicenseCC0 1.0 Universal Public Domain Dedicationhttps://creativecommons.org/publicdomain/zero/1.0/
License information was derived automaticallyDescription🇫🇷 프랑스
FacebookTwitterThe UK House Price Index is a National Statistic.
Create your report
Download the full UK House Price Index data below, or use our tool to https://landregistry.data.gov.uk/app/ukhpi?utm_medium=GOV.UK&utm_source=datadownload&utm_campaign=tool&utm_term=9.30_17_09_25">create your own bespoke reports.
Download the data
Datasets are available as CSV files. Find out about republishing and making use of the data.
Full file
This file includes a derived back series for the new UK HPI. Under the UK HPI, data is available from 1995 for England and Wales, 2004 for Scotland and 2005 for Northern Ireland. A longer back series has been derived by using the historic path of the Office for National Statistics HPI to construct a series back to 1968.
Download the full UK HPI background file:
- https://publicdata.landregistry.gov.uk/market-trend-data/house-price-index-data/UK-HPI-full-file-2025-07.csv?utm_medium=GOV.UK&utm_source=datadownload&utm_campaign=full_fil&utm_term=9.30_17_09_25">UK HPI full file (CSV, 33KB)
Individual attributes files
If you are interested in a specific attribute, we have separated them into these CSV files:
-
https://publicdata.landregistry.gov.uk/market-trend-data/house-price-index-data/Average-prices-2025-07.csv?utm_medium=GOV.UK&utm_source=datadownload&utm_campaign=average_price&utm_term=9.30_17_09_25">Average price (CSV, 7.1KB)
-
https://publicdata.landregistry.gov.uk/market-trend-data/house-price-index-data/Average-prices-Property-Type-2025-07.csv?utm_medium=GOV.UK&utm_source=datadownload&utm_campaign=average_price_property_price&utm_term=9.30_17_09_25">Average price by property type (CSV, 15.5KB)
-
https://publicdata.landregistry.gov.uk/market-trend-data/house-price-index-data/Cash-mortgage-sales-2025-07.csv?utm_medium=GOV.UK&utm_source=datadownload&utm_campaign=cash_mortgage-sales&utm_term=9.30_17_09_25">Cash mortgage sales (CSV, 5KB)
-
https://publicdata.landregistry.gov.uk/market-trend-data/house-price-index-data/First-Time-Buyer-Former-Owner-Occupied-2025-07.csv?utm_medium=GOV.UK&utm_source=datadownload&utm_campaign=FTNFOO&utm_term=9.30_17_09_25">First time buyer and former owner occupier (CSV, 4.6KB)
-
https://publicdata.landregistry.gov.uk/market-trend-data/house-price-index-data/New-and-Old-2025-07.csv?utm_medium=GOV.UK&utm_source=datadownload&utm_campaign=new_build&utm_term=9.30_17_09_25">New build and existing resold property (CSV, 11KB)
-
https://publicdata.landregistry.gov.uk/market-trend-data/house-price-index-data/Indices-seasonally-adjusted-2025-07.csv?utm_medium=GOV.UK&utm_source=datadownload&utm_campaign=index_season_adjusted&utm_term=9.30_17_09_25">Index seasonally adjusted (CSV, 197KB)
-
https://publicdata.landregistry.gov.uk/market-trend-data/house-price-index-data/Average-price-seasonally-adjusted-2025-07.csv?utm_medium=GOV.UK&utm_source=datadownload&utm_campaign=average-price_season_adjusted&utm_term=9.30_17_09_25">Average price seasonally adjusted (CSV, 207KB)
-
https://publicdata.landregistry.gov.uk/market-trend-data/house-price-index-data/Repossession-2025-07.csv?utm_medium=GOV.UK&utm_source=datadownload&utm_campaign=repossession&utm_term=9.30_17_09_25">Repossessions (CSV, 44KB)
For more information about the data in these files, see <a href="https://www.gov.uk/government/publications/about-the-uk-house-price-index/about-the-uk-house-price-index#data-ta