- i
Imbalanced Data
- ieee-dataport.org
Updated Aug 23, 2023 Share
Share Facebook
 Twitter
 EmailClick to copy linkLink copiedCiteBlessa Binolin M (2023). Imbalanced Data [Dataset]. https://ieee-dataport.org/documents/imbalanced-data-0Dataset updatedAug 23, 2023AuthorsBlessa Binolin MLicense
Attribution 4.0 (CC BY 4.0)https://creativecommons.org/licenses/by/4.0/
License information was derived automaticallyDescriptionClassification learning on non-stationary data may face dynamic changes from time to time. The major problem in it is the class imbalance and high cost of labeling instances despite drifts. Imbalance is due to lower number of samples in the minority class than the majority class. Imbalanced data results in the misclassification of data points.
Imbalanced dataset for benchmarking
- zenodo.org
- data.niaid.nih.gov
application/gzipUpdated Jan 24, 2020ShareFacebookTwitterEmailClick to copy linkLink copiedCiteGuillaume Lemaitre; Fernando Nogueira; Christos K. Aridas; Dayvid V. R. Oliveira; Guillaume Lemaitre; Fernando Nogueira; Christos K. Aridas; Dayvid V. R. Oliveira (2020). Imbalanced dataset for benchmarking [Dataset]. http://doi.org/10.5281/zenodo.61452application/gzipAvailable download formatsUnique identifierhttps://doi.org/10.5281/zenodo.61452Dataset updatedJan 24, 2020AuthorsGuillaume Lemaitre; Fernando Nogueira; Christos K. Aridas; Dayvid V. R. Oliveira; Guillaume Lemaitre; Fernando Nogueira; Christos K. Aridas; Dayvid V. R. OliveiraLicenseOpen Database License (ODbL) v1.0https://www.opendatacommons.org/licenses/odbl/1.0/
License information was derived automaticallyDescriptionImbalanced dataset for benchmarking
=======================The different algorithms of the `imbalanced-learn` toolbox are evaluated on a set of common dataset, which are more or less balanced. These benchmark have been proposed in [1]. The following section presents the main characteristics of this benchmark.
Characteristics
-------------------|ID |Name |Repository & Target |Ratio |# samples| # features |
|:---:|:----------------------:|--------------------------------------|:------:|:-------------:|:--------------:|
|1 |Ecoli |UCI, target: imU |8.6:1 |336 |7 |
|2 |Optical Digits |UCI, target: 8 |9.1:1 |5,620 |64 |
|3 |SatImage |UCI, target: 4 |9.3:1 |6,435 |36 |
|4 |Pen Digits |UCI, target: 5 |9.4:1 |10,992 |16 |
|5 |Abalone |UCI, target: 7 |9.7:1 |4,177 |8 |
|6 |Sick Euthyroid |UCI, target: sick euthyroid |9.8:1 |3,163 |25 |
|7 |Spectrometer |UCI, target: >=44 |11:1 |531 |93 |
|8 |Car_Eval_34 |UCI, target: good, v good |12:1 |1,728 |6 |
|9 |ISOLET |UCI, target: A, B |12:1 |7,797 |617 |
|10 |US Crime |UCI, target: >0.65 |12:1 |1,994 |122 |
|11 |Yeast_ML8 |LIBSVM, target: 8 |13:1 |2,417 |103 |
|12 |Scene |LIBSVM, target: >one label |13:1 |2,407 |294 |
|13 |Libras Move |UCI, target: 1 |14:1 |360 |90 |
|14 |Thyroid Sick |UCI, target: sick |15:1 |3,772 |28 |
|15 |Coil_2000 |KDD, CoIL, target: minority |16:1 |9,822 |85 |
|16 |Arrhythmia |UCI, target: 06 |17:1 |452 |279 |
|17 |Solar Flare M0 |UCI, target: M->0 |19:1 |1,389 |10 |
|18 |OIL |UCI, target: minority |22:1 |937 |49 |
|19 |Car_Eval_4 |UCI, target: vgood |26:1 |1,728 |6 |
|20 |Wine Quality |UCI, wine, target: <=4 |26:1 |4,898 |11 |
|21 |Letter Img |UCI, target: Z |26:1 |20,000 |16 |
|22 |Yeast _ME2 |UCI, target: ME2 |28:1 |1,484 |8 |
|23 |Webpage |LIBSVM, w7a, target: minority|33:1 |49,749 |300 |
|24 |Ozone Level |UCI, ozone, data |34:1 |2,536 |72 |
|25 |Mammography |UCI, target: minority |42:1 |11,183 |6 |
|26 |Protein homo. |KDD CUP 2004, minority |111:1|145,751 |74 |
|27 |Abalone_19 |UCI, target: 19 |130:1|4,177 |8 |References
----------
[1] Ding, Zejin, "Diversified Ensemble Classifiers for H
ighly Imbalanced Data Learning and their Application in Bioinformatics." Dissertation, Georgia State University, (2011).[2] Blake, Catherine, and Christopher J. Merz. "UCI Repository of machine learning databases." (1998).
[3] Chang, Chih-Chung, and Chih-Jen Lin. "LIBSVM: a library for support vector machines." ACM Transactions on Intelligent Systems and Technology (TIST) 2.3 (2011): 27.
[4] Caruana, Rich, Thorsten Joachims, and Lars Backstrom. "KDD-Cup 2004: results and analysis." ACM SIGKDD Explorations Newsletter 6.2 (2004): 95-108.
- m
Data from: Detailed results of "Insights into imbalance-aware Multilabel...
- data.mendeley.com
- observatorio-cientifico.ua.es
Updated Apr 2, 2024ShareFacebookTwitterEmailClick to copy linkLink copiedCiteJose J. Valero-Mas (2024). Detailed results of "Insights into imbalance-aware Multilabel Prototype Generation mechanisms for k-Nearest Neighbor classification in noisy scenarios" [Dataset]. http://doi.org/10.17632/p6ytjt5rfy.1Unique identifierhttps://doi.org/10.17632/p6ytjt5rfy.1Dataset updatedApr 2, 2024AuthorsJose J. Valero-MasLicenseAttribution 4.0 (CC BY 4.0)https://creativecommons.org/licenses/by/4.0/
License information was derived automaticallyDescriptionDetailed experimental results of the different Prototype Generation strategies for k-Nearest Neighbour classification in multilabel data attending to the particular issues of label-level imbalance and noise:
- Noise-free scenarios
- Study of the considered strategies for addressing label-level imbalance in PG scenarios without induced noise.
- Individual results provided for each corpus.
- Statistical tests (Friedman and Bonferroni-Dunn with significance level of p < 0.01) to assess the improvement compared to the base multilabel PG strategies
Corresponds to Section 5.1 in the manuscript.
Noisy scenarios
Study of the noise robustness capabilities of the proposed strategies.
Individual results provided for each corpus.
Statistical tests (Friedman and Bonferroni-Dunn with significance level of p < 0.01) to assess the improvement compared too the base multilabel PG strategies
Corresponds to Section 5.2 in the manuscript.
Results ignoring the Editing stage
Assessment of the relevance of the Editing stage in the general pipeline.
Individual results provided for each corpus.
Corresponds to Section 5.3 in the manuscript.
- f
This table compares the performance of RF, BR, CC, and CSMLP algorithms...
- plos.figshare.com
xlsUpdated May 28, 2025ShareFacebookTwitterEmailClick to copy linkLink copiedCiteDurgesh Ameta; Surendra Kumar; Rishav Mishra; Laxmidhar Behera; Aniruddha Chakraborty; Tushar Sandhan (2025). This table compares the performance of RF, BR, CC, and CSMLP algorithms across various datasets and features. The evaluation uses Multi-Label Random Under-Sampling (MLRUS) and Multi-Label Random Over-Sampling (MLROS) techniques with sampling ratios of 10%, 20%, and 30%. Micro-averaged F1-scores, Precision and Recall are reported for each algorithm-dataset pair; each cell has F1 score on the top, then Precision in the middle and Recall at the bottom. The last column shows percentage increases from the baseline compared to our best result to provide insights into handling class imbalance and improving classification accuracy. Additionally, the RF, BR, and CC results are compared with the findings from Saini et al. [8] on the IGD_FP dataset. [Dataset]. http://doi.org/10.1371/journal.pone.0322514.t001xlsAvailable download formatsUnique identifierhttps://doi.org/10.1371/journal.pone.0322514.t001Dataset updatedMay 28, 2025Dataset provided byPLOS ONEAuthorsDurgesh Ameta; Surendra Kumar; Rishav Mishra; Laxmidhar Behera; Aniruddha Chakraborty; Tushar SandhanLicenseAttribution 4.0 (CC BY 4.0)https://creativecommons.org/licenses/by/4.0/
License information was derived automaticallyDescriptionThis table compares the performance of RF, BR, CC, and CSMLP algorithms across various datasets and features. The evaluation uses Multi-Label Random Under-Sampling (MLRUS) and Multi-Label Random Over-Sampling (MLROS) techniques with sampling ratios of 10%, 20%, and 30%. Micro-averaged F1-scores, Precision and Recall are reported for each algorithm-dataset pair; each cell has F1 score on the top, then Precision in the middle and Recall at the bottom. The last column shows percentage increases from the baseline compared to our best result to provide insights into handling class imbalance and improving classification accuracy. Additionally, the RF, BR, and CC results are compared with the findings from Saini et al. [8] on the IGD_FP dataset.
- f
Table shows values of imbalance measures for Integrated Dataset (IGD) and...
- figshare.com
xlsUpdated May 28, 2025ShareFacebookTwitterEmailClick to copy linkLink copiedCiteDurgesh Ameta; Surendra Kumar; Rishav Mishra; Laxmidhar Behera; Aniruddha Chakraborty; Tushar Sandhan (2025). Table shows values of imbalance measures for Integrated Dataset (IGD) and Subset of Integrated Dataset (Subset-IGD) for original data, and resampled data using ML-RUS (10%) and ML-ROS (10%). [Dataset]. http://doi.org/10.1371/journal.pone.0322514.t002xlsAvailable download formatsUnique identifierhttps://doi.org/10.1371/journal.pone.0322514.t002Dataset updatedMay 28, 2025Dataset provided byPLOS ONEAuthorsDurgesh Ameta; Surendra Kumar; Rishav Mishra; Laxmidhar Behera; Aniruddha Chakraborty; Tushar SandhanLicenseAttribution 4.0 (CC BY 4.0)https://creativecommons.org/licenses/by/4.0/
License information was derived automaticallyDescriptionTable shows values of imbalance measures for Integrated Dataset (IGD) and Subset of Integrated Dataset (Subset-IGD) for original data, and resampled data using ML-RUS (10%) and ML-ROS (10%).
- P
Office-Home-LMT Dataset
- paperswithcode.com
Updated Feb 2, 2023ShareFacebookTwitterEmailClick to copy linkLink copiedCitePengcheng Xu; Boyu Wang; Charles Ling (2023). Office-Home-LMT Dataset [Dataset]. https://paperswithcode.com/dataset/office-home-lmtDataset updatedFeb 2, 2023AuthorsPengcheng Xu; Boyu Wang; Charles LingDescriptionThe dataset is for research on the label distribution shift between multiple domain adaptations. We use Cl, Pr, and Rw to resample two reverse long-tailed distributions and one Gaussian d for each of them for BTDA with label shift.
Data from: Multitask Modeling with Confidence Using Matrix Factorization and...
- acs.figshare.com
xlsxUpdated Jun 3, 2023ShareFacebookTwitterEmailClick to copy linkLink copiedCiteUlf Norinder; Fredrik Svensson (2023). Multitask Modeling with Confidence Using Matrix Factorization and Conformal Prediction [Dataset]. http://doi.org/10.1021/acs.jcim.9b00027.s001xlsxAvailable download formatsUnique identifierhttps://doi.org/10.1021/acs.jcim.9b00027.s001Dataset updatedJun 3, 2023Dataset provided byACS PublicationsAuthorsUlf Norinder; Fredrik SvenssonLicenseAttribution-NonCommercial 4.0 (CC BY-NC 4.0)https://creativecommons.org/licenses/by-nc/4.0/
License information was derived automaticallyDescriptionMultitask prediction of bioactivities is often faced with challenges relating to the sparsity of data and imbalance between different labels. We propose class conditional (Mondrian) conformal predictors using underlying Macau models as a novel approach for large scale bioactivity prediction. This approach handles both high degrees of missing data and label imbalances while still producing high quality predictive models. When applied to ten assay end points from PubChem, the models generated valid models with an efficiency of 74.0–80.1% at the 80% confidence level with similar performance both for the minority and majority class. Also when deleting progressively larger portions of the available data (0–80%) the performance of the models remained robust with only minor deterioration (reduction in efficiency between 5 and 10%). Compared to using Macau without conformal prediction the method presented here significantly improves the performance on imbalanced data sets.
UVP5 data sorted with EcoTaxa and MorphoCluster
- seanoe.org
- pigma.org
image/*Updated 2020ShareFacebookTwitterEmailClick to copy linkLink copiedCiteRainer Kiko; Simon-Martin Schröder (2020). UVP5 data sorted with EcoTaxa and MorphoCluster [Dataset]. http://doi.org/10.17882/73002image/*Available download formatsUnique identifierhttps://doi.org/10.17882/73002Dataset updated2020Dataset provided bySEANOEAuthorsRainer Kiko; Simon-Martin SchröderLicenseAttribution-NonCommercial 4.0 (CC BY-NC 4.0)https://creativecommons.org/licenses/by-nc/4.0/
License information was derived automaticallyTime period coveredOct 23, 2012 - Aug 7, 2017Area coveredDescriptionhere, we provide plankton image data that was sorted with the web applications ecotaxa and morphocluster. the data set was used for image classification tasks as described in schröder et. al (in preparation) and does not include any geospatial or temporal meta-data.plankton was imaged using the underwater vision profiler 5 (picheral et al. 2010) in various regions of the world's oceans between 2012-10-24 and 2017-08-08.this data publication consists of an archive containing "training.csv" (list of 392k training images for classification, validated using ecotaxa), "validation.csv" (list of 196k validation images for classification, validated using ecotaxa), "unlabeld.csv" (list of 1m unlabeled images), "morphocluster.csv" (1.2m objects validated using morphocluster, a subset of "unlabeled.csv" and "validation.csv") and the image files themselves. the csv files each contain the columns "object_id" (a unique id), "image_fn" (the relative filename), and "label" (the assigned name).the training and validation sets were sorted into 65 classes using the web application ecotaxa (http://ecotaxa.obs-vlfr.fr). this data shows a severe class imbalance; the 10% most populated classes contain more than 80% of the objects and the class sizes span four orders of magnitude. the validation set and a set of additional 1m unlabeled images were sorted during the first trial of morphocluster (https://github.com/morphocluster).the images in this data set were sampled during rv meteor cruises m92, m93, m96, m97, m98, m105, m106, m107, m108, m116, m119, m121, m130, m131, m135, m136, m137 and m138, during rv maria s merian cruises msm22, msm23, msm40 and msm49, during the rv polarstern cruise ps88b and during the fluxes1 experiment with rv sarmiento de gamboa.the following people have contributed to the sorting of the image data on ecotaxa:rainer kiko, tristan biard, benjamin blanc, svenja christiansen, justine courboules, charlotte eich, jannik faustmann, christine gawinski, augustin lafond, aakash panchal, marc picheral, akanksha singh and helena haussin schröder et al. (in preparation), the training set serves as a source for knowledge transfer in the training of the feature extractor. the classification using morphocluster was conducted by rainer kiko. used labels are operational and not yet matched to respective ecotaxa classes.
- P
CI-MNIST Dataset
- paperswithcode.com
Updated Mar 23, 2022+ more versionsShareFacebookTwitterEmailClick to copy linkLink copiedCiteCharan Reddy; Soroush Mehri; Deepak Sharma; Samira Shabanian; Sina Honari (2022). CI-MNIST Dataset [Dataset]. https://paperswithcode.com/dataset/ci-mnistDataset updatedMar 23, 2022AuthorsCharan Reddy; Soroush Mehri; Deepak Sharma; Samira Shabanian; Sina HonariDescriptionCI-MNIST (Correlated and Imbalanced MNIST) is a variant of MNIST dataset with introduced different types of correlations between attributes, dataset features, and an artificial eligibility criterion. For an input image $x$, the label $y \in {1, 0}$ indicates eligibility or ineligibility, respectively, given that $x$ is even or odd. The dataset defines the background colors as the protected or sensitive attribute $s \in {0, 1}$, where blue denotes the unprivileged group and red denotes the privileged group. The dataset was designed in order to evaluate bias-mitigation approaches in challenging setups and be capable of controlling different dataset configurations.
- o
Data from: Financial Fraud Detection Dataset
- opendatabay.com
.undefinedUpdated Jun 25, 2025ShareFacebookTwitterEmailClick to copy linkLink copiedCiteReview Nexus (2025). Financial Fraud Detection Dataset [Dataset]. https://www.opendatabay.com/data/financial/d226c56e-5929-4059-a30d-13632e07b344.undefinedAvailable download formatsDataset updatedJun 25, 2025Dataset authored and provided byReview NexusLicenseOpen Database License (ODbL) v1.0https://www.opendatacommons.org/licenses/odbl/1.0/
License information was derived automaticallyArea coveredFraud Detection & Risk ManagementDescriptionThis dataset is designed to support research and model development in the area of fraud detection. It consists of real-world credit card transactions made by European cardholders over a two-day period in September 2013. Out of 284,807 transactions, 492 are labeled as fraudulent (positive class), making this a highly imbalanced classification problem.
Performance Note:
Due to the extreme class imbalance, standard accuracy metrics are not informative. We recommend using the Area Under the Precision-Recall Curve (AUPRC) or F1-score for model evaluation.
Features:
- Time Series Data: Each row represents a transaction, with the Time feature indicating the number of seconds elapsed since the first transaction.
- Dimensionality Reduction Applied: Features V1 through V28 are anonymized principal components derived from a PCA transformation due to confidentiality constraints.
- Raw Transaction Amount: The Amount field reflects the transaction value, useful for cost-sensitive modeling.
- Binary Classification Target: The Class label is 1 for fraud and 0 for legitimate transactions.
Usage:
- Machine learning model training for fraud detection.
- Evaluation of anomaly detection and imbalanced classification methods.
- Development of cost-sensitive learning approaches using the Amount variable.
Data Summary:
- Total Records: 284,807
- Fraud Cases: 492
- Imbalance Ratio: Fraudulent transactions account for just 0.172% of the dataset.
- Columns: 31 total (28 PCA features, plus Time, Amount, and Class)
License:
The dataset is provided under the CC0 (Public Domain) license, allowing users to freely use, modify, and distribute the data without any restrictions.
Acknowledgements
The dataset has been collected and analysed during a research collaboration of Worldline and the Machine Learning Group (http://mlg.ulb.ac.be) of ULB (Université Libre de Bruxelles) on big data mining and fraud detection. More details on current and past projects on related topics are available on https://www.researchgate.net/project/Fraud-detection-5 and the page of the DefeatFraud project
Please cite the following works:
Andrea Dal Pozzolo, Olivier Caelen, Reid A. Johnson and Gianluca Bontempi. Calibrating Probability with Undersampling for Unbalanced Classification. In Symposium on Computational Intelligence and Data Mining (CIDM), IEEE, 2015
Dal Pozzolo, Andrea; Caelen, Olivier; Le Borgne, Yann-Ael; Waterschoot, Serge; Bontempi, Gianluca. Learned lessons in credit card fraud detection from a practitioner perspective, Expert systems with applications,41,10,4915-4928,2014, Pergamon
Dal Pozzolo, Andrea; Boracchi, Giacomo; Caelen, Olivier; Alippi, Cesare; Bontempi, Gianluca. Credit card fraud detection: a realistic modeling and a novel learning strategy, IEEE transactions on neural networks and learning systems,29,8,3784-3797,2018,IEEE
Dal Pozzolo, Andrea Adaptive Machine learning for credit card fraud detection ULB MLG PhD thesis (supervised by G. Bontempi)
Carcillo, Fabrizio; Dal Pozzolo, Andrea; Le Borgne, Yann-Aël; Caelen, Olivier; Mazzer, Yannis; Bontempi, Gianluca. Scarff: a scalable framework for streaming credit card fraud detection with Spark, Information fusion,41, 182-194,2018,Elsevier
Carcillo, Fabrizio; Le Borgne, Yann-Aël; Caelen, Olivier; Bontempi, Gianluca. Streaming active learning strategies for real-life credit card fraud detection: assessment and visualization, International Journal of Data Science and Analytics, 5,4,285-300,2018,Springer International Publishing
Bertrand Lebichot, Yann-Aël Le Borgne, Liyun He, Frederic Oblé, Gianluca Bontempi Deep-Learning Domain Adaptation Techniques for Credit Cards Fraud Detection, INNSBDDL 2019: Recent Advances in Big Data and Deep Learning, pp 78-88, 2019
Fabrizio Carcillo, Yann-Aël Le Borgne, Olivier Caelen, Frederic Oblé, Gianluca Bontempi Combining Unsupervised and Supervised Learning in Credit Card Fraud Detection Information Sciences, 2019
Yann-Aël Le Borgne, Gianluca Bontempi Reproducible machine Learning for Credit Card Fraud Detection - Practical Handbook
Bertrand Lebichot, Gianmarco Paldino, Wissam Siblini, Liyun He, Frederic Oblé, Gianluca Bontempi Incremental learning strategies for credit cards fraud detection, IInternational Journal of Data Science and Analytics
- f
SHAP Analysis Hyper-Parameters with Descriptions and Impact
- plos.figshare.com
xlsUpdated May 28, 2025ShareFacebookTwitterEmailClick to copy linkLink copiedCiteDurgesh Ameta; Surendra Kumar; Rishav Mishra; Laxmidhar Behera; Aniruddha Chakraborty; Tushar Sandhan (2025). SHAP Analysis Hyper-Parameters with Descriptions and Impact [Dataset]. http://doi.org/10.1371/journal.pone.0322514.t004xlsAvailable download formatsUnique identifierhttps://doi.org/10.1371/journal.pone.0322514.t004Dataset updatedMay 28, 2025Dataset provided byPLOS ONEAuthorsDurgesh Ameta; Surendra Kumar; Rishav Mishra; Laxmidhar Behera; Aniruddha Chakraborty; Tushar SandhanLicenseAttribution 4.0 (CC BY 4.0)https://creativecommons.org/licenses/by/4.0/
License information was derived automaticallyDescriptionSHAP Analysis Hyper-Parameters with Descriptions and Impact
- p
Data from: CXR-LT: Multi-Label Long-Tailed Classification on Chest X-Rays
- physionet.org
Updated Mar 19, 2025+ more versionsShareFacebookTwitterEmailClick to copy linkLink copiedCiteGregory Holste; Mingquan Lin; Song Wang; Yiliang Zhou; Yishu Wei; Hao Chen; Atlas Wang; Yifan Peng (2025). CXR-LT: Multi-Label Long-Tailed Classification on Chest X-Rays [Dataset]. http://doi.org/10.13026/ryj9-x506Unique identifierhttps://doi.org/10.13026/ryj9-x506Dataset updatedMar 19, 2025AuthorsGregory Holste; Mingquan Lin; Song Wang; Yiliang Zhou; Yishu Wei; Hao Chen; Atlas Wang; Yifan PengLicensehttps://github.com/MIT-LCP/license-and-dua/tree/master/draftshttps://github.com/MIT-LCP/license-and-dua/tree/master/drafts
DescriptionChest radiography presents a "long-tailed" distribution of findings, where a few diseases are common, but most are rare. Diagnosis is further complicated by its multi-label nature, as patients often exhibit multiple co-occurring findings. While recent research has attempted to address the long-tailed medical image classification problem, the interplay between class imbalance and label co-occurrence remains underexplored. The CXR-LT 2024 challenge builds on the success of CXR-LT 2023, expanding the dataset of 377,110 chest X-rays (CXRs) to 45 disease labels, including 19 new rare disease findings. This year’s challenge introduces three tasks: (i) long-tailed classification on a large, noisy test set, (ii) long-tailed classification on a manually annotated "gold standard" subset, and (iii) zero-shot generalization to five previously unseen disease findings. CXR-LT 2024 addresses critical challenges in long-tailed, multi-label, and zero-shot learning for medical imaging by synthesizing state-of-the-art solutions from the international research community. Further, our dataset contributions — expanding disease coverage to better reflect real-world clinical settings — offer a valuable resource for future research. This project contains labels from the CXR-LT 2024 and CXR-LT 2023 challenges, as well as a related subset used in the MICCAI 2023 paper, "How Does Pruning Impact Multi-Label Long-Tailed Learning?"
Learning Privacy from Visual Entities - Curated data sets and pre-computed...
- zenodo.org
zipUpdated May 7, 2025ShareFacebookTwitterEmailClick to copy linkLink copiedCiteAlessio Xompero; Alessio Xompero; Andrea Cavallaro; Andrea Cavallaro (2025). Learning Privacy from Visual Entities - Curated data sets and pre-computed visual entities [Dataset]. http://doi.org/10.5281/zenodo.15348506zipAvailable download formatsUnique identifierhttps://doi.org/10.5281/zenodo.15348506Dataset updatedMay 7, 2025AuthorsAlessio Xompero; Alessio Xompero; Andrea Cavallaro; Andrea CavallaroLicenseAttribution 4.0 (CC BY 4.0)https://creativecommons.org/licenses/by/4.0/
License information was derived automaticallyDescriptionThis repository contains the curated image privacy datasets and pre-computed visual entities used in the publication Learning Privacy from Visual Entities by A. Xompero and A. Cavallaro.
[arxiv][code]Curated image privacy data sets
In the article, we trained and evaluated models on the Image Privacy Dataset (IPD) and the PrivacyAlert dataset. The datasets are originally provided by other sources and have been re-organised and curated for this work.
Our curation organises the datasets in a common structure. We updated the annotations and labelled the splits of the data in the annotation file. This avoids having separated folders of images for each data split (training, validation, testing) and allows a flexible handling of new splits, e.g. created with a stratified K-Fold cross-validation procedure. As for the original datasets (PicAlert and PrivacyAlert), we provide the link to the images in bash scripts to download the images. Another bash script re-organises the images in sub-folders with maximum 1000 images in each folder.
Both datasets refer to images publicly available on Flickr. These images have a large variety of content, including sensitive content, seminude people, vehicle plates, documents, private events. Images were annotated with a binary label denoting if the content was deemed to be public or private. As the images are publicly available, their label is mostly public. These datasets have therefore a high imbalance towards the public class. Note that IPD combines two other existing datasets, PicAlert and part of VISPR, to increase the number of private images already limited in PicAlert. Further details in our corresponding https://doi.org/10.48550/arXiv.2503.12464" target="_blank" rel="noopener">publication.
List of datasets and their original source:
- PicAlert [Images occupy 2.4 GB]
- VISPR [Images occupy 49.7 GB]
- PrivacyAlert [Images occupy 1 GB]
Notes:
- For PicAlert and PrivacyAlert, only urls to the original locations in Flickr are available in the Zenodo record
- Collector and authors of the PrivacyAlert dataset selected the images from Flickr under Public Domain license
- Owners of the photos on Flick could have removed the photos from the social media platform
- Running the bash scripts to download the images can incur in the "429 Too Many Requests" status code
Pre-computed visual entitities
Some of the models run their pipeline end-to-end with the images as input, whereas other models require different or additional inputs. These inputs include the pre-computed visual entities (scene types and object types) represented in a graph format, e.g. for a Graph Neural Network. Re-using these pre-computed visual entities allows other researcher to build new models based on these features while avoiding re-computing the same on their own or for each epoch during the training of a model (faster training).
For each image of each dataset, namely PrivacyAlert, PicAlert, and VISPR, we provide the predicted scene probabilities as a .csv file , the detected objects as a .json file in COCO data format, and the node features (visual entities already organised in graph format with their features) as a .json file. For consistency, all the files are already organised in batches following the structure of the images in the datasets folder. For each dataset, we also provide the pre-computed adjacency matrix for the graph data.
Note: IPD is based on PicAlert and VISPR and therefore IPD refers to the scene probabilities and object detections of the other two datasets. Both PicAlert and VISPR must be downloaded and prepared to use IPD for training and testing.
Further details on downloading and organising data can be found in our GitHub repository: https://github.com/graphnex/privacy-from-visual-entities (see ARTIFACT-EVALUATION.md#pre-computed-visual-entitities-)
Enquiries, questions and comments
If you have any enquiries, question, or comments, or you would like to file a bug report or a feature request, use the issue tracker of our GitHub repository.
- f
Table shows the Feature Fusion Results achieved by concatenating different...
- figshare.com
- plos.figshare.com
xlsUpdated May 28, 2025ShareFacebookTwitterEmailClick to copy linkLink copiedCiteDurgesh Ameta; Surendra Kumar; Rishav Mishra; Laxmidhar Behera; Aniruddha Chakraborty; Tushar Sandhan (2025). Table shows the Feature Fusion Results achieved by concatenating different data modalities, taken in pairs and all three together. It also highlights the percentage increase in F1 score of fused features compared to the best single modality result among the fused features. [Dataset]. http://doi.org/10.1371/journal.pone.0322514.t003xlsAvailable download formatsUnique identifierhttps://doi.org/10.1371/journal.pone.0322514.t003Dataset updatedMay 28, 2025Dataset provided byPLOS ONEAuthorsDurgesh Ameta; Surendra Kumar; Rishav Mishra; Laxmidhar Behera; Aniruddha Chakraborty; Tushar SandhanLicenseAttribution 4.0 (CC BY 4.0)https://creativecommons.org/licenses/by/4.0/
License information was derived automaticallyDescriptionTable shows the Feature Fusion Results achieved by concatenating different data modalities, taken in pairs and all three together. It also highlights the percentage increase in F1 score of fused features compared to the best single modality result among the fused features.
- h
Criteo_x2
- huggingface.co
Updated Jul 13, 2024ShareFacebookTwitterEmailClick to copy linkLink copiedCiteRECZOO (2024). Criteo_x2 [Dataset]. https://huggingface.co/datasets/reczoo/Criteo_x2CroissantCroissant is a format for machine-learning datasets. Learn more about this at mlcommons.org/croissant.Dataset updatedJul 13, 2024Dataset authored and provided byRECZOODescriptionCriteo_x2
Dataset description: This dataset employs the Criteo 1TB Click Logs for display advertising, which contains one month of click-through data with billions of data samples. Following the same setting with the AutoGroup work, we select "data 6-12" as the training set while using "day-13" for testing. To reduce label imbalance, we perform negative sub-sampling to keep the positive ratio roughly at 50%. It has 13 numerical feature fields and 26 categorical feature fields. In… See the full description on the dataset page: https://huggingface.co/datasets/reczoo/Criteo_x2.
Image Data Labeling Service Market Report | Global Forecast From 2025 To...
- dataintelo.com
csv, pdf, pptxUpdated Oct 16, 2024ShareFacebookTwitterEmailClick to copy linkLink copiedCiteDataintelo (2024). Image Data Labeling Service Market Report | Global Forecast From 2025 To 2033 [Dataset]. https://dataintelo.com/report/image-data-labeling-service-marketcsv, pdf, pptxAvailable download formatsDataset updatedOct 16, 2024Dataset authored and provided byDatainteloLicensehttps://dataintelo.com/privacy-and-policyhttps://dataintelo.com/privacy-and-policy
Time period covered2024 - 2032Area coveredGlobalDescriptionImage Data Labeling Service Market Outlook
The global image data labeling service market size was valued at approximately USD 1.5 billion in 2023 and is projected to reach around USD 6.1 billion by 2032, exhibiting a robust CAGR of 17.1% during the forecast period. The exponential growth of this market is driven by the increasing demand for high-quality labeled data for machine learning and artificial intelligence applications across various industries.
One of the primary growth factors of the image data labeling service market is the surge in the adoption of artificial intelligence (AI) and machine learning (ML) technologies across multiple sectors. Organizations are increasingly relying on AI and ML to enhance operational efficiency, improve customer experience, and gain competitive advantages. As a result, there is a rising need for accurately labeled data to train these AI and ML models, driving the demand for image data labeling services. Furthermore, advancements in computer vision technology have expanded the scope of image data labeling, making it essential for applications such as autonomous vehicles, facial recognition, and medical imaging.
Another significant factor contributing to market growth is the proliferation of big data. The massive volume of data generated from various sources, including social media, surveillance cameras, and IoT devices, necessitates the need for effective data labeling solutions. Companies are leveraging image data labeling services to manage and analyze these vast datasets efficiently. Additionally, the growing focus on personalized customer experiences in sectors like retail and e-commerce is fueling the demand for labeled data, which helps in understanding customer preferences and behaviors.
Investment in research and development (R&D) activities by key players in the market is also a crucial growth driver. Companies are continuously innovating and developing new techniques to enhance the accuracy and efficiency of image data labeling processes. These advancements not only improve the quality of labeled data but also reduce the time and cost associated with manual labeling. The integration of AI and machine learning algorithms in the labeling process is further boosting the market growth by automating repetitive tasks and minimizing human errors.
From a regional perspective, North America holds the largest market share due to early adoption of advanced technologies and the presence of major AI and ML companies. The region is expected to maintain its dominance during the forecast period, driven by continuous technological advancements and substantial investments in AI research. Asia Pacific is anticipated to witness the highest growth rate due to the rising adoption of AI technologies in countries like China, Japan, and India. The increasing focus on digital transformation and government initiatives to promote AI adoption are significant factors contributing to the regional market growth.
Type Analysis
The image data labeling service market is segmented into three primary types: manual labeling, semi-automatic labeling, and automatic labeling. Manual labeling, which involves human annotators tagging images, is essential for ensuring high accuracy, especially in complex tasks. Despite being time-consuming and labor-intensive, manual labeling is widely used in applications where nuanced understanding and precision are paramount. This segment continues to hold a significant market share due to the reliability it offers. However, the cost and time constraints associated with manual labeling are driving the growth of more advanced labeling techniques.
Semi-automatic labeling combines human intervention with automated processes, providing a balance between accuracy and efficiency. In this approach, algorithms perform initial labeling, and human annotators refine and validate the results. This method significantly reduces the time required for data labeling while maintaining high accuracy levels. The semi-automatic labeling segment is gaining traction as it offers a scalable and cost-effective solution, particularly beneficial for industries dealing with large volumes of data, such as retail and IT.
Automatic labeling, driven by AI and machine learning algorithms, represents the most advanced segment of the market. This approach leverages sophisticated models to autonomously label image data with minimal human intervention. The continuous improvement in AI algorithms, along with the availability of large datasets for training, has enhanced the accuracy and reliability of automatic lab
- N
Affect Label: Amyg Connectivity, Label - Blur: con 0002
- neurovault.org
niftiUpdated Feb 13, 2017+ more versionsShareFacebookTwitterEmailClick to copy linkLink copiedCite(2017). Affect Label: Amyg Connectivity, Label - Blur: con 0002 [Dataset]. http://identifiers.org/neurovault.image:39623niftiAvailable download formatsUnique identifierhttps://identifiers.org/neurovault.image:39623Dataset updatedFeb 13, 2017LicenseCC0 1.0 Universal Public Domain Dedicationhttps://creativecommons.org/publicdomain/zero/1.0/
License information was derived automaticallyDescriptionContrast 2: bl
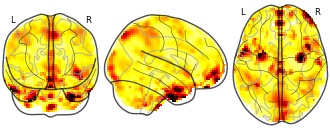
Collection description
Neurodevelopmental Changes Across Adolescence in Viewing and Labeling Dynamic Peer Emotions
Adolescence is a sensitive period of social-affective development, characterized by biological, neurological, and social changes. The field currently conceptualizes these changes in terms of an imbalance between systems supporting reactivity and regulation, specifically nonlinear changes in reactivity networks and linear changes in regulatory networks. Previous research suggests that the labeling or reappraisal of emotion increases activity in lateral prefrontal cortex (LPFC), and decreases activity in amygdala relative to passive viewing of affective stimuli. However, past work in this area has relied heavily on paradigms using static, adult faces, as well as explicit regulation. In the current study, we assessed cross-sectional trends in neural responses to viewing and labeling dynamic peer emotional expressions in adolescent girls 10-23 years old. Our dynamic adolescent stimuli set reliably and robustly recruited key brain regions involved in emotion reactivity (MOFC/vMPFC, bilateral amygdala) and regulation (bilateral dorsal and ventral LPFC). However, contrary to the age-trends predicted by the dominant models in studies of risk/reward, the LPFC showed a nonlinear age trend across adolescence to labeling dynamic peer faces, whereas the MOFC/vMPFC showed a linear decrease with age to viewing dynamic peer faces. There were no significant age trends observed in the amygdala.Subject species
homo sapiens
Map type
Other
Credit Card Fraud Detection
- kaggle.com
- test.researchdata.tuwien.ac.at
- +1more
zipUpdated Mar 23, 2018+ more versionsShareFacebookTwitterEmailClick to copy linkLink copiedCiteMachine Learning Group - ULB (2018). Credit Card Fraud Detection [Dataset]. https://www.kaggle.com/mlg-ulb/creditcardfraudzip(69155672 bytes)Available download formatsDataset updatedMar 23, 2018Dataset authored and provided byMachine Learning Group - ULBLicensehttp://opendatacommons.org/licenses/dbcl/1.0/http://opendatacommons.org/licenses/dbcl/1.0/
DescriptionContext
It is important that credit card companies are able to recognize fraudulent credit card transactions so that customers are not charged for items that they did not purchase.
Content
The dataset contains transactions made by credit cards in September 2013 by European cardholders. This dataset presents transactions that occurred in two days, where we have 492 frauds out of 284,807 transactions. The dataset is highly unbalanced, the positive class (frauds) account for 0.172% of all transactions.
It contains only numerical input variables which are the result of a PCA transformation. Unfortunately, due to confidentiality issues, we cannot provide the original features and more background information about the data. Features V1, V2, ... V28 are the principal components obtained with PCA, the only features which have not been transformed with PCA are 'Time' and 'Amount'. Feature 'Time' contains the seconds elapsed between each transaction and the first transaction in the dataset. The feature 'Amount' is the transaction Amount, this feature can be used for example-dependant cost-sensitive learning. Feature 'Class' is the response variable and it takes value 1 in case of fraud and 0 otherwise.
Given the class imbalance ratio, we recommend measuring the accuracy using the Area Under the Precision-Recall Curve (AUPRC). Confusion matrix accuracy is not meaningful for unbalanced classification.
Update (03/05/2021)
A simulator for transaction data has been released as part of the practical handbook on Machine Learning for Credit Card Fraud Detection - https://fraud-detection-handbook.github.io/fraud-detection-handbook/Chapter_3_GettingStarted/SimulatedDataset.html. We invite all practitioners interested in fraud detection datasets to also check out this data simulator, and the methodologies for credit card fraud detection presented in the book.
Acknowledgements
The dataset has been collected and analysed during a research collaboration of Worldline and the Machine Learning Group (http://mlg.ulb.ac.be) of ULB (Université Libre de Bruxelles) on big data mining and fraud detection. More details on current and past projects on related topics are available on https://www.researchgate.net/project/Fraud-detection-5 and the page of the DefeatFraud project
Please cite the following works:
Andrea Dal Pozzolo, Olivier Caelen, Reid A. Johnson and Gianluca Bontempi. Calibrating Probability with Undersampling for Unbalanced Classification. In Symposium on Computational Intelligence and Data Mining (CIDM), IEEE, 2015
Dal Pozzolo, Andrea; Caelen, Olivier; Le Borgne, Yann-Ael; Waterschoot, Serge; Bontempi, Gianluca. Learned lessons in credit card fraud detection from a practitioner perspective, Expert systems with applications,41,10,4915-4928,2014, Pergamon
Dal Pozzolo, Andrea; Boracchi, Giacomo; Caelen, Olivier; Alippi, Cesare; Bontempi, Gianluca. Credit card fraud detection: a realistic modeling and a novel learning strategy, IEEE transactions on neural networks and learning systems,29,8,3784-3797,2018,IEEE
Dal Pozzolo, Andrea Adaptive Machine learning for credit card fraud detection ULB MLG PhD thesis (supervised by G. Bontempi)
Carcillo, Fabrizio; Dal Pozzolo, Andrea; Le Borgne, Yann-Aël; Caelen, Olivier; Mazzer, Yannis; Bontempi, Gianluca. Scarff: a scalable framework for streaming credit card fraud detection with Spark, Information fusion,41, 182-194,2018,Elsevier
Carcillo, Fabrizio; Le Borgne, Yann-Aël; Caelen, Olivier; Bontempi, Gianluca. Streaming active learning strategies for real-life credit card fraud detection: assessment and visualization, International Journal of Data Science and Analytics, 5,4,285-300,2018,Springer International Publishing
Bertrand Lebichot, Yann-Aël Le Borgne, Liyun He, Frederic Oblé, Gianluca Bontempi Deep-Learning Domain Adaptation Techniques for Credit Cards Fraud Detection, INNSBDDL 2019: Recent Advances in Big Data and Deep Learning, pp 78-88, 2019
Fabrizio Carcillo, Yann-Aël Le Borgne, Olivier Caelen, Frederic Oblé, Gianluca Bontempi Combining Unsupervised and Supervised Learning in Credit Card Fraud Detection Information Sciences, 2019
Yann-Aël Le Borgne, Gianluca Bontempi Reproducible machine Learning for Credit Card Fraud Detection - Practical Handbook
Bertrand Lebichot, Gianmarco Paldino, Wissam Siblini, Liyun He, Frederic Oblé, Gianluca Bontempi Incremental learning strategies for credit cards fraud detection, IInternational Journal of Data Science and Analytics
- N
Affect Label: Amyg Connectivity, Label - Blur: RPV
- neurovault.org
niftiUpdated Feb 13, 2017ShareFacebookTwitterEmailClick to copy linkLink copiedCite(2017). Affect Label: Amyg Connectivity, Label - Blur: RPV [Dataset]. http://identifiers.org/neurovault.image:39619niftiAvailable download formatsUnique identifierhttps://identifiers.org/neurovault.image:39619Dataset updatedFeb 13, 2017LicenseCC0 1.0 Universal Public Domain Dedicationhttps://creativecommons.org/publicdomain/zero/1.0/
License information was derived automaticallyArea coveredRancho Palos VerdesDescriptionspm_spm: resels per voxel
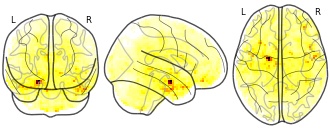
Collection description
Neurodevelopmental Changes Across Adolescence in Viewing and Labeling Dynamic Peer Emotions
Adolescence is a sensitive period of social-affective development, characterized by biological, neurological, and social changes. The field currently conceptualizes these changes in terms of an imbalance between systems supporting reactivity and regulation, specifically nonlinear changes in reactivity networks and linear changes in regulatory networks. Previous research suggests that the labeling or reappraisal of emotion increases activity in lateral prefrontal cortex (LPFC), and decreases activity in amygdala relative to passive viewing of affective stimuli. However, past work in this area has relied heavily on paradigms using static, adult faces, as well as explicit regulation. In the current study, we assessed cross-sectional trends in neural responses to viewing and labeling dynamic peer emotional expressions in adolescent girls 10-23 years old. Our dynamic adolescent stimuli set reliably and robustly recruited key brain regions involved in emotion reactivity (MOFC/vMPFC, bilateral amygdala) and regulation (bilateral dorsal and ventral LPFC). However, contrary to the age-trends predicted by the dominant models in studies of risk/reward, the LPFC showed a nonlinear age trend across adolescence to labeling dynamic peer faces, whereas the MOFC/vMPFC showed a linear decrease with age to viewing dynamic peer faces. There were no significant age trends observed in the amygdala.Subject species
homo sapiens
Map type
Other
CTU-SME-11: a labeled dataset with real benign and malicious network traffic...
- zenodo.org
- data.niaid.nih.gov
bin, bz2, csv, htmlUpdated May 26, 2023ShareFacebookTwitterEmailClick to copy linkLink copiedCiteŠtěpán Bendl; Štěpán Bendl; Veronica Valeros; Veronica Valeros; Sebastian Garcia; Sebastian Garcia (2023). CTU-SME-11: a labeled dataset with real benign and malicious network traffic mimicking a small medium-size enterprise environment [Dataset]. http://doi.org/10.5281/zenodo.7958259csv, html, bz2, binAvailable download formatsUnique identifierhttps://doi.org/10.5281/zenodo.7958259Dataset updatedMay 26, 2023AuthorsŠtěpán Bendl; Štěpán Bendl; Veronica Valeros; Veronica Valeros; Sebastian Garcia; Sebastian GarciaLicenseAttribution 4.0 (CC BY 4.0)https://creativecommons.org/licenses/by/4.0/
License information was derived automaticallyDescriptionAs technology advances, the number and complexity of cyber-attacks increase, forcing defense techniques to be updated and improved. To help develop effective tools for detecting security threats it is essential to have reliable and representative security datasets. Many existing security datasets have limitations that make them unsuitable for research, including lack of labels, unbalanced traffic, and outdated threats.
CTU-SME-11 is a labeled network dataset designed to address the limitations of previous datasets. The dataset was captured in a real network that mimics a small-medium enterprise setting. Raw network traffic (packets) was captured from 11 devices using tcpdump for a duration of 7 days, from 20th to 26th of February, 2023 in Prague, Czech Republic. The devices were chosen based on the enterprise setting and consists of IoT, desktop and mobile devices, both bare metal and virtualized. The devices were infected with malware or exposed to Internet attacks, and factory reset to restore benign behavior.
The raw data was processed to generate network flows (Zeek logs) which were analyzed and labeled. The dataset contains two types of levels, a high level label and a descriptive label, which were put by experts. The former can take three values, benign, malicious or background. The latter contains detailed information about the specific behavior observed in the network flows. The dataset contains 99 million labeled network flows. The overall compressed size of the dataset is 80GB and the uncompressed size is 170GB.
FacebookTwitterAttribution 4.0 (CC BY 4.0)https://creativecommons.org/licenses/by/4.0/
License information was derived automatically
Classification learning on non-stationary data may face dynamic changes from time to time. The major problem in it is the class imbalance and high cost of labeling instances despite drifts. Imbalance is due to lower number of samples in the minority class than the majority class. Imbalanced data results in the misclassification of data points.