OCR large data set
- kaggle.com
zipUpdated Feb 15, 2023 Share
Share Facebook
 Twitter
 EmailClick to copy linkLink copiedCiteJames Mann (2023). OCR large data set [Dataset]. https://www.kaggle.com/datasets/jame5mann/ocr-large-data-setzip(264412 bytes)Available download formatsDataset updatedFeb 15, 2023AuthorsJames MannLicense
https://creativecommons.org/publicdomain/zero/1.0/https://creativecommons.org/publicdomain/zero/1.0/
DescriptionThis is the large data set as featured in the OCR H240 exam series.
Questions about this dataset will be featured in the statistics paper
The LDS is a .xlsx file containing 5 tables, four data, one information. The data is drawn from the UK censuses from the years 2001 and 2011. It is designed for you to make comparisons and analyses of the changes in demographic and behavioural features of the populace. There is the age structure of each local authority and the method of travel within each local authority.
lds-edexcel
- kaggle.com
zipUpdated Apr 21, 2020ShareFacebookTwitterEmailClick to copy linkLink copiedCiteTom Button (2020). lds-edexcel [Dataset]. https://www.kaggle.com/tombutton/edexcelldsheathrowzip(7562 bytes)Available download formatsDataset updatedApr 21, 2020AuthorsTom ButtonDescriptionDataset
This dataset was created by Tom Button
Contents
Airoboros LLMs Math Dataset
- kaggle.com
zipUpdated Nov 24, 2023ShareFacebookTwitterEmailClick to copy linkLink copiedCiteThe Devastator (2023). Airoboros LLMs Math Dataset [Dataset]. https://www.kaggle.com/datasets/thedevastator/airoboros-llms-math-datasetzip(36964941 bytes)Available download formatsDataset updatedNov 24, 2023AuthorsThe DevastatorLicensehttps://creativecommons.org/publicdomain/zero/1.0/https://creativecommons.org/publicdomain/zero/1.0/
DescriptionAiroboros LLMs Math Dataset
Mastering Complex Mathematical Operations in Machine Learning
By Huggingface Hub [source]
About this dataset
The Airoboros-3.1 dataset is the perfect tool to help machine learning models excel in the difficult realm of complicated mathematical operations. This data collection features thousands of conversations between machines and humans, formatted in ShareGPT to maximize optimization in an OS ecosystem. The dataset’s focus on advanced subjects like factorials, trigonometry, and larger numerical values will help drive machine learning models to the next level - facilitating critical acquisition of sophisticated mathematical skills that are essential for ML success. As AI technology advances at such a rapid pace, training neural networks to correspondingly move forward can be a daunting and complicated challenge - but with Airoboros-3.1’s powerful datasets designed around difficult mathematical operations it just became one step closer to achievable!
More Datasets
For more datasets, click here.
Featured Notebooks
- 🚨 Your notebook can be here! 🚨!
How to use the dataset
To get started, download the dataset from Kaggle and use the train.csv file. This file contains over two thousand examples of conversations between ML models and humans which have been formatted using ShareGPT - fast and efficient OS ecosystem fine-tuning tools designed to help with understanding mathematical operations more easily. The file includes two columns: category and conversations, both of which are marked as strings in the data itself.
Once you have downloaded the train file you can begin setting up your own ML training environment by using any of your preferred frameworks or methods. Your model should focus on predicting what kind of mathematical operations will likely be involved in future conversations by referring back to previous dialogues within this dataset for reference (category column). You can also create your own test sets from this data, adding new conversation topics either by modifying existing rows or creating new ones entirely with conversation topics related to mathematics. Finally, compare your model’s results against other established models or algorithms that are already published online!
Happy training!
Research Ideas
- It can be used to build custom neural networks or machine learning algorithms that are specifically designed for complex mathematical operations.
- This data set can be used to teach and debug more general-purpose machine learning models to recognize large numbers, and intricate calculations within natural language processing (NLP).
- The Airoboros-3.1 dataset can also be utilized as a supervised learning task: models could learn from the conversations provided in the dataset how to respond correctly when presented with complex mathematical operations
Acknowledgements
If you use this dataset in your research, please credit the original authors. Data Source
License
License: CC0 1.0 Universal (CC0 1.0) - Public Domain Dedication No Copyright - You can copy, modify, distribute and perform the work, even for commercial purposes, all without asking permission. See Other Information.
Columns
File: train.csv | Column name | Description | |:------------------|:-----------------------------------------------------------------------------| | category | The type of mathematical operation being discussed. (String) | | conversations | The conversations between the machine learning model and the human. (String) |
Acknowledgements
If you use this dataset in your research, please credit the original authors. If you use this dataset in your research, please credit Huggingface Hub.
- h
Maths-Grade-School
- huggingface.co
+ more versionsShareFacebookTwitterEmailClick to copy linkLink copiedCiteFeynman Innovations, Maths-Grade-School [Dataset]. http://doi.org/10.57967/hf/3167CroissantCroissant is a format for machine-learning datasets. Learn more about this at mlcommons.org/croissant.Unique identifierhttps://doi.org/10.57967/hf/3167AuthorsFeynman InnovationsLicenseApache License, v2.0https://www.apache.org/licenses/LICENSE-2.0
License information was derived automaticallyDescriptionMaths-Grade-School I am releasing large Grade School level Mathematics datatset. This extensive dataset, comprising nearly one million instructions in JSON format, encapsulates a diverse array of topics fundamental to building a strong mathematical foundation. This dataset is in instruction format so that model developers, researchers etc. can easily use this dataset. Following Fields & sub Fields are covered: Calculus Probability Algebra Liner Algebra Trigonometry Differential Equations… See the full description on the dataset page: https://huggingface.co/datasets/ajibawa-2023/Maths-Grade-School.
- Z
Data from: MLFMF: Data Sets for Machine Learning for Mathematical...
- data.niaid.nih.gov
Updated Oct 26, 2023ShareFacebookTwitterEmailClick to copy linkLink copiedCiteBauer, Andrej; Petković, Matej; Todorovski, Ljupčo (2023). MLFMF: Data Sets for Machine Learning for Mathematical Formalization [Dataset]. https://data.niaid.nih.gov/resources?id=zenodo_10041074Dataset updatedOct 26, 2023Dataset provided byUniversity of Ljubljana
Institute of Mathematics, Physics, and MechanicsAuthorsBauer, Andrej; Petković, Matej; Todorovski, LjupčoLicenseAttribution 4.0 (CC BY 4.0)https://creativecommons.org/licenses/by/4.0/
License information was derived automaticallyDescriptionMLFMF MLFMF (Machine Learning for Mathematical Formalization) is a collection of data sets for benchmarking recommendation systems used to support formalization of mathematics with proof assistants. These systems help humans identify which previous entries (theorems, constructions, datatypes, and postulates) are relevant in proving a new theorem or carrying out a new construction. The MLFMF data sets provide solid benchmarking support for further investigation of the numerous machine learning approaches to formalized mathematics. With more than 250,000 entries in total, this is currently the largest collection of formalized mathematical knowledge in machine learnable format. In addition to benchmarking the recommendation systems, the data sets can also be used for benchmarking node classification and link prediction algorithms. The four data sets Each data set is derived from a library of formalized mathematics written in proof assistants Agda or Lean. The collection includes
the largest Lean 4 library Mathlib, the three largest Agda libraries:
the standard library the library of univalent mathematics Agda-unimath, and the TypeTopology library. Each data set represents the corresponding library in two ways: as a heterogeneous network, and as a list of syntax trees of all the entries in the library. The network contains the (modular) structure of the library and the references between entries, while the syntax trees give complete and easily parsed information about each entry. The Lean library data set was obtained by converting .olean files into s-expressions (see the lean2sexp tool). The Agda data sets were obtained with an s-expression extension of the official Agda repository (use either master-sexp or release-2.6.3-sexp branch). For more details, see our arXiv copy of the paper. Directory structure First, the mlfmf.zip archive needs to be unzipped. It contains a separate directory for every library (for example, the standard library of Agda can be found in the stdlib directory) and some auxiliary files. Every library directory contains
the network file from which the heterogeneous network can be loaded, a zip of the entries directory that contains (many) files with abstract syntax trees. Each of those files describes a single entry of the library. In addition to the auxiliary files which are used for loading the data (and described below), the zipped sources of lean2sexp and Agda s-expression extension are present. Loading the data In addition to the data files, there is also a simple python script main.py for loading the data. To run it, you will have to install the packages listed in the file requirements.txt: tqdm and networkx. The easiest way to do so is calling pip install -r requirements.txt. When running main.py for the first time, the script will unzip the entry files into the directory named entries. After that, the script loads the syntax trees of the entries (see the Entry class) and the network (as networkx.MultiDiGraph object). Note. The entry files have extension .dag (directed acyclic graph), since Lean uses node sharing, which breaks the tree structure (a shared node has more than one parent node). More information For more information about the data collection process, detailed data (and data format) description, and baseline experiments that were already performed with these data, see our arXiv copy of the paper. For the code that was used to perform the experiments and data format description, visit our github repository https://github.com/ul-fmf/mlfmf-data. Funding Since not all the funders are available in the Zenodo's database, we list them here:
This material is based upon work supported by the Air Force Office of Scientific Research under award number FA9550-21-1-0024. The authors also acknowledge the financial support of the Slovenian Research Agency via the research core funding No. P2-0103 and No. P1-0294.
A level and other 16 to 18 results - English and Maths - below level 3...
- explore-education-statistics.service.gov.uk
Updated Mar 27, 2025+ more versionsShareFacebookTwitterEmailClick to copy linkLink copiedCiteDepartment for Education (2025). A level and other 16 to 18 results - English and Maths - below level 3 entries by institution type [Dataset]. https://explore-education-statistics.service.gov.uk/data-catalogue/data-set/0bbd3a65-c917-45d1-98d7-435b22836ff8Dataset updatedMar 27, 2025LicenseOpen Government Licence 3.0http://www.nationalarchives.gov.uk/doc/open-government-licence/version/3/
License information was derived automaticallyDescriptionEntries and passes for below level 3 English and maths, by qualification type, institution type and student sex. Includes entries for students triggered for inclusion in performance tables, after discounting of exams at the major qualification level.
- h
Big-Math-RL-Verified-Processed
- huggingface.co
Updated May 13, 2025ShareFacebookTwitterEmailClick to copy linkLink copiedCiteOpen R1 (2025). Big-Math-RL-Verified-Processed [Dataset]. https://huggingface.co/datasets/open-r1/Big-Math-RL-Verified-ProcessedDataset updatedMay 13, 2025Dataset authored and provided byOpen R1DescriptionDataset Card for Big-Math-RL-Verified-Processed
This is a processed version of SynthLabsAI/Big-Math-RL-Verified where we have applied the following filters:
Removed samples where llama8b_solve_rate is None Removed samples that could not be parsed by math-verify (empty lists)
We have also created 5 additional subsets to indicate difficulty level, similar to the MATH dataset. To do so, we computed quintiles on the llama8b_solve_rate values and then filtered the dataset into the… See the full description on the dataset page: https://huggingface.co/datasets/open-r1/Big-Math-RL-Verified-Processed.
- Z
MLFMF: Data Sets for Machine Learning for Mathematical Formalization
- data-staging.niaid.nih.gov
Updated Oct 26, 2023ShareFacebookTwitterEmailClick to copy linkLink copiedCiteThe citation is currently not available for this dataset.Dataset updatedOct 26, 2023Dataset provided byUniversity of Ljubljana
Institute of Mathematics, Physics, and MechanicsAuthorsBauer, Andrej; Petković, Matej; Todorovski, LjupčoLicenseAttribution 4.0 (CC BY 4.0)https://creativecommons.org/licenses/by/4.0/
License information was derived automaticallyDescriptionMLFMF MLFMF (Machine Learning for Mathematical Formalization) is a collection of data sets for benchmarking recommendation systems used to support formalization of mathematics with proof assistants. These systems help humans identify which previous entries (theorems, constructions, datatypes, and postulates) are relevant in proving a new theorem or carrying out a new construction. The MLFMF data sets provide solid benchmarking support for further investigation of the numerous machine learning approaches to formalized mathematics. With more than 250,000 entries in total, this is currently the largest collection of formalized mathematical knowledge in machine learnable format. In addition to benchmarking the recommendation systems, the data sets can also be used for benchmarking node classification and link prediction algorithms. The four data sets Each data set is derived from a library of formalized mathematics written in proof assistants Agda or Lean. The collection includes
the largest Lean 4 library Mathlib, the three largest Agda libraries:
the standard library the library of univalent mathematics Agda-unimath, and the TypeTopology library. Each data set represents the corresponding library in two ways: as a heterogeneous network, and as a list of syntax trees of all the entries in the library. The network contains the (modular) structure of the library and the references between entries, while the syntax trees give complete and easily parsed information about each entry. The Lean library data set was obtained by converting .olean files into s-expressions (see the lean2sexp tool). The Agda data sets were obtained with an s-expression extension of the official Agda repository (use either master-sexp or release-2.6.3-sexp branch). For more details, see our arXiv copy of the paper. Directory structure First, the mlfmf.zip archive needs to be unzipped. It contains a separate directory for every library (for example, the standard library of Agda can be found in the stdlib directory) and some auxiliary files. Every library directory contains
the network file from which the heterogeneous network can be loaded, a zip of the entries directory that contains (many) files with abstract syntax trees. Each of those files describes a single entry of the library. In addition to the auxiliary files which are used for loading the data (and described below), the zipped sources of lean2sexp and Agda s-expression extension are present. Loading the data In addition to the data files, there is also a simple python script main.py for loading the data. To run it, you will have to install the packages listed in the file requirements.txt: tqdm and networkx. The easiest way to do so is calling pip install -r requirements.txt. When running main.py for the first time, the script will unzip the entry files into the directory named entries. After that, the script loads the syntax trees of the entries (see the Entry class) and the network (as networkx.MultiDiGraph object). Note. The entry files have extension .dag (directed acyclic graph), since Lean uses node sharing, which breaks the tree structure (a shared node has more than one parent node). More information For more information about the data collection process, detailed data (and data format) description, and baseline experiments that were already performed with these data, see our arXiv copy of the paper. For the code that was used to perform the experiments and data format description, visit our github repository https://github.com/ul-fmf/mlfmf-data. Funding Since not all the funders are available in the Zenodo's database, we list them here:
This material is based upon work supported by the Air Force Office of Scientific Research under award number FA9550-21-1-0024. The authors also acknowledge the financial support of the Slovenian Research Agency via the research core funding No. P2-0103 and No. P1-0294.
Sigma Dolphin Filtered and Cleaned
- kaggle.com
zipUpdated Jun 25, 2024ShareFacebookTwitterEmailClick to copy linkLink copiedCiteRyan Mutiga (2024). Sigma Dolphin Filtered and Cleaned [Dataset]. https://www.kaggle.com/datasets/ryanmutiga/sigma-dolphin-filtered-and-cleanedzip(60569 bytes)Available download formatsDataset updatedJun 25, 2024AuthorsRyan MutigaDescriptionDataset Description for Filtered Sigma Dolphin Dataset
Overview
This dataset is a cleaned and filtered version of the Sigma Dolphin dataset (https://www.kaggle.com/datasets/saurabhshahane/sigmadolphin), designed to aid in solving maths word problems using AI techniques. This was used as an effort towards taking part in the AI Mathematical Olympiad - Progress Prize 1 (https://www.kaggle.com/competitions/ai-mathematical-olympiad-prize/overview). The dataset was processed using TF-IDF vectorisation and K-means clustering, specifically targeting questions relevant to the AIME (American Invitational Mathematics Examination) and AMC 12 (American Mathematics Competitions).
Context
The Sigma Dolphin dataset is a project initiated by Microsoft Research Asia, aimed at building an intelligent system with natural language understanding and reasoning capacities to automatically solve maths word problems written in natural language. This project began in early 2013, and the dataset includes maths word problems from various sources, including community question-answering sites like Yahoo! Answers.
Source and Original Dataset Details
- Original Dataset: Sigma Dolphin (https://www.kaggle.com/datasets/saurabhshahane/sigmadolphin)
- Original Source: https://msropendata.com/datasets/f0e63bb3-717a-4a53-aa79-da339b0d7992
- Project Page: http://research.microsoft.com/en-us/projects/dolphin/
- References:
- Shuming Shi, et al. "Automatically Solving Number Word Problems by Semantic Parsing and Reasoning." EMNLP 2015.
- Danqing Huang, et al. "How Well Do Computers Solve Math Word Problems? Large-Scale Dataset Construction and Evaluation." ACL 2016.
- JSON: http://json.org/
Content
The filtered dataset includes problems that are relevant for preparing for maths competitions such as AIME and AMC. The data is structured to facilitate the training and evaluation of AI models aimed at solving these types of problems.
Datasets:
There are several filtered versions of the dataset based on different similarity thresholds (0.3 and 0.5). These thresholds were used to determine the relevance of problems from the original Sigma Dolphin dataset to the AIME and AMC problems.
Number Word Problems Filtered at 0.3 Threshold:
- File:
number_word_test_filtered_0.3_Threshold.csv - Description: Contains problems filtered with a similarity threshold of 0.3, ensuring moderate relevance to AIME and AMC 12 problems.
- File:
Number Word Problems Filtered at 0.5 Threshold:
- File:
number_word_std.test_filtered_0.5_Threshold.csv - Description: Contains problems filtered with a higher similarity threshold of 0.5, ensuring higher relevance to AIME and AMC 12 problems.
- File:
Filtered Number Word Problems 2 at 0.3 Threshold:
- File:
filtered_number_word_problems2_Threshold.csv - Description: Another set of problems filtered at a 0.3 similarity threshold.
- File:
Filtered Number Word Problems 2 at 0.5 Threshold:
- File:
filtered_number_word_problems_Threshold.csv - Description: Another set of problems filtered at a 0.5 similarity threshold.
- File:
Why Different Similarity Thresholds?
Different similarity thresholds (0.3 and 0.5) are used to provide flexibility in selecting problems based on their relevance to AIME and AMC problems. A lower threshold (0.3) includes a broader range of problems, ensuring a diverse set of questions, while a higher threshold (0.5) focuses on problems with stronger relevance, offering a more targeted and precise dataset. This allows users to choose the level of specificity that best fits their needs.
For a detailed explanation of the preprocessing and filtering process, please refer to the Sigma Dolphin Filtered & Cleaned Notebook.
Acknowledgements
We extend our gratitude to all the original authors of the Sigma Dolphin dataset and the creators of the AIME and AMC problems. This project leverages the work of numerous researchers and datasets to build a comprehensive resource for AI-based problem solving in mathematics.
Usage
This dataset is intended for research and educational purposes. It can be used to train AI models for natural language processing and problem-solving tasks, specifically targeting maths word problems in competitive environments like AIME and AMC.
Licensing
This dataset is shared under the Computational Use of Data Agreement v1.0.
This description provides an extensive overview of the dataset, its sources, contents, and usage. If any specific details or additional sections are needed, please let me know!
- l
Supplementary Information files for A gifted SNARC? Directional...
- repository.lboro.ac.uk
docxUpdated May 31, 2023ShareFacebookTwitterEmailClick to copy linkLink copiedCiteYunfeng He; Hans-Christoph Nuerk; Alexander Derksen; Jiannong Shi; Xinlin Zhou; Krzysztof Cipora (2023). Supplementary Information files for A gifted SNARC? Directional spatial-numerical associations in gifted children with high-level math skills do not differ from controls [Dataset]. http://doi.org/10.17028/rd.lboro.12820673.v1docxAvailable download formatsUnique identifierhttps://doi.org/10.17028/rd.lboro.12820673.v1Dataset updatedMay 31, 2023Dataset provided byLoughborough UniversityAuthorsYunfeng He; Hans-Christoph Nuerk; Alexander Derksen; Jiannong Shi; Xinlin Zhou; Krzysztof CiporaLicenseAttribution 4.0 (CC BY 4.0)https://creativecommons.org/licenses/by/4.0/
License information was derived automaticallyDescriptionSupplementary Information files for A gifted SNARC? Directional spatial-numerical associations in gifted children with high-level math skills do not differ from controlsThe SNARC (Spatial-Numerical Association of Response Codes) efect (i.e., a tendency to associate small/large magnitude numbers with the left/right hand side) is prevalent across the whole lifespan. Because the ability to relate numbers to space has been viewed as a cornerstone in the development of mathematical skills, the relationship between the SNARC efect and math skills has been frequently examined. The results remain largely inconsistent. Studies testing groups of people with very low or very high skill levels in math sometimes found relationships between SNARC and math skills. So far, however, studies testing such extreme math skills level groups were mostly investigating the SNARC efect in individuals revealing math difculties. Groups with above average math skills remain understudied, especially in regard to children. Here, we investigate the SNARC efect in gifted children, as compared to normally developing children (overall n=165). Frequentist and Bayesian analysis suggested that the groups did not difer from each other in the SNARC efect. These results are the frst to provide evidence for the SNARC efect in a relatively large sample of gifted (and mathematically highly skilled) children. In sum, our study provides another piece of evidence for no direct link between the SNARC efect and mathematical ability in childhood.
- N
Individual Brain Charting dataset extension, second release of...
- neurovault.org
niftiUpdated Feb 14, 2020ShareFacebookTwitterEmailClick to copy linkLink copiedCite(2020). Individual Brain Charting dataset extension, second release of high-resolution fMRI data for cognitive mapping: sub-15_ses-02_task-hcp_language_dir-ap_story-math [Dataset]. http://identifiers.org/neurovault.image:363842niftiAvailable download formatsUnique identifierhttps://identifiers.org/neurovault.image:363842Dataset updatedFeb 14, 2020LicenseCC0 1.0 Universal Public Domain Dedicationhttps://creativecommons.org/publicdomain/zero/1.0/
License information was derived automaticallyDescription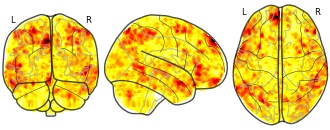
Collection description
The individual Brain Charting (IBC) Project is using high resolution fMRI to map 13 subjects that undergo a large number of tasks: the HCP tasks, the so-called ARCHI tasks, a specific language task, video watching, low-level visual stimulation etc. The native resolution of the data is 1.5mm isotropic. Their main value lies in the large number of contrasts probed, the level of detail and the high SNR per subject. This dataset is meant to provide the basis of a functional brain atlas. We upload here smoothed individual SPMs. The uploaded maps comprise session-specific and fixed effects across maps acquired with AP and PA phase encoding directions.
Note that Neurovault collection #4438 is a subset of that one. In the present collections, some details have been fixed, including mroe accurate and unique file naming.
Subject species
homo sapiens
Modality
fMRI-BOLD
Analysis level
single-subject
Cognitive paradigm (task)
language processing fMRI task paradigm
Map type
Z
- n
Data from: Exploring Human-Like Mathematical Reasoning: Perspectives on...
- curate.nd.edu
pdfUpdated Dec 3, 2024ShareFacebookTwitterEmailClick to copy linkLink copiedCiteZhenwen Liang (2024). Exploring Human-Like Mathematical Reasoning: Perspectives on Generalizability and Efficiency [Dataset]. http://doi.org/10.7274/27895872.v1pdfAvailable download formatsUnique identifierhttps://doi.org/10.7274/27895872.v1Dataset updatedDec 3, 2024Dataset provided byUniversity of Notre DameAuthorsZhenwen LiangLicenseAttribution-NonCommercial 4.0 (CC BY-NC 4.0)https://creativecommons.org/licenses/by-nc/4.0/
License information was derived automaticallyDescriptionMathematical reasoning, a fundamental aspect of human cognition, poses significant challenges for artificial intelligence (AI) systems. Despite recent advancements in natural language processing (NLP) and large language models (LLMs), AI's ability to replicate human-like reasoning, generalization, and efficiency remains an ongoing research challenge. In this dissertation, we address key limitations in MWP solving, focusing on the accuracy, generalization ability and efficiency of AI-based mathematical reasoners by applying human-like reasoning methods and principles.
This dissertation introduces several innovative approaches in mathematical reasoning. First, a numeracy-driven framework is proposed to enhance math word problem (MWP) solvers by integrating numerical reasoning into model training, surpassing human-level performance on benchmark datasets. Second, a novel multi-solution framework captures the diversity of valid solutions to math problems, improving the generalization capabilities of AI models. Third, a customized knowledge distillation technique, termed Customized Exercise for Math Learning (CEMAL), is developed to create tailored exercises for smaller models, significantly improving their efficiency and accuracy in solving MWPs. Additionally, a multi-view fine-tuning paradigm (MinT) is introduced to enable smaller models to handle diverse annotation styles from different datasets, improving their adaptability and generalization. To further advance mathematical reasoning, a benchmark, MathChat, is introduced to evaluate large language models (LLMs) in multi-turn reasoning and instruction-following tasks, demonstrating significant performance improvements. Finally, new inference-time verifiers, Math-Rev and Code-Rev, are developed to enhance reasoning verification, combining language-based and code-based solutions for improved accuracy in both math and code reasoning tasks.
In summary, this dissertation provides a comprehensive exploration of these challenges and contributes novel solutions that push the boundaries of AI-driven mathematical reasoning. Potential future research directions are also discussed to further extend the impact of this dissertation.
- h
Math-RLVR
- huggingface.co
Updated Mar 31, 2025ShareFacebookTwitterEmailClick to copy linkLink copiedCiteYi Su (2025). Math-RLVR [Dataset]. https://huggingface.co/datasets/virtuoussy/Math-RLVRDataset updatedMar 31, 2025AuthorsYi SuLicenseApache License, v2.0https://www.apache.org/licenses/LICENSE-2.0
License information was derived automaticallyDescriptionMath data for paper "Expanding RL with Verifiable Rewards Across Diverse Domains". we use a large-scale dataset of 773k Chinese Question Answering (QA) pairs, collected under authorized licenses from educational websites. This dataset covers three educational levels: elementary, middle, and high school. Unlike well-structured yet small-scale benchmarks such as MATH (Hendrycks et al., 2021b) and GSM8K (Cobbe et al., 2021b), our reference answers are inherently free-form, often interwoven with… See the full description on the dataset page: https://huggingface.co/datasets/virtuoussy/Math-RLVR.
- p
Distribution of Students Across Grade Levels in Big Walnut Middle School
- publicschoolreview.com
Updated Dec 21, 2022+ more versionsShareFacebookTwitterEmailClick to copy linkLink copiedCitePublic School Review (2022). Distribution of Students Across Grade Levels in Big Walnut Middle School [Dataset]. https://www.publicschoolreview.com/big-walnut-middle-school-profileDataset updatedDec 21, 2022Dataset authored and provided byPublic School ReviewLicenseAttribution 4.0 (CC BY 4.0)https://creativecommons.org/licenses/by/4.0/
License information was derived automaticallyDescriptionThis dataset tracks annual distribution of students across grade levels in Big Walnut Middle School
Graduates at doctoral level, in science, math., computing, engineering,...
- ec.europa.eu
Updated Oct 10, 2025+ more versionsShareFacebookTwitterEmailClick to copy linkLink copiedCiteEurostat (2025). Graduates at doctoral level, in science, math., computing, engineering, manufacturing, construction, by sex - per 1000 of population aged 25-34 [Dataset]. http://doi.org/10.2908/EDUC_UOE_GRAD07application/vnd.sdmx.genericdata+xml;version=2.1, application/vnd.sdmx.data+csv;version=2.0.0, json, tsv, application/vnd.sdmx.data+xml;version=3.0.0, application/vnd.sdmx.data+csv;version=1.0.0Available download formatsUnique identifierhttps://doi.org/10.2908/EDUC_UOE_GRAD07Dataset updatedOct 10, 2025LicenseAttribution 4.0 (CC BY 4.0)https://creativecommons.org/licenses/by/4.0/
License information was derived automaticallyTime period covered2013 - 2023Area coveredTürkiye, Portugal, Luxembourg, Slovenia, Albania, Finland, Czechia, Italy, Croatia, MontenegroDescriptionThis domain covers statistics and indicators on key aspects of the education systems across Europe. The data show entrants and enrolments in education levels, education personnel and the cost and type of resources dedicated to education.
For a general technical description of the UOE Data Collection see UNESCO OECD Eurostat (UOE) joint data collection – methodology - Statistics Explained (europa.eu).
The standards on international statistics on education and training systems are set by the three international organisations jointly administering the annual UOE data collection:
- The United Nations Educational, Scientific, and Cultural Organisation Institute for Statistics (UNESCO-UIS),
- The Organisation for Economic Co-operation and Development (OECD) and,
- The Statistical Office of the European Union (EUROSTAT).
The following topics are covered:
- Pupils and students – Enrolments and Entrants,
- Learning mobility,
- Education personnel,
- Education finance,
- Graduates,
- Language learning.
Data on enrolments in education are disseminated in absolute numbers, with breakdowns available for the following dimensions:
- ISCED level of education,
- Sex,
- Age or age group,
- NUTS1 and NUTS2 regions,
- Type of educational institution (public or private) – referred to as the ‘sector’ in Eurobase,
- Intensity of participation (full-time, part-time, full-time equivalent) – referred to as ‘working time’ in Eurobase,
- Programme orientation (general/academic or vocational/professional),
- Type of vocational programme (school-based only or combined school and work-based),
- Level of attainment that can be achieved upon programme completion (e.g. insufficient for level completion or partial level completion, sufficient for partial level completion without direct access to tertiary education),
- Field of education (ISCED-F13).
Additionally, the following types of indicators on enrolments are calculated (all indicators using population data use Eurostat’s population database (demo_pjan)):
- Participation rates by age or by age groups as % of corresponding age population.
- Participation rates by age as % of total population.
- Pupils from age 0, 3, 4 and 5 to the starting age of compulsory education at primary level, as % of the population of the corresponding age. In some countries, the start of primary education is not compulsory and in some countries compulsory education starts at pre-primary level. This indicator calculates the participation rates of pupils up until (but not including) the starting age of formal education that is both compulsory and at the primary level. This age varies from 5 years to 7 years across countries and the national starting ages for compulsory primary education used in the calculation of this indicator are listed in the file Ages_educ_indicators which is available to download in the Annexes section of this page.
- Pupils under the age of 3 as % of corresponding age population. This indicator does not include 3 year olds (includes ages 0, 1 and 2).
- Out-of-school rates at different ages. This indicator is calculated as 100 – (students of a particular age who are enrolled in education at any ISCED level / Total population of that age *100).
- Out-of-school rates in population of lower secondary school age and in population of upper secondary school age. This indicator is calculated as 100 – (students who are of the official age range for ISCED X who are enrolled in education at any ISCED level / Total population in the official age range for ISCED X *100). The official age range for each ISCED level varies across countries, and national age ranges for lower and upper secondary used in the calculation of this indicator are listed in the file Ages_educ_indicators which is available to download in the Annexes section of this page.
- Students in education of post-compulsory school age - as % of the total population of post-compulsory school age. The final age at which formal education is considered as compulsory in national education systems in the calculation of this indicator are listed in the file Ages_educ_indicators.
- Students participation at the end of compulsory education - as % of the corresponding age population. Indicator is calculated for age (X-1), (X), (X+1), (X+2) where X = the final age at which formal education is compulsory in national education systems. The final age at which formal education is considered as compulsory in national education systems in the calculation of this indicator are listed in the file Ages_educ_indicators.
- Students in education aged 30 and over - per 1000 of corresponding age population
- Expected school years of pupils and students at different levels of education
- Distribution of pupils and students enrolled in general and vocational programmes by education level and NUTS2 regions
- Distribution of students in different fields of education
- Ratio of the proportion of the population who are tertiary students in NUTS1 regions to the proportion of the population who are tertiary students in NUTS2 regions
Data on entrants in education are disseminated in absolute numbers, with breakdowns available for the following dimensions:
- ISCED level of education,
- Programme orientation (general/academic or vocational/professional),
- Sex,
- Age or age group,
- Field of education (ISCED-F13).
Additionally the following indicator on entrants is calculated:
- Distribution of new entrants in different fields of education.
Data on learning mobility is available for degree mobile students, degree mobile graduates and credit mobile graduates. Degree mobility means that students/graduates are/were enrolled as regular students in any semester/term of a programme taught in the country of destination with the intention of graduating from it in the country of destination. Credit mobility is defined as temporary tertiary education or/and study-related traineeship abroad within the framework of enrolment in a tertiary education programme at a "home institution" (usually) for the purpose of gaining academic credit (i.e. credit that will be recognised in that home institution). Further definitions are in Section 2.8 of the UOE manual.
Degree mobile students are referred to as just ‘mobile students’ in UOE learning mobility tables. Data is disseminated for degree mobile students and degree mobile graduates in absolute numbers with breakdowns available for the following dimensions:
- ISCED level of education,
- Sex,
- Field of education (ISCED-F13),
- Country of origin (defined as the country of education prior to entering tertiary although there may be national deviations. These are listed in the Helpsheet of the latest footnotes report available to download in the Annexes section of this page) – referred to as ‘Geopolitical entity (partner)’ in Eurobase.
Additionally the following types of indicators on degree mobile students and degree mobile graduates are calculated ((all indicators using population data use Eurostat’s population database (demo_pjan)):
- Share of all students/graduates who are mobile students/degree mobile graduates from abroad,
- Distribution of mobile students/degree mobile graduates from abroad in different fields of education.
For credit mobile graduates, data are disseminated in absolute numbers, with breakdowns available for the following dimensions:
- ISCED level of education,
- Sex,
- Type of mobility scheme (e.g. Credit mobility under EU programmes i.e. ERASMUS, Credit mobility in other international/national programmes),
- Type of mobility (study period only or study period combined with work placement),
- Country of destination – referred to as ‘Geopolitical entity (partner)’ in Eurobase.
Data on personnel in education are available for classroom teachers/academic staff, teacher aides and school-management personnel. Teachers are employed in a professional capacity to guide and direct the learning experiences of students, irrespective of their training, qualifications or delivery mechanism. Teacher aides support teachers in providing instruction to students. Academic staff are personnel employed at the tertiary level of education whose primary assignment is instruction and/or research. School management personnel covers professional personnel who are responsible for school management/administration (ISCED 0-4) or whose primary or major responsibility is the management of the institution, or a recognised department or subdivision of the institution (tertiary levels). Full definitions of these statistical units are in Section 3.5 of the UOE manual.
Data are disseminated on teachers and academic staff in absolute numbers, with breakdowns available for the following dimensions:
- ISCED
GSM8K - Grade School Math 8K dataset for LLM
- kaggle.com
zipUpdated May 21, 2024ShareFacebookTwitterEmailClick to copy linkLink copiedCiteJohnson chong (2024). GSM8K - Grade School Math 8K dataset for LLM [Dataset]. https://www.kaggle.com/datasets/johnsonhk88/gsm8k-grade-school-math-8k-dataset-for-llmzip(5156809 bytes)Available download formatsDataset updatedMay 21, 2024AuthorsJohnson chongLicenseApache License, v2.0https://www.apache.org/licenses/LICENSE-2.0
License information was derived automaticallyDescriptionDataset Summary GSM8K (Grade School Math 8K) is a dataset of 8.5K high quality linguistically diverse grade school math word problems. The dataset was created to support the task of question answering on basic mathematical problems that require multi-step reasoning.
These problems take between 2 and 8 steps to solve. Solutions primarily involve performing a sequence of elementary calculations using basic arithmetic operations (+ − ×÷) to reach the final answer. A bright middle school student should be able to solve every problem: from the paper, "Problems require no concepts beyond the level of early Algebra, and the vast majority of problems can be solved without explicitly defining a variable." Solutions are provided in natural language, as opposed to pure math expressions. From the paper: "We believe this is the most generally useful data format, and we expect it to shed light on the properties of large language models’ internal monologues"
Data from: S1 Dataset -
- plos.figshare.com
xlsxUpdated Dec 14, 2023ShareFacebookTwitterEmailClick to copy linkLink copiedCiteDanni Li; Jeffrey Liew; Dwayne Raymond; Tracy Hammond (2023). S1 Dataset - [Dataset]. http://doi.org/10.1371/journal.pone.0292844.s001xlsxAvailable download formatsUnique identifierhttps://doi.org/10.1371/journal.pone.0292844.s001Dataset updatedDec 14, 2023AuthorsDanni Li; Jeffrey Liew; Dwayne Raymond; Tracy HammondLicenseAttribution 4.0 (CC BY 4.0)https://creativecommons.org/licenses/by/4.0/
License information was derived automaticallyDescriptionStudents’ math motivation can predict engagement, achievement, and career interest in science, technology, engineering, and mathematics (STEM). However, it is not well understood how personality traits and math anxiety may be linked to different types or qualities of math motivation, particularly during high-stress times such as the COVID-19 pandemic. In this study, we examined how fearful or avoidant temperaments contribute to math anxiety and math motivations for college students during the COVID-19 pandemic. Ninety-six undergraduate students from a large public university were assessed on temperamental fear, math anxiety, and math motivation in an online math course. Results showed that higher levels of temperamental fear are directly linked to higher levels of math anxiety. In addition, temperamental fear is indirectly linked to higher levels of autonomous motivation (i.e., intrinsic motivation and identified regulation) and lower levels of controlled motivation (i.e., external regulation) through math anxiety. Results have implications for helping students at high risk for both high math anxiety and for low motivation to engage in math learning.
Student Performance Data Set
- kaggle.com
zipUpdated Mar 27, 2020+ more versionsShareFacebookTwitterEmailClick to copy linkLink copiedCiteData-Science Sean (2020). Student Performance Data Set [Dataset]. https://www.kaggle.com/datasets/larsen0966/student-performance-data-setzip(12353 bytes)Available download formatsDataset updatedMar 27, 2020AuthorsData-Science SeanLicensehttps://creativecommons.org/publicdomain/zero/1.0/https://creativecommons.org/publicdomain/zero/1.0/
DescriptionIf this Data Set is useful, and upvote is appreciated. This data approach student achievement in secondary education of two Portuguese schools. The data attributes include student grades, demographic, social and school related features) and it was collected by using school reports and questionnaires. Two datasets are provided regarding the performance in two distinct subjects: Mathematics (mat) and Portuguese language (por). In [Cortez and Silva, 2008], the two datasets were modeled under binary/five-level classification and regression tasks. Important note: the target attribute G3 has a strong correlation with attributes G2 and G1. This occurs because G3 is the final year grade (issued at the 3rd period), while G1 and G2 correspond to the 1st and 2nd-period grades. It is more difficult to predict G3 without G2 and G1, but such prediction is much more useful (see paper source for more details).
- r
Evaluation through follow-up - pupils born in 1953
- researchdata.se
Updated Aug 15, 2024+ more versionsShareFacebookTwitterEmailClick to copy linkLink copiedCiteKjell Härnqvist; Sven-Erik Reuterberg; Allan Svensson; Airi Rovio-Johansson (2024). Evaluation through follow-up - pupils born in 1953 [Dataset]. https://researchdata.se/en/catalogue/dataset/snd0480-2Dataset updatedAug 15, 2024Dataset provided byUniversity of GothenburgAuthorsKjell Härnqvist; Sven-Erik Reuterberg; Allan Svensson; Airi Rovio-JohanssonTime period covered1966 - 1973Area coveredSwedenDescriptionSince the beginning of the 1960s, Statistics Sweden, in collaboration with various research institutions, has carried out follow-up surveys in the school system. These surveys have taken place within the framework of the IS project (Individual Statistics Project) at the University of Gothenburg and the UGU project (Evaluation through follow-up of students) at the University of Teacher Education in Stockholm, which since 1990 have been merged into a research project called 'Evaluation through Follow-up'. The follow-up surveys are part of the central evaluation of the school and are based on large nationally representative samples from different cohorts of students.
Evaluation through follow-up (UGU) is one of the country's largest research databases in the field of education. UGU is part of the central evaluation of the school and is based on large nationally representative samples from different cohorts of students. The longitudinal database contains information on nationally representative samples of school pupils from ten cohorts, born between 1948 and 2004. The sampling process was based on the student's birthday for the first two and on the school class for the other cohorts.
For each cohort, data of mainly two types are collected. School administrative data is collected annually by Statistics Sweden during the time that pupils are in the general school system (primary and secondary school), for most cohorts starting in compulsory school year 3. This information is provided by the school offices and, among other things, includes characteristics of school, class, special support, study choices and grades. Information obtained has varied somewhat, e.g. due to changes in curricula. A more detailed description of this data collection can be found in reports published by Statistics Sweden and linked to datasets for each cohort.
Survey data from the pupils is collected for the first time in compulsory school year 6 (for most cohorts). Questionnaire in survey in year 6 includes questions related to self-perception and interest in learning, attitudes to school, hobbies, school motivation and future plans. For some cohorts, questionnaire data are also collected in year 3 and year 9 in compulsory school and in upper secondary school.
Furthermore, results from various intelligence tests and standartized knowledge tests are included in the data collection year 6. The intelligence tests have been identical for all cohorts (except cohort born in 1987 from which questionnaire data were first collected in year 9). The intelligence test consists of a verbal, a spatial and an inductive test, each containing 40 tasks and specially designed for the UGU project. The verbal test is a vocabulary test of the opposite type. The spatial test is a so-called ‘sheet metal folding test’ and the inductive test are made up of series of numbers. The reliability of the test, intercorrelations and connection with school grades are reported by Svensson (1971).
For the first three cohorts (1948, 1953 and 1967), the standartized knowledge tests in year 6 consist of the standard tests in Swedish, mathematics and English that up to and including the beginning of the 1980s were offered to all pupils in compulsory school year 6. For the cohort 1972, specially prepared tests in reading and mathematics were used. The test in reading consists of 27 tasks and aimed to identify students with reading difficulties. The mathematics test, which was also offered for the fifth cohort, (1977) includes 19 assignments. After a changed version of the test, caused by the previously used test being judged to be somewhat too simple, has been used for the cohort born in 1982. Results on the mathematics test are not available for the 1987 cohort. The mathematics test was not offered to the students in the cohort in 1992, as the test did not seem to fully correspond with current curriculum intentions in mathematics. For further information, see the description of the dataset for each cohort.
For several of the samples, questionnaires were also collected from the students 'parents and teachers in year 6. The teacher questionnaire contains questions about the teacher, class size and composition, the teacher's assessments of the class' knowledge level, etc., school resources, working methods and parental involvement and questions about the existence of evaluations. The questionnaire for the guardians includes questions about the child's upbringing conditions, ambitions and wishes regarding the child's education, views on the school's objectives and the parents' own educational and professional situation.
The students are followed up even after they have left primary school. Among other things, data collection is done during the time they are in high school. Then school administrative data such as e.g. choice of upper secondary school line / program and grades after completing studies. For some of the cohorts, in addition to school administrative data, questionnaire data were also collected from the students.
he sample consisted of students born on the 5th, 15th and 25th of any month in 1953, a total of 10,723 students.
The data obtained in 1966 were: 1. School administrative data (school form, class type, year and grades). 2. Information about the parents' profession and education, number of siblings, the distance between home and school, etc.
This information was collected for 93% of all born on the current days. The reason for this is reduced resources for Statistics Sweden for follow-up work - reminders etc. Annual data for cohorts in 1953 were collected by Statistics Sweden up to and including academic year 1972/73.
- Answers to certain questions that shed light on students' school motivation, leisure activities and study and career plans. Some of the questions changed significantly compared to the cohort in 1948 due to the fact that they did not function satisfactorily from a metrological point of view.
- Results on three aptitude tests, one verbal, one spatial and one inductive.
- Standard test results in reading, writing, mathematics and English, which were offered to the students who belonged to year 6.
Response rate for test and questionnaire data is 88% Standard test results were received for just over 85% of those who took the tests.
The sample included a total of 9955 students, for whom some form of information was obtained.
Part of the "Individual Statistics Project" together with cohort 1953.
Aida Calculus Math Handwriting Recognition Dataset
- kaggle.com
zipUpdated Aug 20, 2020ShareFacebookTwitterEmailClick to copy linkLink copiedCiteAida by Pearson (2020). Aida Calculus Math Handwriting Recognition Dataset [Dataset]. https://www.kaggle.com/aidapearson/ocr-datazip(10833406726 bytes)Available download formatsDataset updatedAug 20, 2020AuthorsAida by PearsonLicensehttps://cdla.io/sharing-1-0/https://cdla.io/sharing-1-0/
DescriptionContext
The Aida Calculus Math Handwriting Recognition Dataset consists of 100,000 images in 10 batches. Each image contains a photo of a handwritten calculus math expression (specifically within the topic of limits) written with a dark utensil on plain paper. Each image is accompanied by ground truth math expression in LaTeX as well as bounding boxes and pixel-level masks per character. All images are synthetically generated.
https://www.googleapis.com/download/storage/v1/b/kaggle-user-content/o/inbox%2F5602706%2F67bf0c680286baf2c979c8207a991bb2%2FScreen%20Shot%202020-08-19%20at%201.02.50%20PM.png?generation=1597868629120369&alt=media%20=500x100" alt="">
Motivation
The complexity of handwriting recognition for math expressions can be decomposed into the following sources of variability:
Image of Math = Math Expression x Math Characters x Location of Math Characters x Visual Qualities of the Math Characters (fonts, color) x Noise of Image (backgrounds, stray marks)It is the job of the recognition model to take the Image of Math as input and predict the Math Expression.
Typical approaches to handwritten recognition tasks involve collecting and tagging of large amounts of data, on which many iterations of models are trained. The "one dataset, many models" paradigm has specific drawbacks within the context of product development. As product requirements evolve, such as the addition of a new mathematical character into the prediction space, a new data collection and tagging effort must be undertaken. The cycle of adapting the handwriting recognition capability to new requirements is long and does not support agile product development.Here, we take a different approach by iteratively building a complex, synthetically generated dataset towards specific requirements. The generation process delivers exact control over the distribution of math expressions, characters, location of characters, specific visual qualities of the math, image noise, and image augmentations to the developer. The developer controls every aspect of the data, down to each pixel. In many ways, the data synthesis runs backwards to the handwriting recognition model, creating visual complexity that the model must then untangle to uncover the ground truth math expression. Thus, we can arrive at a "many datasets, one model" paradigm that as product requirements change, the data can quickly iterate and adapt on agile cycles.
In addition to affording more control over the product development process, synthetic data allows for 100% correct pixel by pixel tagging that opens the door for new modeling possibilities. Every image is tagged with the ground truth LaTeX for the expressions, bounding boxes per math character, and exact pixel masks for each character.
Our goal in releasing this dataset is to provide the data science and machine learning community with resources for undertaking the challenging computer vision task of extracting math expressions from images. The data offers something to all levels, from beginners building simple character recognition models to experts who wish to predict pixel-by-pixel masks and decode the complex structure of math expressions.
Content
The images contain math expressions of limits, a topic typically encountered by students learning Calculus I in the United States. Features of the writing such as font, writing utensils (type, color, pressure, consistency), angle and distance of photo, and size of writing are all simulated. Backgrounds features include shadows, various plain paper types, bleed throughs, other distortions, and noise typical of student taking photos of their math.
The strategy in defining the populations from which images are synthesized is to be a superset of what we expect students to submit. Therefore, the math expressions are not in themselves pedagogical, but aim to encompass the potential variety of student submissions, both mathematically correct and incorrect. The image features and augmentations are similarly designed to cover the range of possible student handwriting qualities.
https://www.googleapis.com/download/storage/v1/b/kaggle-user-content/o/inbox%2F5602706%2F78c49b9673f8d07c91cd5c929e50ed13%2FPicture2.png?generation=1597361067979205&alt=media" alt="">
https://www.googleapis.com/download/storage/v1/b/kaggle-user-content/o/inbox%2F5602706%2F38f70b6a773709eb02578f20634e8433%2FPicture1.png?generation=1597361068613807&alt=media" alt="">
https://www.googleapis.com/download/storage/v1/b/kaggle-user-content/o/inbox%2F5602706%2F17a3a78ac635cd728f9d6ef32609aee8%2FPicture3.png?generation=1597361068784034&alt=media" alt="">
https://www.googleapis.com/download/storage/v1/b/kaggle-user-content/o/inbox%2F5602706%2Fc052749a8085d66aa7bf97c78a4b6c6a%2FPicture4.png?generation=1597361068949074&alt=media%20=250x100" alt="">
Data consis...
FacebookTwitterOCR large data set
The LDS used in the OCR A level maths exam (statistics)
https://creativecommons.org/publicdomain/zero/1.0/https://creativecommons.org/publicdomain/zero/1.0/
This is the large data set as featured in the OCR H240 exam series.
Questions about this dataset will be featured in the statistics paper
The LDS is a .xlsx file containing 5 tables, four data, one information. The data is drawn from the UK censuses from the years 2001 and 2011. It is designed for you to make comparisons and analyses of the changes in demographic and behavioural features of the populace. There is the age structure of each local authority and the method of travel within each local authority.