Surface Weather Observation Large Scale Map Imagery
- data.ucar.edu
imageUpdated Dec 26, 2024 Share
Share Facebook
 Twitter
 EmailClick to copy linkLink copiedCiteUCAR/NCAR - Earth Observing Laboratory (2024). Surface Weather Observation Large Scale Map Imagery [Dataset]. http://doi.org/10.26023/1KTJ-6PJA-7F01imageAvailable download formatsUnique identifierhttps://doi.org/10.26023/1KTJ-6PJA-7F01Dataset updatedDec 26, 2024Dataset provided byUniversity Corporation for Atmospheric ResearchAuthorsUCAR/NCAR - Earth Observing LaboratoryTime period coveredJan 27, 2009 - Mar 10, 2010Area coveredDescription
This data set contains maps of surface weather observations over the western two-thirds of the US and southern Canada. The latest observation at the time the plot was generated was utilized, so the plots contain a mix of standard hourly and special observations. The maps were generated by NCAR/EOL. This data set contains imagery from the two PLOWS field phases, 27 January to 30 March 2009 and 14 October 2009 to 10 March 2010. No imagery are available for the period between the field phases.
- d
Contours, Elevation contour data are a fundamental base map layer for large...
- datadiscoverystudio.org
htmlUpdated Aug 19, 2017ShareFacebookTwitterEmailClick to copy linkLink copiedCite(2017). Contours, Elevation contour data are a fundamental base map layer for large scale mapping and GIS analysis., Published in 2001, 1:24000 (1in=2000ft) scale, Louisiana State University (LSU).. [Dataset]. http://datadiscoverystudio.org/geoportal/rest/metadata/item/288de52b206f4839a9af7cac1c931c65/htmlhtmlAvailable download formatsDataset updatedAug 19, 2017Descriptiondescription: Contours dataset current as of 2001. Elevation contour data are a fundamental base map layer for large scale mapping and GIS analysis..; abstract: Contours dataset current as of 2001. Elevation contour data are a fundamental base map layer for large scale mapping and GIS analysis..
Large Scale mapping of Stinear Peninsula
- incois.gov.in
unknownUpdated Dec 31, 2014ShareFacebookTwitterEmailClick to copy linkLink copiedCiteMr. U N Mishra (2014). Large Scale mapping of Stinear Peninsula [Dataset]. https://incois.gov.in/essdp/ViewMetadata?fileid=00e9669c-eafc-4d28-b096-aadd003da63eunknownAvailable download formatsDataset updatedDec 31, 2014AuthorsMr. U N MishraTime period coveredJan 1, 1990 - PresentArea coveredDescriptionGeneration of 1:2000 scale map of Stinear peninsula with 2 meter contour interval by combination of GPS and conventional survey methods
- i
Data from: Large-scale burn severity mapping in multispectral imagery using...
- ieee-dataport.org
Updated Mar 25, 2025ShareFacebookTwitterEmailClick to copy linkLink copiedCiteXikun Hu (2025). Large-scale burn severity mapping in multispectral imagery using deep semantic segmentation models [Dataset]. https://ieee-dataport.org/documents/large-scale-burn-severity-mapping-multispectral-imagery-using-deep-semantic-segmentationDataset updatedMar 25, 2025AuthorsXikun HuLicenseAttribution 4.0 (CC BY 4.0)https://creativecommons.org/licenses/by/4.0/
License information was derived automaticallyDescriptionreformed
Large Scale International Boundaries
- catalog.data.gov
- geodata.state.gov
- +1more
Updated Jul 22, 2025ShareFacebookTwitterEmailClick to copy linkLink copiedCiteU.S. Department of State (Point of Contact) (2025). Large Scale International Boundaries [Dataset]. https://catalog.data.gov/dataset/large-scale-international-boundariesDataset updatedJul 22, 2025DescriptionOverview The Office of the Geographer and Global Issues at the U.S. Department of State produces the Large Scale International Boundaries (LSIB) dataset. The current edition is version 11.4 (published 24 February 2025). The 11.4 release contains updated boundary lines and data refinements designed to extend the functionality of the dataset. These data and generalized derivatives are the only international boundary lines approved for U.S. Government use. The contents of this dataset reflect U.S. Government policy on international boundary alignment, political recognition, and dispute status. They do not necessarily reflect de facto limits of control. National Geospatial Data Asset This dataset is a National Geospatial Data Asset (NGDAID 194) managed by the Department of State. It is a part of the International Boundaries Theme created by the Federal Geographic Data Committee. Dataset Source Details Sources for these data include treaties, relevant maps, and data from boundary commissions, as well as national mapping agencies. Where available and applicable, the dataset incorporates information from courts, tribunals, and international arbitrations. The research and recovery process includes analysis of satellite imagery and elevation data. Due to the limitations of source materials and processing techniques, most lines are within 100 meters of their true position on the ground. Cartographic Visualization The LSIB is a geospatial dataset that, when used for cartographic purposes, requires additional styling. The LSIB download package contains example style files for commonly used software applications. The attribute table also contains embedded information to guide the cartographic representation. Additional discussion of these considerations can be found in the Use of Core Attributes in Cartographic Visualization section below. Additional cartographic information pertaining to the depiction and description of international boundaries or areas of special sovereignty can be found in Guidance Bulletins published by the Office of the Geographer and Global Issues: https://data.geodata.state.gov/guidance/index.html Contact Direct inquiries to internationalboundaries@state.gov. Direct download: https://data.geodata.state.gov/LSIB.zip Attribute Structure The dataset uses the following attributes divided into two categories: ATTRIBUTE NAME | ATTRIBUTE STATUS CC1 | Core CC1_GENC3 | Extension CC1_WPID | Extension COUNTRY1 | Core CC2 | Core CC2_GENC3 | Extension CC2_WPID | Extension COUNTRY2 | Core RANK | Core LABEL | Core STATUS | Core NOTES | Core LSIB_ID | Extension ANTECIDS | Extension PREVIDS | Extension PARENTID | Extension PARENTSEG | Extension These attributes have external data sources that update separately from the LSIB: ATTRIBUTE NAME | ATTRIBUTE STATUS CC1 | GENC CC1_GENC3 | GENC CC1_WPID | World Polygons COUNTRY1 | DoS Lists CC2 | GENC CC2_GENC3 | GENC CC2_WPID | World Polygons COUNTRY2 | DoS Lists LSIB_ID | BASE ANTECIDS | BASE PREVIDS | BASE PARENTID | BASE PARENTSEG | BASE The core attributes listed above describe the boundary lines contained within the LSIB dataset. Removal of core attributes from the dataset will change the meaning of the lines. An attribute status of “Extension” represents a field containing data interoperability information. Other attributes not listed above include “FID”, “Shape_length” and “Shape.” These are components of the shapefile format and do not form an intrinsic part of the LSIB. Core Attributes The eight core attributes listed above contain unique information which, when combined with the line geometry, comprise the LSIB dataset. These Core Attributes are further divided into Country Code and Name Fields and Descriptive Fields. County Code and Country Name Fields “CC1” and “CC2” fields are machine readable fields that contain political entity codes. These are two-character codes derived from the Geopolitical Entities, Names, and Codes Standard (GENC), Edition 3 Update 18. “CC1_GENC3” and “CC2_GENC3” fields contain the corresponding three-character GENC codes and are extension attributes discussed below. The codes “Q2” or “QX2” denote a line in the LSIB representing a boundary associated with areas not contained within the GENC standard. The “COUNTRY1” and “COUNTRY2” fields contain the names of corresponding political entities. These fields contain names approved by the U.S. Board on Geographic Names (BGN) as incorporated in the ‘"Independent States in the World" and "Dependencies and Areas of Special Sovereignty" lists maintained by the Department of State. To ensure maximum compatibility, names are presented without diacritics and certain names are rendered using common cartographic abbreviations. Names for lines associated with the code "Q2" are descriptive and not necessarily BGN-approved. Names rendered in all CAPITAL LETTERS denote independent states. Names rendered in normal text represent dependencies, areas of special sovereignty, or are otherwise presented for the convenience of the user. Descriptive Fields The following text fields are a part of the core attributes of the LSIB dataset and do not update from external sources. They provide additional information about each of the lines and are as follows: ATTRIBUTE NAME | CONTAINS NULLS RANK | No STATUS | No LABEL | Yes NOTES | Yes Neither the "RANK" nor "STATUS" fields contain null values; the "LABEL" and "NOTES" fields do. The "RANK" field is a numeric expression of the "STATUS" field. Combined with the line geometry, these fields encode the views of the United States Government on the political status of the boundary line. ATTRIBUTE NAME | | VALUE | RANK | 1 | 2 | 3 STATUS | International Boundary | Other Line of International Separation | Special Line A value of “1” in the “RANK” field corresponds to an "International Boundary" value in the “STATUS” field. Values of ”2” and “3” correspond to “Other Line of International Separation” and “Special Line,” respectively. The “LABEL” field contains required text to describe the line segment on all finished cartographic products, including but not limited to print and interactive maps. The “NOTES” field contains an explanation of special circumstances modifying the lines. This information can pertain to the origins of the boundary lines, limitations regarding the purpose of the lines, or the original source of the line. Use of Core Attributes in Cartographic Visualization Several of the Core Attributes provide information required for the proper cartographic representation of the LSIB dataset. The cartographic usage of the LSIB requires a visual differentiation between the three categories of boundary lines. Specifically, this differentiation must be between: International Boundaries (Rank 1); Other Lines of International Separation (Rank 2); and Special Lines (Rank 3). Rank 1 lines must be the most visually prominent. Rank 2 lines must be less visually prominent than Rank 1 lines. Rank 3 lines must be shown in a manner visually subordinate to Ranks 1 and 2. Where scale permits, Rank 2 and 3 lines must be labeled in accordance with the “Label” field. Data marked with a Rank 2 or 3 designation does not necessarily correspond to a disputed boundary. Please consult the style files in the download package for examples of this depiction. The requirement to incorporate the contents of the "LABEL" field on cartographic products is scale dependent. If a label is legible at the scale of a given static product, a proper use of this dataset would encourage the application of that label. Using the contents of the "COUNTRY1" and "COUNTRY2" fields in the generation of a line segment label is not required. The "STATUS" field contains the preferred description for the three LSIB line types when they are incorporated into a map legend but is otherwise not to be used for labeling. Use of the “CC1,” “CC1_GENC3,” “CC2,” “CC2_GENC3,” “RANK,” or “NOTES” fields for cartographic labeling purposes is prohibited. Extension Attributes Certain elements of the attributes within the LSIB dataset extend data functionality to make the data more interoperable or to provide clearer linkages to other datasets. The fields “CC1_GENC3” and “CC2_GENC” contain the corresponding three-character GENC code to the “CC1” and “CC2” attributes. The code “QX2” is the three-character counterpart of the code “Q2,” which denotes a line in the LSIB representing a boundary associated with a geographic area not contained within the GENC standard. To allow for linkage between individual lines in the LSIB and World Polygons dataset, the “CC1_WPID” and “CC2_WPID” fields contain a Universally Unique Identifier (UUID), version 4, which provides a stable description of each geographic entity in a boundary pair relationship. Each UUID corresponds to a geographic entity listed in the World Polygons dataset. These fields allow for linkage between individual lines in the LSIB and the overall World Polygons dataset. Five additional fields in the LSIB expand on the UUID concept and either describe features that have changed across space and time or indicate relationships between previous versions of the feature. The “LSIB_ID” attribute is a UUID value that defines a specific instance of a feature. Any change to the feature in a lineset requires a new “LSIB_ID.” The “ANTECIDS,” or antecedent ID, is a UUID that references line geometries from which a given line is descended in time. It is used when there is a feature that is entirely new, not when there is a new version of a previous feature. This is generally used to reference countries that have dissolved. The “PREVIDS,” or Previous ID, is a UUID field that contains old versions of a line. This is an additive field, that houses all Previous IDs. A new version of a feature is defined by any change to the
Data from: Large Scale Mapping Northwest of Maitri Station, Antarctica.
- incois.gov.in
unknownUpdated Sep 28, 2020ShareFacebookTwitterEmailClick to copy linkLink copiedCiteDr. Nirmalcndu Kumar (2020). Large Scale Mapping Northwest of Maitri Station, Antarctica. [Dataset]. https://incois.gov.in/essdp/ViewMetadata?fileid=2cf5f754-a0b3-462f-aaa2-8a511e25fdb1unknownAvailable download formatsDataset updatedSep 28, 2020AuthorsDr. Nirmalcndu KumarTime period coveredJan 1, 1999 - Dec 31, 2000Area coveredDescriptionAfter providing the Geodetic and Geophysical control in the Schirmucher Oasis, Survey of India has started large scale mapping in the Antarctica. The paper describes how the precise ground control network was formed which is a prerequisite for the desired large scale surveys, and the various steps involved in the detail and contour (i.e. original plane tabling) survey on 1:1,000 scale with 1 m contour interval for an area of 400 m ? 500 m located NW of Maitri. This mapping was specially done for extension of our permanent station in the Antarctica. Digital map of this area was made successfully after this fieldwork and given to concerned authorities.
- n
Large-scale digital line graph data from the U.S. Geological Survey
- cmr.earthdata.nasa.gov
Updated Jan 29, 2016+ more versionsShareFacebookTwitterEmailClick to copy linkLink copiedCite(2016). Large-scale digital line graph data from the U.S. Geological Survey [Dataset]. https://cmr.earthdata.nasa.gov/search/concepts/C1220566541-USGS_LTA.htmlDataset updatedJan 29, 2016Time period coveredJan 1, 1970 - PresentArea coveredDescriptionDigital line graph (DLG) data are digital representations of cartographic information. DLGs of map features are converted to digital form from maps and related sources. Large-scale DLG data are derived from USGS 1:20,000-, 1: 24,000-, and 1: 25,000-scale 7.5-minute topographic quadrangle maps and are available in nine categories: (1) hypsography, (2) hydrography, (3)vegetative surface cover, (4) non-vegetative features, (5) boundaries, (6)survey control and markers, (7) transportation, (8) manmade features, and (9)Public Land Survey System. All DLG data distributed by the USGS are DLG - Level 3 (DLG-3), which means the data contain a full range of attribute codes, have full topological structuring, and have passed certain quality-control checks.
- W
MeshSLAM: Robust Localization and Large-Scale Mapping in Barren Terrain,...
- cloud.csiss.gmu.edu
- data.wu.ac.at
htmlUpdated Jan 29, 2020ShareFacebookTwitterEmailClick to copy linkLink copiedCiteUnited States (2020). MeshSLAM: Robust Localization and Large-Scale Mapping in Barren Terrain, Phase II [Dataset]. https://cloud.csiss.gmu.edu/uddi/dataset/meshslam-robust-localization-and-large-scale-mapping-in-barren-terrain-phase-ii-1b24dhtmlAvailable download formatsDataset updatedJan 29, 2020Dataset provided byUnited StatesDescriptionRobots need to know their location to map of their surroundings but without global positioning data they need a map to identify their surroundings and estimate their location. Simultaneous localization and mapping (SLAM) solves these dual problems at once. SLAM does not depend on any kind of infrastructure and is thus a promising localization technology for NASA planetary missions and for many terrestrial applications as well. However, state-of-the-art SLAM depends on easily-recognizable landmarks in the robot's environment, which are lacking in barren planetary surfaces. Our work will develop a technology we call MeshSLAM, which constructs robust landmarks from associations of weak features extracted from terrain. Our test results will also show that MeshSLAM applies to all environments in which NASA's rovers could someday operate: dunes, rocky plains, overhangs, cliff faces, and underground structures such as lava tubes. Another limitation of SLAM for planetary missions is its significant data-association problems. As a robot travels it must infer its motion from the sensor data it collects, which invariably suffers from drift due to random error. To correct drift, SLAM recognize when the robot has returned to a previously-visited place, which requires searching over a great deal of previously-sensed data. Computation on such a large amount of memory may be infeasible on space-relevant hardware. MeshSLAM eases these requirements. It employs topology-based map segmentation, which limits the scope of a search. Furthermore, a faster, multi-resolution search is performed over the topological graph of observations. Mesh Robotics LLC and Carnegie Mellon University have formed a partnership to commercially develop MeshSLAM. MeshSLAM technology will be available via open source, to ease its adoption by NASA. In Phase 1 of our project we will show the feasibility of MeshSLAM for NASA and commercial applications through a series of focused technical demonstrations.
- a
Large Scale Community/Topographic Mapping
- geohub-gnl.hub.arcgis.com
- data-with-cpaws-nl.hub.arcgis.com
Updated Aug 10, 2018ShareFacebookTwitterEmailClick to copy linkLink copiedCiteGovernment of Newfoundland and Labrador (2018). Large Scale Community/Topographic Mapping [Dataset]. https://geohub-gnl.hub.arcgis.com/app/large-scale-community-topographic-mappingDataset updatedAug 10, 2018Dataset authored and provided byGovernment of Newfoundland and LabradorDescriptionLarge scale community mapping at scales of 1:2500 and 1:5000 derived from aerial photography and detailed mapping processes. Community mapping in this application exists as Vector Tiles.
A first high-quality vector data of buildings in East Asian countries based...
- zenodo.org
zipUpdated Jul 23, 2023ShareFacebookTwitterEmailClick to copy linkLink copiedCiteQian Shi; Jiajun Zhu; Zhengyu Liu; Haonan Guo; Mengxi Liu; Zihong Liu; Xiaoping Liu; Qian Shi; Jiajun Zhu; Zhengyu Liu; Haonan Guo; Mengxi Liu; Zihong Liu; Xiaoping Liu (2023). A first high-quality vector data of buildings in East Asian countries based on a comprehensive large-scale mapping framework [Dataset]. http://doi.org/10.5281/zenodo.8174931zipAvailable download formatsUnique identifierhttps://doi.org/10.5281/zenodo.8174931Dataset updatedJul 23, 2023AuthorsQian Shi; Jiajun Zhu; Zhengyu Liu; Haonan Guo; Mengxi Liu; Zihong Liu; Xiaoping Liu; Qian Shi; Jiajun Zhu; Zhengyu Liu; Haonan Guo; Mengxi Liu; Zihong Liu; Xiaoping LiuLicenseAttribution 4.0 (CC BY 4.0)https://creativecommons.org/licenses/by/4.0/
License information was derived automaticallyArea coveredEast Asia, AsiaDescriptionWe generate a high-quality and complete vector data of buildings in East Asian regions, including China, Japan, North Korea, South Korea and Mongolia, filling the gaps in the existing public buildings data.
Data from: Large Scale Mapping in Schirmacher Oasis in Antarctica.
- incois.gov.in
unknownUpdated Oct 1, 2020ShareFacebookTwitterEmailClick to copy linkLink copiedCiteDr. Rajesh Kumar Pal (2020). Large Scale Mapping in Schirmacher Oasis in Antarctica. [Dataset]. https://incois.gov.in/essdp/ViewMetadata?fileid=dd88a36b-da98-4430-a630-917421ca5f46unknownAvailable download formatsDataset updatedOct 1, 2020AuthorsDr. Rajesh Kumar PalTime period coveredJan 1, 2002 - Dec 31, 2003Area coveredDescriptionThe Survey of India has been associated with the Indian Antarctic Research Programme since X Expedition to carry out surveying and mapping in Antarctica. During X Expedition Geodetic control points had been established in Schirmacher Oasis. In XI & XII Expedition the original plane table (PI) survey work had been carried out on 1:5,000 scale with 5 m contour interval using the control points established by the SOI team of X Expedition. During these two Expeditions, an area of 3.2 sq. km. was covered by survey teams. From XIII Expedition onwards (except XVII) SOI teams have been doing original P.T. survey on 1: 5,000 scale with 1 m contour interval.
- N
Atlases of cognition with large-scale human brain mapping: visual words
- neurovault.org
niftiUpdated Dec 3, 2018+ more versionsShareFacebookTwitterEmailClick to copy linkLink copiedCite(2018). Atlases of cognition with large-scale human brain mapping: visual words [Dataset]. http://identifiers.org/neurovault.image:109683niftiAvailable download formatsUnique identifierhttps://identifiers.org/neurovault.image:109683Dataset updatedDec 3, 2018LicenseCC0 1.0 Universal Public Domain Dedicationhttps://creativecommons.org/publicdomain/zero/1.0/
License information was derived automaticallyDescriptionvisual_words.nii.gz
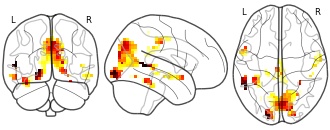
Collection description
Atlases of various aspects of cognition estimated via large-scale decoding across many studies
Subject species
homo sapiens
Map type
Other
- d
ORTHOIMAGERY, CITY OF POQUOSON, VIRGINIA, USA.
- datadiscoverystudio.org
shtmlUpdated Nov 14, 2017ShareFacebookTwitterEmailClick to copy linkLink copiedCite(2017). ORTHOIMAGERY, CITY OF POQUOSON, VIRGINIA, USA. [Dataset]. http://datadiscoverystudio.org/geoportal/rest/metadata/item/e9c196543b834ec2879d8f8a7abc5b00/htmlshtmlAvailable download formatsDataset updatedNov 14, 2017Area coveredUnited States, VirginiaDescriptiondescription: These files contain Digital Orthophoto files for the State of Virginia developed from imagery acquired in spring 2007. In the spring of 2006, the Commonwealth of Virginia, through the Virginia Geographic Information Network Division (herein referred to as VGIN) of the Virginia Information Technologies Agency (VITA) contracted with the Sanborn Map Company to provide aerial data acquisition, ground control, aerotriangulation and development of statewide DTM and digital orthophotography. Approximately 15% of the State was acquired in the year 2006 and the balance in 2007. All data acquired in 2006 is jurisdiction based. The data acquired in 2007 includes overlap along the boundaries of jurisdictions captured in the previous year 2006. This ensures each jurisdiction has full coverage from either Year 2006 or 2007 without 'mixing' imagery vintage along the edge of a jurisdiction. The project encompasses the entire land area of the Commonwealth of Virginia. The State boundary is buffered by 1000'. Coastal areas of the State bordering the Atlantic Ocean or the Chesapeake Bay are buffered by 1000' or the extent of man-made features extending from shore. The entire State was intially designed to support 1"=200' (1:2400) scale mapping. Jurisdictions throughout the State were provided an option to upgrade to a 1"=100' (1:1200) map scale. All data development processes for the DTM conform to the ASPRS Draft Aerial Photography Standards (1995) and Model Virginia Map Accuracy Standards (1992), which generally follow the ASPRS Accuracy Standard for Large-Scale Mapping (1990) for relevant mapping scales. The DTM supports the creation of 6-inch or 1-foot map orthoimagery at the relevant scales.; abstract: These files contain Digital Orthophoto files for the State of Virginia developed from imagery acquired in spring 2007. In the spring of 2006, the Commonwealth of Virginia, through the Virginia Geographic Information Network Division (herein referred to as VGIN) of the Virginia Information Technologies Agency (VITA) contracted with the Sanborn Map Company to provide aerial data acquisition, ground control, aerotriangulation and development of statewide DTM and digital orthophotography. Approximately 15% of the State was acquired in the year 2006 and the balance in 2007. All data acquired in 2006 is jurisdiction based. The data acquired in 2007 includes overlap along the boundaries of jurisdictions captured in the previous year 2006. This ensures each jurisdiction has full coverage from either Year 2006 or 2007 without 'mixing' imagery vintage along the edge of a jurisdiction. The project encompasses the entire land area of the Commonwealth of Virginia. The State boundary is buffered by 1000'. Coastal areas of the State bordering the Atlantic Ocean or the Chesapeake Bay are buffered by 1000' or the extent of man-made features extending from shore. The entire State was intially designed to support 1"=200' (1:2400) scale mapping. Jurisdictions throughout the State were provided an option to upgrade to a 1"=100' (1:1200) map scale. All data development processes for the DTM conform to the ASPRS Draft Aerial Photography Standards (1995) and Model Virginia Map Accuracy Standards (1992), which generally follow the ASPRS Accuracy Standard for Large-Scale Mapping (1990) for relevant mapping scales. The DTM supports the creation of 6-inch or 1-foot map orthoimagery at the relevant scales.
- Z
SyntheWorld: A Large-Scale Synthetic Dataset for Land Cover Mapping and...
- data.niaid.nih.gov
- zenodo.org
Updated Sep 20, 2023ShareFacebookTwitterEmailClick to copy linkLink copiedCiteHongruixuan Chen (2023). SyntheWorld: A Large-Scale Synthetic Dataset for Land Cover Mapping and Building Change Detection [Dataset]. https://data.niaid.nih.gov/resources?id=zenodo_8349018Dataset updatedSep 20, 2023Dataset provided byJian Song
Hongruixuan Chen
Naoto YokoyaLicenseAttribution 4.0 (CC BY 4.0)https://creativecommons.org/licenses/by/4.0/
License information was derived automaticallyDescriptionPaper Accept by WACV 2024
[paper, supp] [arXiv]
Overview
Synthetic datasets, recognized for their cost effectiveness, play a pivotal role in advancing computer vision tasks and techniques. However, when it comes to remote sensing image processing, the creation of synthetic datasets becomes challenging due to the demand for larger-scale and more diverse 3D models. This complexity is compounded by the difficulties associated with real remote sensing datasets, including limited data acquisition and high annotation costs, which amplifies the need for high-quality synthetic alternatives. To address this, we present SyntheWorld, a synthetic dataset unparalleled in quality, diversity, and scale. It includes 40,000 images with submeter-level pixels and fine-grained land cover annotations of eight categories, and it also provides 40,000 pairs of bitemporal image pairs with building change annotations for building change detection task. We conduct experiments on multiple benchmark remote sensing datasets to verify the effectiveness of SyntheWorld and to investigate the conditions under which our synthetic data yield advantages.
Description
This dataset has been designed for land cover mapping and building change detection tasks.
File Structure and Content:
1024.zip:
- Contains images of size 1024x1024 with a GSD (Ground Sampling Distance) of 0.6-1m.
imagesandss_maskfolders: Used for the land cover mapping task.imagesfolder: Post-event images for building change detection.small-pre-images: Images with a minor off-nadir angle difference compared to post-event images.big-pre-images: Images with a large off-nadir angle difference compared to post-event images.cd_mask: Ground truth for the building change detection task.
512-1.zip, 512-2.zip, 512-3.zip:
- Contains images of size 512x512 with a GSD of 0.3-0.6m.
imagesandss_maskfolders: Used for the land cover mapping task.imagesfolder: Post-event images for building change detection.pre-eventfolder: Images for the pre-event phase.cd-mask: Ground truth for building change detection.
Land Cover Mapping Class Grep Map:
class_grey = { "Bareland": 1, "Rangeland": 2, "Developed Space": 3, "Road": 4, "Tree": 5, "Water": 6, "Agriculture land": 7, "Building": 8, }
Reference
@misc{song2023syntheworld, title={SyntheWorld: A Large-Scale Synthetic Dataset for Land Cover Mapping and Building Change Detection}, author={Jian Song and Hongruixuan Chen and Naoto Yokoya}, year={2023}, eprint={2309.01907}, archivePrefix={arXiv}, primaryClass={cs.CV} }
Large-scale Forest Stand Height mapping for the northeast of U.S. and China...
- zenodo.org
- data.niaid.nih.gov
tiffUpdated Aug 29, 2024ShareFacebookTwitterEmailClick to copy linkLink copiedCiteYanghai Yu; Yanghai Yu; Yang Lei; Yang Lei (2024). Large-scale Forest Stand Height mapping for the northeast of U.S. and China using L-band spaceborne repeat-pass InSAR and GEDI [Dataset]. http://doi.org/10.5281/zenodo.11142224tiffAvailable download formatsUnique identifierhttps://doi.org/10.5281/zenodo.11142224Dataset updatedAug 29, 2024AuthorsYanghai Yu; Yanghai Yu; Yang Lei; Yang LeiLicenseAttribution 4.0 (CC BY 4.0)https://creativecommons.org/licenses/by/4.0/
License information was derived automaticallyTime period coveredMay 8, 2024Area coveredNortheastern United States, United States, ChinaDescriptionThe forest height mosaic for the northeastern parts of China and U.S are generated based on a global-to-local inversion approach proposed in (Yu et al., 2023) by making use of Spaceborne repeat-pass InSAR and spaceborne GEDI data. The sparsely but extensively distributed LiDAR samples provided by NASA’s GEDI mission are used to parametrize the semi-empirical repeat-pass InSAR scattering model(Lei et al., 2017) and to obtain forest height estimates. Compared to our previous efforts (Lei et al., 2018, Lei and Siqueira, 2022), this paper further removes the assumptions that were made given the limited availability of calibration samples at that time, and developed a new inversion approach based on a global-to-local two-stage inversion scheme. This approach allows a better use of local GEDI samples to achieve finer characterization of temporal decorrelation pattern and thus higher accuracy of forest height inversion. This approach is further fully automated to enable a large-scale forest mapping capability. Two forest height mosaic maps were generated for the entire northeastern regions of U.S. and China with total area of 18 million hectares and 112 million hectares, respectively. The validation of the forest height estimates demonstrates much improved accuracy achieved by the proposed approach compared to the previous efforts i.e., reducing from RMSE of 3-4 m on the order of 3-6-hectare aggregated pixel size to RMSE 3-4 m on the order of 0.81-hectare pixel size. The proposed fusion approach not only addresses the sparse spatial sampling problem inherent to the GEDI mission, but also improve the accuracy of forest height estimates compared to the GEDI-interpolated maps by a factor of 20% at 30-m resolution. The extensive evaluation of forest height inversion against LVIS LiDAR data indicates an accuracy 3-4 m on the order of 0.81 hectare over smooth areas and 4-5 m over hilly areas in U.S., whereas the forest height estimates over northeastern China are best compared with small footprint LiDAR validation data even at an accuracy of even below 3.5 m with R2 mostly above 0.6. Such a forest height inversion accuracy at sub-hectare pixel size provides promising values towards the existing and future spaceborne LiDAR (JAXA’s MOLI, NASA’s GEDI, China’s TECIS) and InSAR missions (NASA-ISRO’s NISAR, JAXA’s ALOS-4 and China’s LuTan-1). This fusion prototype can work as a cost-effective solution for public users to obtain a wall-to-wall forest height mapping at large scale when only spaceborne repeat-pass InSAR data are available and freely accessible.
- N
Atlases of cognition with large-scale human brain mapping: human sound
- neurovault.org
niftiUpdated Dec 3, 2018+ more versionsShareFacebookTwitterEmailClick to copy linkLink copiedCite(2018). Atlases of cognition with large-scale human brain mapping: human sound [Dataset]. http://identifiers.org/neurovault.image:109669niftiAvailable download formatsUnique identifierhttps://identifiers.org/neurovault.image:109669Dataset updatedDec 3, 2018LicenseCC0 1.0 Universal Public Domain Dedicationhttps://creativecommons.org/publicdomain/zero/1.0/
License information was derived automaticallyDescriptionhuman_sound.nii.gz
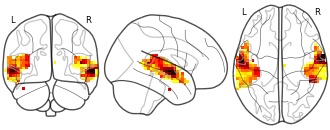
Collection description
Atlases of various aspects of cognition estimated via large-scale decoding across many studies
Subject species
homo sapiens
Map type
Other
Data from: Globe230k: A Benchmark Dense-Pixel Annotation Dataset for Global...
- zenodo.org
txt, zipUpdated Jul 7, 2024ShareFacebookTwitterEmailClick to copy linkLink copiedCiteQian Shi; Da He; Zhengyu Liu; Xiaoping Liu; Jingqian Xue; Qian Shi; Da He; Zhengyu Liu; Xiaoping Liu; Jingqian Xue (2024). Globe230k: A Benchmark Dense-Pixel Annotation Dataset for Global Land Cover Mapping [Dataset]. http://doi.org/10.5281/zenodo.10435661txt, zipAvailable download formatsUnique identifierhttps://doi.org/10.5281/zenodo.10435661Dataset updatedJul 7, 2024AuthorsQian Shi; Da He; Zhengyu Liu; Xiaoping Liu; Jingqian Xue; Qian Shi; Da He; Zhengyu Liu; Xiaoping Liu; Jingqian XueLicenseAttribution 4.0 (CC BY 4.0)https://creativecommons.org/licenses/by/4.0/
License information was derived automaticallyDescriptionWe (Intelligent Mining and Analysis of Remote Sensing big data, IMARS) create a large-scale annotated dataset (Globe230k) for land use/land cover (LULC) mapping, which is annotated on Google Earth image of 1 m spatial resolution. Globe230k is annotated by numerous experts and students major in survey and mapping after necessary training, through visual interpretation on very high-resolution images, as well as in-situ field survey, under the guidance of the organized annotation pipeline. Globe230k has three superiorities:
1) Large scale: the Globe230k includes 232,819 annotated images with the size of 512x512 and spatial resolution of 1 m, with more than 3x10¹⁰ annotated pixels, and it includes 10 first-level categories.
2) Rich diversity: the annotated images are sampled from worldwide regions, with coverage area of over 60,000 km2, indicating a high variability and diversity. Besides, in order to ensure the category balance, we intentionally give more chance to the rare categories to be sampled, such as wetland, ice/snow, etc.
3) Multi-modal: Globe230k not only contains RGB bands, but also include other important features for Earth system research, such as Normalized differential vegetation index (NDVI), digital elevation model (DEM), vertical-vertical polarization (VV) bands, vertical-horizontal polarization (VH) bands, which can facilitate the multi-modal data fusion research. Due to the large size of the multi-modal dataset (DEM 1.91G, NDVI 164G, VVVH 372G), these dataset are stored on Baidu Yunpan, the download link is :https://pan.baidu.com/s/12AKbiqOXSf4fnm7mYkCE0g?pwd=230k, the extraction code is 230k.
The image patches and their corresponding annotated patches are respectively stored in "image_patch.zip" and "label_patch.zip" file. The RGB image is in forms of ".jpg", with size of 512x512, the pixel value is ranged from 0-255. The annotated patches is in forms of ".png", also with size of 512x512, the pixel value is ranged from 1-10, which respectively represent 1#cropland, 2#forest, 3#grass, 4#shrubland, 5#wetland, 6#water, 7#tundra, 8#impervious, 9#bareland, 10#ice/snow. The corresponding DEM, NDVI and VVVH patches are all in form of ".tif", with size of 512x512 (due to the different resolution of DEM, NDVI and VVVH patches, they are all uniformly resized to the same scale as the image patch).
The total 232,819 pairs are officially divided into training set, validation set, and test set, based on ratio of 7:1:2, which can be find in "train_num.txt","val_num.txt","test_num.txt" file. Based on this division, the official baseline accuracy of several state-of-the-art semantic segmentation can be found in the related arcticle (https://spj.science.org/doi/10.34133/remotesensing.0078).
We hope it can be used as a benchmark to promote further development of global land cover mapping and semantic segmentation algorithm development.
- f
Data from: An innovative lightweight 1D-CNN model for efficient monitoring...
- tandf.figshare.com
tiffUpdated Dec 22, 2023ShareFacebookTwitterEmailClick to copy linkLink copiedCiteYe Ma; Zhen Zhen; Fengri Li; Fujuan Feng; Yinghui Zhao (2023). An innovative lightweight 1D-CNN model for efficient monitoring of large-scale forest composition: a case study of Heilongjiang Province, China [Dataset]. http://doi.org/10.6084/m9.figshare.24543736.v1tiffAvailable download formatsUnique identifierhttps://doi.org/10.6084/m9.figshare.24543736.v1Dataset updatedDec 22, 2023Dataset provided byTaylor & FrancisAuthorsYe Ma; Zhen Zhen; Fengri Li; Fujuan Feng; Yinghui ZhaoLicenseAttribution 4.0 (CC BY 4.0)https://creativecommons.org/licenses/by/4.0/
License information was derived automaticallyArea coveredHeilongjiang, ChinaDescriptionLarge-scale forest composition mapping and change monitoring are essential for regional and national forest resource management, monitoring, and carbon stock assessment. However, the existing large-scale mapping methods are not effective enough in terms of efficiency and accuracy. To address this limitation, this study proposes a lightweight one-dimensional convolutional neural network (LW-CNN) model for forest composition mapping. The LW-CNN model is developed using Landsat imagery covering 470,700 km2 obtained from Google Earth Engine (GEE) collected during two periods (2007 and 2018). The proposed LW-CNN is compared with a visual geometry group with 16 convolutional layers (VGG16), a residual network with 34 convolutional layers (Resnet34), and a residual network with 50 convolutional layers (Resnet50) in terms of model accuracy and efficiency. The factors influencing forest composition change are analyzed using the structural equation model (SEM). The results show that the proposed LW-CNN model can outperform the other three models in terms of model accuracy, achieving a mean overall accuracy (OA) of: 0.75 and efficiency of 7–22-fold. The changed forest composition from 2007 to 2018 accounts for 29.6% of the total forest area. The SEM results show that the climate factors have the most significant effect on the forest composition change. This study presents an innovative model for large-scale forest composition mapping, which is proven to be both efficient and accurate. This study also provides insights into the factors that affect the forest composition change, which could be valuable for forest resource management, monitoring, and carbon stock assessment.
SinoLC-1: the first 1-meter resolution national-scale land-cover map of...
- zenodo.org
tiff, zipUpdated Jul 9, 2025+ more versionsShareFacebookTwitterEmailClick to copy linkLink copiedCiteZhuohong Li; Zhuohong Li; Wei He; Mofan Cheng; Jingxin Hu; Xiao An; Yan Huang; Yan Huang; Guangyi Yang; Hongyan Zhang; Wei He; Mofan Cheng; Jingxin Hu; Xiao An; Guangyi Yang; Hongyan Zhang (2025). SinoLC-1: the first 1-meter resolution national-scale land-cover map of China created with the deep learning framework and open-access data (Update data: August, 2023) [Dataset]. http://doi.org/10.5281/zenodo.8214467zip, tiffAvailable download formatsUnique identifierhttps://doi.org/10.5281/zenodo.8214467Dataset updatedJul 9, 2025AuthorsZhuohong Li; Zhuohong Li; Wei He; Mofan Cheng; Jingxin Hu; Xiao An; Yan Huang; Yan Huang; Guangyi Yang; Hongyan Zhang; Wei He; Mofan Cheng; Jingxin Hu; Xiao An; Guangyi Yang; Hongyan ZhangLicenseAttribution 4.0 (CC BY 4.0)https://creativecommons.org/licenses/by/4.0/
License information was derived automaticallyDescriptionThe Update data (August 2023) of the SinoLC-1 land-cover product. The SinoLC-1 was created by the Low-to-High Network (L2HNet), which can be found at: L2HNet. A more detailed description of the data can be found in the paper. More related work can be found on my homepage.
Click to check all the data versions and download the data (点击查看/下载所有数据版本)
NOTE: If you have any data needs, questions, or technical issues, contact us at ashelee@whu.edu.cn (Zhuohong Li, 李卓鸿).
The land-cover mapping method with Python code is open-access at Code link. You can now update the high-resolution land-cover map by yourself with the code! The updated method is accepted by CVPR 2024 (Paper link).
我们的最新制图算法被计算机视觉顶会CVPR2024接收(Paper link),代码开源在:Code link,您可以利用该代码高效地更新自己数据集的高分土地覆盖图。
Citation format of the paper:
Li, Z., He, W., Cheng, M., Hu, J., Yang, G., and Zhang, H.: SinoLC-1: the first 1 m resolution national-scale land-cover map of China created with a deep learning framework and open-access data, Earth Syst. Sci. Data, 15, 4749–4780, 2023.Li, Z., Zhang, H., Lu, F., Xue, R., Yang, G. and Zhang, L.: Breaking the resolution barrier: A low-to-high network for large-scale high-resolution land-cover mapping using low-resolution labels, ISPRS Journal of Photogrammetry and Remote Sensing. 192, pp.244-267, 2022.
BibTex format of the paper:
@article{li2023sinolc,
 title={SinoLC-1: the first 1 m resolution national-scale land-cover map of China created with a deep learning framework and open-access data},
 author={Li, Zhuohong and He, Wei and Cheng, Mofan and Hu, Jingxin and Yang, Guangyi and Zhang, Hongyan},
 journal={Earth System Science Data},
 volume={15},
 number={11},
 pages={4749--4780},
 year={2023},
 publisher={Copernicus Publications G{\"o}ttingen, Germany}
}
@article{li2022breaking, title={Breaking the resolution barrier: A low-to-high network for large-scale high-resolution land-cover mapping using low-resolution labels}, author={Li, Zhuohong and Zhang, Hongyan and Lu, Fangxiao and Xue, Ruoyao and Yang, Guangyi and Zhang, Liangpei}, journal={ISPRS Journal of Photogrammetry and Remote Sensing}, volume={192}, pages={244--267}, year={2022}, publisher={Elsevier} }- m
Data from: Large-scale mapping of iron oxide and hydroxide minerals of...
- data.mendeley.com
Updated Jun 26, 2018ShareFacebookTwitterEmailClick to copy linkLink copiedCiteTouba Salehi (2018). Large-scale mapping of iron oxide and hydroxide minerals of Zefreh porphyry copper deposit, using Worldview-3 VNIR data in the Northeastern Isfahan, Iran [Dataset]. http://doi.org/10.17632/swczrzv8f7.1Unique identifierhttps://doi.org/10.17632/swczrzv8f7.1Dataset updatedJun 26, 2018AuthorsTouba SalehiLicenseAttribution 4.0 (CC BY 4.0)https://creativecommons.org/licenses/by/4.0/
License information was derived automaticallyArea coveredIsfahan, Zefreh, IranDescriptionEvaluating the Worldview-3 VNIR data for mapping iron oxide and hydroxide minerals
FacebookTwitterThis data set contains maps of surface weather observations over the western two-thirds of the US and southern Canada. The latest observation at the time the plot was generated was utilized, so the plots contain a mix of standard hourly and special observations. The maps were generated by NCAR/EOL. This data set contains imagery from the two PLOWS field phases, 27 January to 30 March 2009 and 14 October 2009 to 10 March 2010. No imagery are available for the period between the field phases.