- s
London Boroughs (December 2017) Map in London
- geoportal.statistics.gov.uk
- hub.arcgis.com
- +1more
Updated Apr 24, 2018 Share
Share Facebook
 Twitter
 EmailClick to copy linkLink copiedCiteOffice for National Statistics (2018). London Boroughs (December 2017) Map in London [Dataset]. https://geoportal.statistics.gov.uk/documents/ons::london-boroughs-december-2017-map-in-london-1/aboutDataset updatedApr 24, 2018Dataset authored and provided byOffice for National StatisticsLicense
https://www.ons.gov.uk/methodology/geography/licenceshttps://www.ons.gov.uk/methodology/geography/licences
Area coveredDescriptionA PDF map of the London boroughs as at December 2017. The map shows the London boroughs split into inner London and outer London. (File Size - 227 KB).
- e
Excel Mapping Template for London Boroughs and Wards
- data.europa.eu
- ckan.publishing.service.gov.uk
Updated Oct 16, 2014+ more versionsShareFacebookTwitterEmailClick to copy linkLink copiedCiteGreater London Authority (2014). Excel Mapping Template for London Boroughs and Wards [Dataset]. https://data.europa.eu/88u/dataset/excel-mapping-template-for-london-boroughs-and-wards1Dataset updatedOct 16, 2014Dataset authored and provided byGreater London AuthorityArea coveredLondonDescriptionA free mapping tool that allows you to create a thematic map of London without any specialist GIS skills or software - all you need is Microsoft Excel. Templates are available for London’s Boroughs and Wards. Full instructions are contained within the spreadsheets.
Macros
The tool works in any version of Excel. But the user MUST ENABLE MACROS, for the features to work. There a some restrictions on functionality in the ward maps in Excel 2003 and earlier - full instructions are included in the spreadsheet.
To check whether the macros are enabled in Excel 2003 click Tools, Macro, Security and change the setting to Medium. Then you have to re-start Excel for the changes to take effect. When Excel starts up a prompt will ask if you want to enable macros - click yes.
In Excel 2007 and later, it should be set by default to the correct setting, but if it has been changed, click on the Windows Office button in the top corner, then Excel options (at the bottom), Trust Centre, Trust Centre Settings, and make sure it is set to 'Disable all macros with notification'. Then when you open the spreadsheet, a prompt labelled 'Options' will appear at the top for you to enable macros.
To create your own thematic borough maps in Excel using the ward map tool as a starting point, read these instructions. You will need to be a confident Excel user, and have access to your boundaries as a picture file from elsewhere. The mapping tools created here are all fully open access with no passwords.
Copyright notice: If you publish these maps, a copyright notice must be included within the report saying: "Contains Ordnance Survey data © Crown copyright and database rights."
NOTE: Excel 2003 users must 'ungroup' the map for it to work.
- g
London Heat Map
- gimi9.com
Updated Jul 9, 2025+ more versionsShareFacebookTwitterEmailClick to copy linkLink copiedCite(2025). London Heat Map [Dataset]. https://gimi9.com/dataset/uk_london-heat-mapDataset updatedJul 9, 2025Area coveredLondonDescriptionLondon Heat Map --------------- The London Heat Map is a tool designed to help you identify areas of high heat demand, explore opportunities for new and expanding district heat networks and to draw potential heat networks and assess their financial feasibility. The new version of the London Heat Map was created for the Greater London Authority by the Centre for Sustainable Energy (CSE) in July 2019. The London Heat Map is regularly updated with new network data and other datasets. Background datasets such as building heat demand was last updated on 26/06/2023. The London Heatmap is a map-based web application you can use to find and appraise opportunities for decentralised energy (DE) projects in London. The map covers the whole of Greater London, and provides very local information to help you identify and develop DE opportunities, including data such as: * Heat demand values for each building * Locations of potential heat supply sites * Locations of existing and proposed district heating networks * A spatial heat demand density map layer The map also includes a user-friendly visual tool for heat network design. This is intended to support preliminary techno-economic appraisal of potential district heat networks. The London Heat Map is used by a wide variety of people in numerous ways: * London Boroughs can use the new map to help develop their energy master plans. * Property developers can use the map to help them meet the decentralised energy policies in the London Plan. * Energy consultants can use the map to gather initial data to inform feasibility studies. More information is available here, and an interactive map is available here. Building-level estimated annual and peak heat demand data from the London Heat Map has been made available through the data extracts below. The data was last updated on 26/06/2023. The data contains Ordnance Survey mapping and the data is published under Ordnance Survey's 'presumption to publish'. © Crown copyright and database rights 2023. The Decentralised Energy Master planning programme (DEMaP) ---------------------------------------------------------- The Decentralised Energy Master planning programme (DEMaP), was completed in October 2010. It included a heat mapping support package for the London boroughs to enable them to carry out high resolution heat mapping for their area. To date, heat maps have been produced for 29 London boroughs with the remaining four boroughs carrying out their own data collection. All of the data collected through this process is provided below. ### Carbon Calculator Tool Arup have produced a Carbon Calculator Tool to assist projects in their early estimation of the carbon dioxide (CO2) savings which could be realised by a district heating scheme with different sources of heating. The calculator's estimates include the impact of a decarbonising the electrical grid over time, based on projections by the Department for Energy and Climate Change, as well as the Government's Standard Assessment Procedure (SAP). The Excel-based tool can be downloaded below. ### Borough Heat Maps Data and Reports (2012) In March 2012, all London boroughs did a heat mapping exercise. The data from this includes the following and can be downloaded below: * Heat Load for all boroughs * Heat Supplies for all boroughs * Heat Network * LDD 2010 database * Complete GIS London Heat Map Data The heat maps contain real heat consumption data for priority buildings such as hospitals, leisure centres and local authority buildings. As part of this work, each of the boroughs developed implementation plans to help them take the DE opportunities identified to the next stages. The implementation plans include barriers and opportunities, actions to be taken by the council, key dates, personnel responsible. These can be downloaded below. Other Useful Documents ---------------------- Other useful documents can be downloaded from the links below: Energy Masterplanning Manual Opportunities for Decentralised Energy in London - Vision Map London Heat Network Manual London Heat Network Manual II
- e
Council Boundaries
- data.europa.eu
html, unknownUpdated Dec 1, 2015ShareFacebookTwitterEmailClick to copy linkLink copiedCiteLondon Borough of Lambeth (2015). Council Boundaries [Dataset]. https://data.europa.eu/data/datasets/council-boundariesunknown, htmlAvailable download formatsDataset updatedDec 1, 2015Dataset authored and provided byLondon Borough of LambethDescription{{default.description}}
- e
Ward Maps
- data.europa.eu
- ckan.publishing.service.gov.uk
Updated Apr 24, 2023+ more versionsShareFacebookTwitterEmailClick to copy linkLink copiedCiteLondon Borough of Barnet (2023). Ward Maps [Dataset]. https://data.europa.eu/data/datasets/ward-maps?locale=enDataset updatedApr 24, 2023Dataset authored and provided byLondon Borough of BarnetDescriptionThe London Borough of Barnet is divided into 24 electoral Wards. The current warding arrangement came into effect on 5th May 2022. These maps have been created as general resource for the council. The information is sourced from Ordnance Survey Open Data products and may be used more widely subject to the Open Government Licence (v3). Each ward map is available in 2 different sizes, in pdf format and includes an approximate scale and information currency.
Ward boundary information is from OS Boundary-Line™ (normally released in May and October) The A3 base map information is from OS OpenMap - Local (normally released in April and October) The A4 base map information is from OS VectorMap District (normally released in May and November)
Only the latest version of the maps are published and older versions are not retained. Please note: these maps may not reflect the latest information published by Ordnance Survey, see document dates for date last updated.
- a
BromleyMapWAdditions2
- dgah-210-carleton.hub.arcgis.com
Updated Mar 13, 2024+ more versionsShareFacebookTwitterEmailClick to copy linkLink copiedCiteCarleton College (2024). BromleyMapWAdditions2 [Dataset]. https://dgah-210-carleton.hub.arcgis.com/datasets/bromleymapwadditions2Dataset updatedMar 13, 2024Dataset authored and provided byCarleton CollegeDescriptionLondon City Council Bomb Damage Map - A georeferenced image of the London City Council's Bomb Damage Map of Bromley. These maps are hand-colored maps created within the Architects Department of the LLC. Their function was to record the damage to buildings in London caused by air raids and V-weapons during the Blitz and World War II. The features on this map were hand digitized by importing new polygon and point layers. (Citation: Ward, Laurence. The London City Council Bomb Damage Maps, 1939 - 1945. London, Thames & Hudson, 2016.)
- e
Borough Council Election Results 2014
- data.europa.eu
excel xls, pdfUpdated Dec 1, 2014+ more versionsShareFacebookTwitterEmailClick to copy linkLink copiedCiteGreater London Authority (2014). Borough Council Election Results 2014 [Dataset]. https://data.europa.eu/data/datasets/borough-council-election-results-2014excel xls, pdfAvailable download formatsDataset updatedDec 1, 2014Dataset authored and provided byGreater London AuthorityDescription
This report includes a great deal of detail on every aspect of the 2014 London Borough council general elections. No other single volume presents the full results and election statistics from the 32 London boroughs enabling the reader to analyse and compare the results across London in one place. The report presents data for every candidate in every ward (excluding the City of London which operates on a different electoral model). The report also contains analysis of the European election results for London that took place on the same day.
Printed Copies We are able to accept orders for hard copies £30. Click here for further details.
Details of all previous elections reports in the series can be found here.
Summary results of the 2014 local elections in London, showing number and percentage of seats won, turnout and political control.
Final 2014 ward results
These results show the number of votes for each candidate in each ward in London. Turnout, number of ballots, postal votes, and breakdown of rejected votes, Mayoral and European voting figures are also included where available.
Map showing political control in each ward.
https://londondatastore-upload.s3.amazonaws.com/images/London-ward-map-borough-election-2014-new-colours-small.png" alt="">
Also, using these ward results, Oliver O'Brien from CASA has created some eye catching interactive ward maps.
The borough map shows the summary results in both the 2010 and 2014 elections.
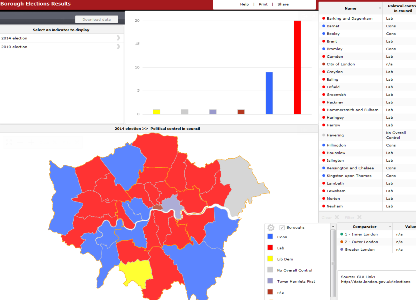
The ward interactive map shows the detailed results for each candidate at ward level for the last three elections between 2006 and 2014.

This motion chart shows the relationship, between share of votes and seats won by the major parties in elections since 1964 at borough level (requires Adobe Flash Player).
 )
) Conservation Areas - Dataset - data.gov.uk
- ckan.publishing.service.gov.uk
Updated Jan 12, 2023+ more versionsShareFacebookTwitterEmailClick to copy linkLink copiedCiteckan.publishing.service.gov.uk (2023). Conservation Areas - Dataset - data.gov.uk [Dataset]. https://ckan.publishing.service.gov.uk/dataset/conservation-areas95Dataset updatedJan 12, 2023DescriptionThe dataset contains polygons for conservation areas within the London Borough of Barnet. Conservation areas are those areas identified by the Local Planning Authority as having special architectural or historic interest which merits designation. Conservation area character appraisals, boundary maps and guidance notes can be downloaded from the Council’s website. This data is an active and changing record of conservation area boundaries in the London Borough of Barnet. Conservation Areas were introduced through the Civic Amenities Act 1967. They are ‘areas of special architectural or historic interest, the character and appearance of which it is desirable to preserve or enhance’ (Section 69(1)(a) of the Planning (Listed Buildings and Conservation Areas) Act 1990). Conservation Area status acknowledges the importance of an area, highlighting its real and potential attractiveness. It also means that the council’s efforts in the area are geared to preserving and enhancing its special character. **Footnote - Barnet is one of the Local Planning Authorities that received Government funding to improve their planning services through the Local Digital Fund. This aims to digitise Planning to make land and housing data easier to find, understand, use and trust. This data is also available on View planning and housing datasets with geographic location data on an interactive map here. Map of planning data for England | Planning Data (Conservation Areas) The maps also show statutory listed buildings (the data being provided by Barnet) Licence This dataset has been published by the London Borough of Barnet under the Open Government Licence (OGL) (v3). The licence has been applied following the Public Sector Geospatial Agreement 'presumption to publish' process in December 2022. Acknowledgements Please acknowledge the Information Provider through the following attribution statement: © London Borough of Barnet, 2025, OGL v3.0 Contains OS data © Crown copyright and database right, 2025
- a
BromleyMapOriginal
- dgah-210-carleton.hub.arcgis.com
Updated Mar 10, 2024ShareFacebookTwitterEmailClick to copy linkLink copiedCiteCarleton College (2024). BromleyMapOriginal [Dataset]. https://dgah-210-carleton.hub.arcgis.com/maps/c6109dfeb5c14ae3a9c84a3d500ad81dDataset updatedMar 10, 2024Dataset authored and provided byCarleton CollegeArea coveredDescriptionLondon City Council Bomb Damage Map - A georeferenced image of the London City Council's Bomb Damage Map of Bromley. These maps are hand-colored maps created within the Architects Department of the LLC. Their function was to record the damage to buildings in London caused by air raids and V-weapons during the Blitz and World War II. (Citation: Ward, Laurence. The London City Council Bomb Damage Maps, 1939 - 1945. London, Thames & Hudson, 2016.)
London Borough Profiles and Atlas
- data.europa.eu
- data.wu.ac.at
csv, unknown, zipUpdated Nov 1, 2021+ more versionsShareFacebookTwitterEmailClick to copy linkLink copiedCiteGreater London Authority (2021). London Borough Profiles and Atlas [Dataset]. https://data.europa.eu/data/datasets/london-borough-profiles-1?locale=skunknown, csv, zipAvailable download formatsDataset updatedNov 1, 2021Area coveredLondonDescriptionThe London Borough Profiles help paint a general picture of an area by presenting a range of headline indicator data in both spreadsheet and map form to help show statistics covering demographic, economic, social and environmental datasets for each borough, alongside relevant comparator areas. The London Borough Atlas does the same but provides further detailed breakdowns and time-series data for each borough. The full datasets and more information for each of the indicators are usually available on the London Datastore. A link to each of the datasets is contained in the spreadsheet and map.
London Borough Profiles
On opening the Microsoft Excel version, a simple drop down box allows you to choose which borough profile you are interested in. Selecting this will display data for that borough, plus either Inner or Outer London, London and a national comparator (usually England where data is available). To see the full set of data for all 33 local authorities in London plus the comparator areas in Excel, click the 'Data' worksheet. A chart and a map are also available to help visualise the data for all boroughs (macros must be enabled for the Excel map to function). The data is set out across 11 themes covering most of the key indicators relating to demographic, economic, social and environmental data. Sources are provided in the spreadsheet. Notes about the indicator are provided in comment boxes attached to the indicator names. For a geographical and bar chart representation of the profile data, choose the InstantAtlas version. Choose indicators from the left hand side. Click on the comparators to make them appear on the chart and map. Sources, links to data, and notes are all contained in the box in the bottom right hand corner.


These profiles include data relating to: Population, Households (census), Demographics, Migrant population, Ethnicity, Language, Employment, NEET, DWP Benefits (client group), Housing Benefit, Qualifications, Earnings, Volunteering, Jobs density, Business Survival, Crime, Fires, House prices, New homes, Tenure, Greenspace, Recycling, Carbon Emissions, Cars, Public Transport Accessibility (PTAL), Indices of Multiple Deprivation, GCSE results, Children looked after, Children in out-of-work families, Life Expectancy, Teenage conceptions, Happiness levels, Political control, and Election turnout.
London Borough Atlas
To access even more data at local authority level, use the London Borough Atlas. It contains data about the same topics as the profiles but provides further detailed breakdowns and time-series data for each borough. There is also an InstantAtlas version available.
The London boroughs are: City of London, Barking and Dagenham, Barnet, Bexley, Brent, Bromley, Camden, Croydon, Ealing, Enfield, Greenwich, Hackney, Hammersmith and Fulham, Haringey, Harrow, Havering, Hillingdon, Hounslow, Islington, Kensington and Chelsea, Kingston upon Thames, Lambeth, Lewisham, Merton, Newham, Redbridge, Richmond upon Thames, Southwark, Sutton, Tower Hamlets, Waltham Forest, Wandsworth, Westminster. You may also find our small area profiles useful - Ward, LSOA, and "/dataset/msoa-atlas">MS
V1 and V2 impact sites in London
- zenodo.org
htmlUpdated Feb 17, 2025ShareFacebookTwitterEmailClick to copy linkLink copiedCiteLiam Shaw; Liam Shaw (2025). V1 and V2 impact sites in London [Dataset]. http://doi.org/10.5281/zenodo.14882793htmlAvailable download formatsUnique identifierhttps://doi.org/10.5281/zenodo.14882793Dataset updatedFeb 17, 2025AuthorsLiam Shaw; Liam ShawLicenseAttribution 4.0 (CC BY 4.0)https://creativecommons.org/licenses/by/4.0/
License information was derived automaticallyArea coveredLondonDescriptionThe V1 ('flying bomb' or 'doodlebug') and V2 (a ballistic missile) were two new weapons developed by Nazi Germany. In 1944 and 1945 thousands were fired at London. They killed thousands of people and injured many more.
This dataset includes all impact sites for V1s and V2s within the London County Council boundary. These were manually compiled from bomb maps published in 'The London County Council Bomb Damage Maps 1939-1945' by Laurence Ward (Thames and Hudson, 2015). The original LCC Bomb Damage maps are held at the London Archives.
**Please note that this is not a comprehensive dataset of all V1s and V2s. Only those within the London County Council boundary are included.**
File Explanation bomb_map.kml Map layer downloaded from Google Maps in Keyhole Markup Language (KML) formatdata-conversion.R Script used to convert the KML file to tables of impacts. V1-impacts.csv Locations of V1 impact sites with page number (in Ward 2015), longitude, latitude, easting, northing. V2-impacts.csv Locations of V2 impact sites with page number (in Ward 2015), longitude, latitude, easting, northing. flying-bomb-supplementary-analysis.html Supplementary analysis code, archived from https://lukefshaw.netlify.app/the-flying-bomb-and-the-actuary-supplementary-analysis/ The impact sites can also be viewed as a layer on Google Maps. Data is separated into two layers: V1 sites and V2 sites. Each point represents an impact site, with the closest street name (to help with possible cross-reference) and page number in the LCC Bomb Damage Maps: https://www.google.com/maps/d/viewer?mid=1VwyxV_e_LAwzbyJPCAF-C7aCRVNA5W7N&ll=51.509018493447314%2C-0.05324588962980492&z=14
We previously analysed this dataset in 'The flying bomb and the actuary', Significance (2019). doi: 10.1111/j.1740-9713.2019.01315.x
Our analysis, all coded using R, is available at https://lukefshaw.netlify.app/the-flying-bomb-and-the-actuary-supplementary-analysis/The rectangular bounding box used to recreate the famous analysis of Clarke (1946) is, using British National Grid (BNG) easting/northing coordinates:xmin = 525000
xmax = 543000
ymin = 172000
ymax = 180000- a
Kensignton2MapWAdditions
- dgah-210-carleton.hub.arcgis.com
Updated Mar 7, 2024ShareFacebookTwitterEmailClick to copy linkLink copiedCiteCarleton College (2024). Kensignton2MapWAdditions [Dataset]. https://dgah-210-carleton.hub.arcgis.com/datasets/kensignton2mapwadditionsDataset updatedMar 7, 2024Dataset authored and provided byCarleton CollegeDescriptionLondon City Council Bomb Damage Map - A georeferenced image of the London City Council's Bomb Damage Map of Kensington. These maps are hand-colored maps created within the Architects Department of the LLC. Their function was to record the damage to buildings in London caused by air raids and V-weapons during the Blitz and World War II. The features on this map were hand digitized by importing new polygon and point layers. (Citation: Ward, Laurence. The London City Council Bomb Damage Maps, 1939 - 1945. London, Thames & Hudson, 2016.)
- w
Opportunity Areas
- data.wu.ac.at
- data.europa.eu
html, wmsUpdated Feb 10, 2016ShareFacebookTwitterEmailClick to copy linkLink copiedCiteSouthwark London Borough Council (2016). Opportunity Areas [Dataset]. https://data.wu.ac.at/schema/data_gov_uk/NjNlZTMzMTYtYjIyYS00ZWRmLTgyMzEtNjY4ZGU5Y2IxZGZmhtml, wmsAvailable download formatsDataset updatedFeb 10, 2016Dataset provided bySouthwark London Borough CouncilArea coveredd6ea1de7c9e541699e5fc63eb55ab1c79751fdecDescriptionOpportunity areas or zones mapped as part of the Authority’s Local Development Framework
Local Authority Districts, Counties and Unitary Authorities (April 2021) Map...
- geoportal.statistics.gov.uk
- hub.arcgis.com
Updated Oct 8, 2021ShareFacebookTwitterEmailClick to copy linkLink copiedCiteOffice for National Statistics (2021). Local Authority Districts, Counties and Unitary Authorities (April 2021) Map in the UK [Dataset]. https://geoportal.statistics.gov.uk/documents/66b816fda5cd44e5a4ff5c38dcfa2777Dataset updatedOct 8, 2021Licensehttps://www.ons.gov.uk/methodology/geography/licenceshttps://www.ons.gov.uk/methodology/geography/licences
Area coveredDescriptionA PDF map that shows the local authority districts, counties and unitary authorities in the United Kingdom as at April 2021. The map has been created to show the United Kingdom from country level down to local authority district level. (File Size - 1,969 KB)
- d
Natural Capital County Atlas Mapping (England)
- environment.data.gov.uk
- data.europa.eu
zipUpdated Oct 14, 2020+ more versionsShareFacebookTwitterEmailClick to copy linkLink copiedCiteNatural England (2020). Natural Capital County Atlas Mapping (England) [Dataset]. https://environment.data.gov.uk/dataset/347c87af-15fb-4775-b893-336ac10b34d7zipAvailable download formatsDataset updatedOct 14, 2020LicenseOpen Government Licence 3.0http://www.nationalarchives.gov.uk/doc/open-government-licence/version/3/
License information was derived automaticallyDescriptionThis spatial dataset is an output of the Natural England County & City Natural Capital Atlas project (July 2020). It shows variation in ecosystem service flow for habitats across England, based on indicators identified by NE in the 2018 Natural Capital Indicators project. The dataset comprises a hexagonal grid which summarises indicator values across the country (each unit = 5km²).
Natural Capital is an important aspect of current environmental policy and management. This dataset, in combination with the other project outputs, will support understanding of Natural Capital in England and serve as a valuable engagement tool to communicate concepts of the Natural Capital approach to a wide variety of stakeholders.
For full methodology and user guide see documents ‘NCAtlas_Devon’ and ‘NC-Mapping-User-Guidance’ at http://publications.naturalengland.org.uk/publication/6672365834731520.
For full metadata documentation see the data package download below.
Copyright statement: LCM2015 © NERC (CEH) 2011. Contains Ordnance Survey data © Crown Copyright 2007. © Defra. Contains Defra information © Defra - Project MB0102. © Environment Agency. © Forestry Commission. © Historic England [year]. © Joint Nature Conservation Committee. © Natural England copyright. Contains Ordnance Survey data © Crown copyright and database right [year]. Contains data supplied by © NERC - Centre for Ecology & Hydrology. © Natural England copyright. Natural England Licence No. 2011/052 British Geological Survey © NERC, all rights reserved, © NSRI Cranfield University. Contains National Statistics data © Crown copyright and database right [year]. Contains Ordnance Survey data © Crown copyright and database right [year]. Contains Rural Payments Agency. © Barnsley Metropolitan Borough Council. © Bath & North East Somerset Council. © Bedford Borough Council. © London Borough of Bexley. © Birmingham City Council. © Blackburn with Darwen Borough Council. © Blackpool Council. © Bolton Council. © BCP Council. © Bracknell Forest Council. © City of Bradford Metropolitan District Council. © Brighton & Hove City Council. © Bristol City Council. © London Borough of Bromley. © Buckinghamshire County Council. © Bury Council. © Calderdale Council. © Cambridgeshire County Council. © Central Bedfordshire Council. © Cheshire East Council. © Cheshire West and Chester Council. © Cornwall Council. © Cumbria County Council. © Derbyshire County Council. © Devon County Council. © Doncaster Council. © Dorset Council. © Dudley Metropolitan Borough Council. © Durham County Council. © East Riding of Yorkshire Council. © East Sussex County Council. © Essex County Council. © Gateshead Council. © Gloucestershire County Council. © Hampshire County Council. © Herefordshire Council. © Hertfordshire County Council. © Hull City Council. © Isle of Anglesey County Council. © Isle of Wight Council. © Kent County Council. © Kirklees Council. © Knowsley Metropolitan Borough Council. © Lake District National Park. © Lancashire County Council. © Leicester City Council. © Leicestershire County Council. © Lincolnshire County Council. © Manchester City Council. © Medway Council. © Norfolk County Council. © North Lincolnshire Council. © North Somerset Council. © North Yorkshire County Council. © Northamptonshire County Council. © Northumberland County Council. © Nottingham City Council. © Nottinghamshire County Council. © Oldham Council. © Oxfordshire County Council. © Peterborough City Council. © Plymouth City Council. © Bournemouth, Christchurch and Poole Council. © Portsmouth City Council. © Reading Borough Council. © Redcar and Cleveland Borough Council. © Rochdale Borough Council. © Rotherham Metropolitan Borough Council. © Rutland County Council. © Salford City Council. © Sefton Council. © Sheffield City Council. © Shropshire Council. © Slough Borough Council. © Somerset County Council. © South Gloucestershire Council. © Southampton City Council. © St Helens Council. © Staffordshire County Council. © Stockport Metropolitan Borough Council. © Stockton Council. © Suffolk County Council. © Surrey County Council. © Tameside Metropolitan Borough Council. © Thurrock Council. © Torbay Council. © Trafford Council. © Wakefield Council. © Walsall Council. © Warrington Borough Council. © Warwickshire County Council. © West Berkshire Council. © West Sussex County Council. © Wigan Council. © Wiltshire Council. © Royal Borough of Windsor and Maidenhead Council. © Wirral Council. © Wokingham Borough Council. © Worcestershire County Council. © City of York Council.
Map data LBRUT - Dataset - data.gov.uk
- ckan.publishing.service.gov.uk
Updated Feb 27, 2017ShareFacebookTwitterEmailClick to copy linkLink copiedCiteckan.publishing.service.gov.uk (2017). Map data LBRUT - Dataset - data.gov.uk [Dataset]. https://ckan.publishing.service.gov.uk/dataset/map-data-lbrutDataset updatedFeb 27, 2017LicenseOpen Government Licence 3.0http://www.nationalarchives.gov.uk/doc/open-government-licence/version/3/
License information was derived automaticallyArea coveredLondon Borough of Richmond upon ThamesDescriptionThis service provides access toa wide range of map data provided by teh London Borough of Richmond upon Thames. It includes 1) The Local Plan which sets out the priorities for the development of the borough of LBRUT and will be used for making decisions on planning applications. It consists of a number of planning documents and guidance. 2) Community Infrastructure Levy zones - banded areas for this levy. 3) Schools - a copy of the DofEducation data within LBRUT 4) Conservation Areas
- a
Data from: Borough Boundaries
- hub.arcgis.com
Updated Sep 8, 2021ShareFacebookTwitterEmailClick to copy linkLink copiedCiteGREATER LONDON AUTHORITY (2021). Borough Boundaries [Dataset]. https://hub.arcgis.com/datasets/a8dd7c4326944047a87e67cbd9b5e470Dataset updatedSep 8, 2021Dataset authored and provided byGREATER LONDON AUTHORITYArea coveredDescriptionBoundaries of the 32 London Boroughs and the City of London Corporation.
Country - OS Boundary-Line
- livingatlas-dcdev.opendata.arcgis.com
Updated Nov 26, 2021ShareFacebookTwitterEmailClick to copy linkLink copiedCiteEsri UK (2021). Country - OS Boundary-Line [Dataset]. https://livingatlas-dcdev.opendata.arcgis.com/maps/esriukcontent::country-os-boundary-lineDataset updatedNov 26, 2021AuthorsEsri UKArea coveredDescriptionThis dataset is from the Ordnance Survey and it provides a representation of the hierarchy of administrative and electoral boundaries for GB (England, Scotland and Wales). The product is part of the new OS Open products suite and is designed to be used with other OpenData sets.The dataset is made up of 18 layers which are grouped in their respective categories. It contains all levels of electoral and administrative boundaries, from district, wards, civil parishes (or communities) up to parliamentary and assembly constituencies. The layers can be grouped as followed:Administrative Boundaries• Mean high water (GB)• Country (GB)• Historic European regions (GB)• Historic counties (GB)• Ceremonial counties (GB)• District, Metropolitan district, Unitary authority (GB)• Civil parish and community (GB)• Ward (district, unitary, metropolitan, London borough) (England, Scotland)• English region (England)• County (England)• Community (Wales)Electoral Boundaries• Westminster constituencies (GB)• Scottish and Welsh constituency• Scottish and Welsh electoral region• Polling districts (England)• County electoral division (England)• Unitary electoral division (England and Wales)• Greater London Authority Assembly constituenciesThe currency of this data is 04/2022 and the coverage of this service is GB.The map projection is British National Grid.
Regions and their constituent Counties and Unitary Authorities (April 2011)...
- cloud.csiss.gmu.edu
- data.europa.eu
- +1more
htmlUpdated Dec 24, 2019+ more versionsShareFacebookTwitterEmailClick to copy linkLink copiedCiteOffice for National Statistics (2019). Regions and their constituent Counties and Unitary Authorities (April 2011) Map in the United Kingdom [Dataset]. https://cloud.csiss.gmu.edu/uddi/dataset/regions-and-their-constituent-counties-and-unitary-authorities-april-2011-map-in-the-united-kinhtmlAvailable download formatsDataset updatedDec 24, 2019Licensehttp://reference.data.gov.uk/id/open-government-licencehttp://reference.data.gov.uk/id/open-government-licence
Area coveredUnited KingdomDescriptionA PDF map shows the Regions and their constituent counties, metropolitan counties, Greater London authority and unitary authorities in England, council areas in Scotland, unitary authorities in Wales and district council areas in Northern Ireland as at April 2011. (File Size - 638 KB).
- W
Borough Council Election Results 2010
- cloud.csiss.gmu.edu
- data.europa.eu
csv, pdf, xlsUpdated Jul 4, 2014ShareFacebookTwitterEmailClick to copy linkLink copiedCiteGreater London Authority (GLA) (2014). Borough Council Election Results 2010 [Dataset]. https://cloud.csiss.gmu.edu/uddi/dataset/borough-council-election-results-2010xls, csv, pdfAvailable download formatsDataset updatedJul 4, 2014Dataset provided byGreater London Authority (GLA)LicenseAttribution 4.0 (CC BY 4.0)https://creativecommons.org/licenses/by/4.0/
License information was derived automaticallyDescriptionLondon Borough Council Elections - 6 May 2010
https://s3-eu-west-1.amazonaws.com/londondatastore-upload/boro-elections-2010-cover.png" alt="REPORT">
With the aim of making the democratic process as transparent as possible to the London electorate, this report includes a great deal of detail on every aspect of the 2010 London Borough council general elections. No other single volume presents the full results and election statistics from the 32 London boroughs enabling the reader to analyse and compare the results across London in one place.
The report presents data for every candidate in every ward (excluding the City of London which operates on a different electoral model). Summaries are provided in the form of maps and tables, and to make comparisons easier, they mostly match those included in the 2006 report with a few useful additions.
Results of all council by-elections between the general elections in 2006 and 2010, as well as details of the elections in the three boroughs that directly elect a mayor, are also presented here. This is the latest report in a long series of council election reports dating back to 1964. Find other election reports at http://data.london.gov.uk/elections/
REPORT:
The report is available in PDF format.
Hard copies are available from the Intelligence Unit for £20. Please contact intelligence@london.gov.uk or tel 020 7983 4922 (credit card or cheque accepted).
https://s3-eu-west-1.amazonaws.com/londondatastore-upload/lbce-excel-thumb.png" alt="DATA">
DATA:
All the data contained within the 'London Borough Council Elections 2010' report can be accessed in this spreadsheet. This contains results for each candidate standing in all 624 wards in the London boroughs (excluding the City of London which operates on a different electoral model).
Also available in the following spreadsheets:
● Full results for every ward and every candidate from 2006 and 2010
● A summary of the number of seats won by each party by borough including political control.
● Ward and borough turnout data.
MOTION CHART:
https://s3-eu-west-1.amazonaws.com/londondatastore-upload/elections-motion-thumb.png" alt="CHART">
This motion chart shows the relationship, between share of votes and seats won by the major parties in elections since 1964 at borough level (requires Adobe Flash Player).
MAP:
 )
)These interactive ward maps help to geographically present election results from 2006 and 2010 and display results for each candidate (requires Adobe Flash Player).
Data for the elections in the three boroughs that directly elect a mayor (Newham, Lewisham and Hackney) are not included in the map but are included in the Excel spreadsheet of results.
FacebookTwitterLondon Boroughs (December 2017) Map in London
https://www.ons.gov.uk/methodology/geography/licenceshttps://www.ons.gov.uk/methodology/geography/licences
A PDF map of the London boroughs as at December 2017. The map shows the London boroughs split into inner London and outer London. (File Size - 227 KB).