V1 and V2 impact sites in London
- zenodo.org
bin, csvUpdated Feb 17, 2025 Share
Share Facebook
 Twitter
 EmailClick to copy linkLink copiedCiteLiam Shaw; Liam Shaw (2025). V1 and V2 impact sites in London [Dataset]. http://doi.org/10.5281/zenodo.14882696csv, binAvailable download formatsUnique identifierhttps://doi.org/10.5281/zenodo.14882696Dataset updatedFeb 17, 2025AuthorsLiam Shaw; Liam ShawLicense
Attribution 4.0 (CC BY 4.0)https://creativecommons.org/licenses/by/4.0/
License information was derived automaticallyArea coveredLondonDescriptionThe V1 ('flying bomb' or 'doodlebug') and V2 (a ballistic missile) were two new weapons developed by Nazi Germany. In 1944 and 1945 thousands were fired at London. They killed thousands of people and injured many more.
This dataset includes all impact sites for V1s and V2s within the London County Council boundary. These were manually compiled from bomb maps published in 'The London County Council Bomb Damage Maps 1939-1945' by Laurence Ward (Thames and Hudson, 2015). The original LCC Bomb Damage maps are held at the London Archives.
**Please note that this is not a comprehensive dataset of all V1s and V2s. Only those within the London County Council boundary are included.**
File Explanation bomb_map.kml Map layer downloaded from Google Maps in Keyhole Markup Language (KML) formatdata-conversion.R Script used to convert the KML file to tables of impacts. V1-impacts.csv Locations of V1 impact sites with page number (in Ward 2015), longitude, latitude, easting, northing. V2-impacts.csv Locations of V2 impact sites with page number (in Ward 2015), longitude, latitude, easting, northing. We previously analysed this dataset in 'The flying bomb and the actuary', Significance (2019). doi: 10.1111/j.1740-9713.2019.01315.x
The impact sites can also be viewed as a layer on Google Maps. Data is separated into two layers: V1 sites and V2 sites. Each point represents an impact site, with the closest street name (to help with possible cross-reference) and page number in the LCC Bomb Damage Maps: https://www.google.com/maps/d/viewer?mid=1VwyxV_e_LAwzbyJPCAF-C7aCRVNA5W7N&ll=51.509018493447314%2C-0.05324588962980492&z=14
- d
Natural Capital County Atlas Mapping (England)
- environment.data.gov.uk
- data.europa.eu
zipUpdated Oct 14, 2020+ more versionsShareFacebookTwitterEmailClick to copy linkLink copiedCiteNatural England (2020). Natural Capital County Atlas Mapping (England) [Dataset]. https://environment.data.gov.uk/dataset/347c87af-15fb-4775-b893-336ac10b34d7zipAvailable download formatsDataset updatedOct 14, 2020LicenseOpen Government Licence 3.0http://www.nationalarchives.gov.uk/doc/open-government-licence/version/3/
License information was derived automaticallyDescriptionThis spatial dataset is an output of the Natural England County & City Natural Capital Atlas project (July 2020). It shows variation in ecosystem service flow for habitats across England, based on indicators identified by NE in the 2018 Natural Capital Indicators project. The dataset comprises a hexagonal grid which summarises indicator values across the country (each unit = 5km²).
Natural Capital is an important aspect of current environmental policy and management. This dataset, in combination with the other project outputs, will support understanding of Natural Capital in England and serve as a valuable engagement tool to communicate concepts of the Natural Capital approach to a wide variety of stakeholders.
For full methodology and user guide see documents ‘NCAtlas_Devon’ and ‘NC-Mapping-User-Guidance’ at http://publications.naturalengland.org.uk/publication/6672365834731520.
For full metadata documentation see the data package download below.
Copyright statement: LCM2015 © NERC (CEH) 2011. Contains Ordnance Survey data © Crown Copyright 2007. © Defra. Contains Defra information © Defra - Project MB0102. © Environment Agency. © Forestry Commission. © Historic England [year]. © Joint Nature Conservation Committee. © Natural England copyright. Contains Ordnance Survey data © Crown copyright and database right [year]. Contains data supplied by © NERC - Centre for Ecology & Hydrology. © Natural England copyright. Natural England Licence No. 2011/052 British Geological Survey © NERC, all rights reserved, © NSRI Cranfield University. Contains National Statistics data © Crown copyright and database right [year]. Contains Ordnance Survey data © Crown copyright and database right [year]. Contains Rural Payments Agency. © Barnsley Metropolitan Borough Council. © Bath & North East Somerset Council. © Bedford Borough Council. © London Borough of Bexley. © Birmingham City Council. © Blackburn with Darwen Borough Council. © Blackpool Council. © Bolton Council. © BCP Council. © Bracknell Forest Council. © City of Bradford Metropolitan District Council. © Brighton & Hove City Council. © Bristol City Council. © London Borough of Bromley. © Buckinghamshire County Council. © Bury Council. © Calderdale Council. © Cambridgeshire County Council. © Central Bedfordshire Council. © Cheshire East Council. © Cheshire West and Chester Council. © Cornwall Council. © Cumbria County Council. © Derbyshire County Council. © Devon County Council. © Doncaster Council. © Dorset Council. © Dudley Metropolitan Borough Council. © Durham County Council. © East Riding of Yorkshire Council. © East Sussex County Council. © Essex County Council. © Gateshead Council. © Gloucestershire County Council. © Hampshire County Council. © Herefordshire Council. © Hertfordshire County Council. © Hull City Council. © Isle of Anglesey County Council. © Isle of Wight Council. © Kent County Council. © Kirklees Council. © Knowsley Metropolitan Borough Council. © Lake District National Park. © Lancashire County Council. © Leicester City Council. © Leicestershire County Council. © Lincolnshire County Council. © Manchester City Council. © Medway Council. © Norfolk County Council. © North Lincolnshire Council. © North Somerset Council. © North Yorkshire County Council. © Northamptonshire County Council. © Northumberland County Council. © Nottingham City Council. © Nottinghamshire County Council. © Oldham Council. © Oxfordshire County Council. © Peterborough City Council. © Plymouth City Council. © Bournemouth, Christchurch and Poole Council. © Portsmouth City Council. © Reading Borough Council. © Redcar and Cleveland Borough Council. © Rochdale Borough Council. © Rotherham Metropolitan Borough Council. © Rutland County Council. © Salford City Council. © Sefton Council. © Sheffield City Council. © Shropshire Council. © Slough Borough Council. © Somerset County Council. © South Gloucestershire Council. © Southampton City Council. © St Helens Council. © Staffordshire County Council. © Stockport Metropolitan Borough Council. © Stockton Council. © Suffolk County Council. © Surrey County Council. © Tameside Metropolitan Borough Council. © Thurrock Council. © Torbay Council. © Trafford Council. © Wakefield Council. © Walsall Council. © Warrington Borough Council. © Warwickshire County Council. © West Berkshire Council. © West Sussex County Council. © Wigan Council. © Wiltshire Council. © Royal Borough of Windsor and Maidenhead Council. © Wirral Council. © Wokingham Borough Council. © Worcestershire County Council. © City of York Council.
- U
2011 Census Geography boundaries (Local Authorities)
- statistics.ukdataservice.ac.uk
zipUpdated Sep 20, 2022ShareFacebookTwitterEmailClick to copy linkLink copiedCiteBoundary (2022). 2011 Census Geography boundaries (Local Authorities) [Dataset]. https://statistics.ukdataservice.ac.uk/dataset/2011-census-geography-boundaries-local-authoritieszipAvailable download formatsDataset updatedSep 20, 2022Dataset authored and provided byBoundaryLicenseOpen Government Licence 3.0http://www.nationalarchives.gov.uk/doc/open-government-licence/version/3/
License information was derived automaticallyDescriptionLocal Authority is a generic term used to cover London Boroughs, Metropolitan Districts, Non-Metropolitan Districts, and Unitary Authorities in England; Unitary Authorities in Wales; Council Areas in Scotland; and Local Government Districts in Northern Ireland.
The Local Authorities area list contains 404 areas of the following constituent geographies:
- 36 Metropolitan Districts in England
- 201 Non-Metropolitan Districts in England
- 31 London Boroughs in England
- 54 Unitary Authorities in England
- 26 Local Government Districts in Northern Ireland
- 32 Council Areas in Scotland
- 22 Unitary Authorities in Wales
- 2 Census Merged Districts in England
Please visit ONS Beginner's Guide to UK Geography for more info.
The boundaries are available as either extent of the realm (usually this is the Mean Low Water mark but in some cases boundaries extend beyond this to include off shore islands) or
clipped to the coastline (Mean High Water mark).
- g
Regions and their constituent Counties and Unitary Authorities (April 2011)...
- gimi9.com
Updated Apr 15, 2011+ more versionsShareFacebookTwitterEmailClick to copy linkLink copiedCite(2011). Regions and their constituent Counties and Unitary Authorities (April 2011) Map in the United Kingdom | gimi9.com [Dataset]. https://gimi9.com/dataset/uk_regions-and-their-constituent-counties-and-unitary-authorities-april-2011-map-in-the-united-kin3/Dataset updatedApr 15, 2011LicenseOpen Government Licence 3.0http://www.nationalarchives.gov.uk/doc/open-government-licence/version/3/
License information was derived automaticallyArea coveredUnited KingdomDescriptionA PDF map shows the Regions and their constituent counties, metropolitan counties, Greater London authority and unitary authorities in England, council areas in Scotland, unitary authorities in Wales and district council areas in Northern Ireland as at April 2011. (File Size - 638 KB).
EOCIS: Geospatial Information Files V1.1
- catalogue.ceda.ac.uk
Updated Aug 8, 2025ShareFacebookTwitterEmailClick to copy linkLink copiedCiteBenjamin Lloyd-Hughes; Guy Griffiths; Mathieu Roesch (2025). EOCIS: Geospatial Information Files V1.1 [Dataset]. https://catalogue.ceda.ac.uk/uuid/b766867ceadb409da64d480bdbe4057dDataset updatedAug 8, 2025AuthorsBenjamin Lloyd-Hughes; Guy Griffiths; Mathieu RoeschLicenseAttribution 4.0 (CC BY 4.0)https://creativecommons.org/licenses/by/4.0/
License information was derived automaticallyTime period coveredJan 1, 1997 - Dec 31, 2023Area coveredVariables measuredlatitude, longitude, land_cover, area_fraction, land_cover_lccs, projection_x_coordinate, projection_y_coordinateDataset funded byNERCDescriptionThis dataset contains categorical geographical information data files for the UK to enable the effective translation of climate data into new forms of actionable information.
These datasets have been created as part of the Earth Observation Climate Information Service (EOCIS) project, following the specific format and nature of the EOCIS Climate information at Hi-res for the UK (CHUK) grid, as specified by NCEO.
The information files cover the following attributes: * land and permanent water * tags for the devolved nation of the UK (also Eire, France, etc) * tags for the county / council / unitary authority / metropolitan or London borough * tags for the parish / community / town council * tags for the UK postcode sector * tags for appropriate administrative boundaries relating to the National Health Service * tags for appropriate administrative boundaries relating to the Fire Service * land classification * built and paved area fractions * presence of roads, railway tracks and transmission network * socioeconomic data of population, income, and educational attainment
- M
Metropolitan Council Districts Current
- gisdata.mn.gov
ags_mapserver, fgdb +4Updated Oct 23, 2025ShareFacebookTwitterEmailClick to copy linkLink copiedCiteMetropolitan Council (2025). Metropolitan Council Districts Current [Dataset]. https://gisdata.mn.gov/dataset/us-mn-state-metc-bdry-mcdistricts-currentshp, jpeg, gpkg, html, ags_mapserver, fgdbAvailable download formatsDataset updatedOct 23, 2025Dataset provided byMetropolitan CouncilDescriptionThis layer defines the district boundaries for the Metropolitan Council members.
NOTES:
- The Metropolitan Council Districts were enacted on May 19, 2023, using plan MC2023-2.
- Council member names and spellings are taken directly from the Metropolitan Council web site and press releases.
- Hanover, New Prague, Northfield, and Rockford have been removed from the district boundaries.
- Cities of Minneapolis, St. Paul, Edina, Maplewood and Woodbury have populations split into more than one Council District.
- The actual descriptions of Metropolitan Council District boundaries were taken from Minnesota Statutes 2022, 473.123 http://www.revisor.leg.state.mn.us/stats/473/123.html
- The 2023 plan files, details and components passed by the 2023 MN Legislature can be found at https://www.gis.lcc.mn.gov/redist2020/MetCouncil/mc2023_2/.
- For the map and data available from the Metropolitan Council, district boundaries were adjusted to conform to existing geography employed by the Metropolitan Council.
- Adjustments for district boundaries that fall on city/township boundaries are updated on a quarterly basis with data from counties.
- Met Council Districts are defined every 10 years. - e
Borough Council Election Results 2014
- data.europa.eu
excel xls, pdfUpdated Dec 1, 2014+ more versionsShareFacebookTwitterEmailClick to copy linkLink copiedCiteGreater London Authority (2014). Borough Council Election Results 2014 [Dataset]. https://data.europa.eu/data/datasets/borough-council-election-results-2014excel xls, pdfAvailable download formatsDataset updatedDec 1, 2014Dataset authored and provided byGreater London AuthorityDescription
This report includes a great deal of detail on every aspect of the 2014 London Borough council general elections. No other single volume presents the full results and election statistics from the 32 London boroughs enabling the reader to analyse and compare the results across London in one place. The report presents data for every candidate in every ward (excluding the City of London which operates on a different electoral model). The report also contains analysis of the European election results for London that took place on the same day.
Printed Copies We are able to accept orders for hard copies £30. Click here for further details.
Details of all previous elections reports in the series can be found here.
Summary results of the 2014 local elections in London, showing number and percentage of seats won, turnout and political control.
Final 2014 ward results
These results show the number of votes for each candidate in each ward in London. Turnout, number of ballots, postal votes, and breakdown of rejected votes, Mayoral and European voting figures are also included where available.
Map showing political control in each ward.
https://londondatastore-upload.s3.amazonaws.com/images/London-ward-map-borough-election-2014-new-colours-small.png" alt="">
Also, using these ward results, Oliver O'Brien from CASA has created some eye catching interactive ward maps.
The borough map shows the summary results in both the 2010 and 2014 elections.
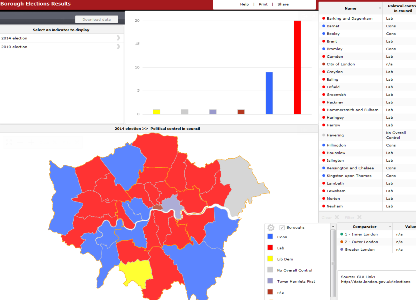
The ward interactive map shows the detailed results for each candidate at ward level for the last three elections between 2006 and 2014.

This motion chart shows the relationship, between share of votes and seats won by the major parties in elections since 1964 at borough level (requires Adobe Flash Player).
 )
) Regions and their constituent Counties and Unitary Authorities (April 2011)...
- ckan.publishing.service.gov.uk
Updated Jun 12, 2017+ more versionsShareFacebookTwitterEmailClick to copy linkLink copiedCiteckan.publishing.service.gov.uk (2017). Regions and their constituent Counties and Unitary Authorities (April 2011) Map in the United Kingdom - Dataset - data.gov.uk [Dataset]. https://ckan.publishing.service.gov.uk/dataset/regions-and-their-constituent-counties-and-unitary-authorities-april-2011-map-in-the-united-kin3Dataset updatedJun 12, 2017LicenseOpen Government Licence 3.0http://www.nationalarchives.gov.uk/doc/open-government-licence/version/3/
License information was derived automaticallyArea coveredUnited KingdomDescriptionA PDF map shows the Regions and their constituent counties, metropolitan counties, Greater London authority and unitary authorities in England, council areas in Scotland, unitary authorities in Wales and district council areas in Northern Ireland as at April 2011. (File Size - 638 KB).
- E
Data from: Great Britain counties and unitary authories 2012
- find.data.gov.scot
- dtechtive.com
xml, zipUpdated Feb 21, 2017+ more versionsShareFacebookTwitterEmailClick to copy linkLink copiedCiteEDINA (2017). Great Britain counties and unitary authories 2012 [Dataset]. http://doi.org/10.7488/ds/1881xml(0.0037 MB), zip(15.22 MB)Available download formatsUnique identifierhttps://doi.org/10.7488/ds/1881Dataset updatedFeb 21, 2017Dataset provided byEDINALicenseAttribution 4.0 (CC BY 4.0)https://creativecommons.org/licenses/by/4.0/
License information was derived automaticallyArea coveredUnited KingdomDescriptionThis data shows the counties and unitary authorities of Great Britain for 2012. The attached Layer File can be used to symbolise the different types of boundaries (Non-Metropolitan Counties/Metropolitan Counties/Unitary Authorities/Council Areas/Greater London). A JPEG image of the map is also contained in the download. This dataset was made from the OS OpenData Boundary Line product: http://www.ordnancesurvey.co.uk/oswebsite/products/boundary-line/index.html. GIS vector data. This dataset was first accessioned in the EDINA ShareGeo Open repository on 2012-05-10 and migrated to Edinburgh DataShare on 2017-02-21.
Ward Maps
- ckan.publishing.service.gov.uk
- data.europa.eu
Updated Nov 30, 2022+ more versionsShareFacebookTwitterEmailClick to copy linkLink copiedCiteckan.publishing.service.gov.uk (2022). Ward Maps [Dataset]. https://ckan.publishing.service.gov.uk/dataset/ward-mapsDataset updatedNov 30, 2022DescriptionThe London Borough of Barnet is divided into 24 electoral Wards. The current warding arrangement came into effect on 5th May 2022. These maps have been created as general resource for the council. The information is sourced from Ordnance Survey Open Data products and may be used more widely subject to the Open Government Licence (v3). Each ward map is available in 2 different sizes, in pdf format and includes an approximate scale and information currency. Ward boundary information is from OS Boundary-Line™ (normally released in May and October) The A3 base map information is from OS OpenMap - Local (normally released in April and October) The A4 base map information is from OS VectorMap District (normally released in May and November) Only the latest version of the maps are published and older versions are not retained. Please note: these maps may not reflect the latest information published by Ordnance Survey, see document dates for date last updated. Data and Resources BarnetWardMaps-A3-OpenMapLocal.zip Zip file of all 24 Barnet Ward maps A3 based on OS OpenMap-Local
Population of England 2024, by county
- statista.com
Updated Nov 28, 2025ShareFacebookTwitterEmailClick to copy linkLink copiedCiteStatista (2025). Population of England 2024, by county [Dataset]. https://www.statista.com/statistics/971694/county-population-england/Dataset updatedNov 28, 2025Time period covered2024Area coveredEnglandDescriptionIn 2024, over nine million people lived in Greater London, making it the most populated ceremonial county in England. The West Midlands Metropolitan County, which contains the large city of Birmingham, was the second-largest county at just over 3.03 million, closely followed by Greater Manchester at three million, and then West Yorkshire with a population of 2.4 million. Kent, Essex, and Hampshire were the three next-largest counties in terms of population, each with just over 1.9 million people. A patchwork of regions England is just one of the four countries that compose the United Kingdom of Great Britain and Northern Ireland, with England, Scotland and Wales making up Great Britain. England is therefore not to be confused with Great Britain or the United Kingdom as a whole. Within England, the next subdivisions are the nine regions of England, containing various smaller units such as unitary authorities, metropolitan counties and non-metropolitan districts. The counties in this statistic, however, are based on the ceremonial counties of England as defined by the Lieutenancies Act of 1997. Regions of Scotland, Wales, and Northern Ireland Like England, the other countries of the United Kingdom have their own regional subdivisions, although with some different terminology. Scotland’s subdivisions are council areas, while Wales has unitary authorities, and Northern Ireland has local government districts. As of 2024, the most-populated Scottish council area was Glasgow City, with over 650,000 inhabitants. In Wales, Cardiff had the largest population among its unitary authorities, and in Northern Ireland, Belfast was the local government area with the most people living there.
- a
Borough Boundary
- lambethopenmappingdata-lambethcouncil.opendata.arcgis.com
Updated Dec 16, 2020ShareFacebookTwitterEmailClick to copy linkLink copiedCitelondon borough of lambeth (2020). Borough Boundary [Dataset]. https://lambethopenmappingdata-lambethcouncil.opendata.arcgis.com/datasets/borough-boundary-1Dataset updatedDec 16, 2020Dataset authored and provided bylondon borough of lambethArea coveredDescriptionshowing boundary of lambeth council
- U
2011 Census Geography boundaries (Wards and Electoral Divisions)
- statistics.ukdataservice.ac.uk
zipUpdated Sep 20, 2022ShareFacebookTwitterEmailClick to copy linkLink copiedCiteBoundary (2022). 2011 Census Geography boundaries (Wards and Electoral Divisions) [Dataset]. https://statistics.ukdataservice.ac.uk/dataset/2011-census-geography-boundaries-wards-and-electoral-divisionszipAvailable download formatsDataset updatedSep 20, 2022Dataset authored and provided byBoundaryLicenseOpen Government Licence 3.0http://www.nationalarchives.gov.uk/doc/open-government-licence/version/3/
License information was derived automaticallyDescriptionElectoral Wards/Divisions are the key building blocks of UK administrative geography. They are the spatial units used to elect local government councillors in metropolitan and non-metropolitan districts, unitary authorities and the London boroughs in England; unitary authorities in Wales; council areas in Scotland; and district council areas in Northern Ireland.
The Wards and Electoral Divisions list contains 9,481 areas of the following constituent geographies:
- 7,218 Census Wards in England
- 453 Census Electoral Divisions in England
- 7 Census Merged Wards in England
- 582 Census Wards in Northern Ireland
- 353 Census Wards in Scotland
- 856 Census Electoral Divisions in Wales
- 12 Census Merged Wards in Wales
Please visit ONS Beginner's Guide to UK Geography for more info.
The boundaries are available as either extent of the realm (usually this is the Mean Low Water mark but in some cases boundaries extend beyond this to include off shore islands) or
clipped to the coastline (Mean High Water mark).
- s
Mortgage Lending in Great Britain (link)
- orda.shef.ac.uk
pngUpdated May 30, 2023ShareFacebookTwitterEmailClick to copy linkLink copiedCiteAlasdair Rae (2023). Mortgage Lending in Great Britain (link) [Dataset]. http://doi.org/10.15131/shef.data.6181136.v1pngAvailable download formatsUnique identifierhttps://doi.org/10.15131/shef.data.6181136.v1Dataset updatedMay 30, 2023Dataset provided byThe University of SheffieldAuthorsAlasdair RaeLicenseAttribution 4.0 (CC BY 4.0)https://creativecommons.org/licenses/by/4.0/
License information was derived automaticallyArea coveredGreat Britain, United KingdomDescriptionThis website provides interactive mapping of outstanding residential mortgage lending by postcode sector across Great Britain, as published by individual banks, via the Council of Mortgage Lenders. This first iteration of the website - published in January 2014 - uses the most recent bank lending data, which covers the period up to the end of June 2013. I hope to update the website with future data releases, if I have the time. The map is coloured so that there are roughly the same number of areas in each category displayed in the key to the right. It's important to remember that this data release covers only seven major lenders and about three quarters of the mortgage market - it is not the full story but it does give us interesting insights that were previously not possible. The release did not include mortgage lending data for Northern Ireland, so that's why it's not included here. I've included a large interactive map on the home page and if you click below that you can see a full screen map. I've also added in some tabs which show postcode sectors in and around London, Glasgow, Manchester and Cardiff but if you want to find somewhere else you can easily pan and zoom to it via the big map.
Live tables on local government finance
- gov.uk
- s3.amazonaws.com
Updated Nov 20, 2025ShareFacebookTwitterEmailClick to copy linkLink copiedCiteMinistry of Housing, Communities and Local Government (2025). Live tables on local government finance [Dataset]. https://www.gov.uk/government/statistical-data-sets/live-tables-on-local-government-financeDataset updatedNov 20, 2025AuthorsMinistry of Housing, Communities and Local GovernmentDescriptionBorrowing and investment
The borrowing and investment live tables provide the latest data available on local authorities’ outstanding borrowing and investments for the UK.
The information in this table is derived from the monthly and quarterly borrowing forms submitted to the Ministry of Housing, Communities and Local Government by all local authorities.
The table is updated as soon as new or revised data becomes available.
https://assets.publishing.service.gov.uk/media/691d96cde39a085bda43ef54/Q2_2025_26_Borrowing_and_Investment_Live_Table.ods">Borrowing and investment live table, Q2 2025 to 2026
 <p class="gem-c-attachment_metadata"><span class="gem-c-attachment_attribute"><abbr title="OpenDocument Spreadsheet" class="gem-c-attachment_abbr">ODS</abbr></span>, <span class="gem-c-attachment_attribute">3 MB</span></p>


  <p class="gem-c-attachment_metadata">
   This file is in an <a href="https://www.gov.uk/guidance/using-open-document-formats-odf-in-your-organisation" target="_self" class="govuk-link">OpenDocument</a> format
Capital payments and receipts
The capital payments and receipts live tables provide the latest data available on quarterly capital expenditure and receipts, at England level and by local authority.
The information in this table is derived from forms submitted to the Ministry of Housing, Communities and Local Government by all English local authorities.
The table is updated as soon as new or revised data becomes available.
https://assets.publishing.service.gov.uk/media/691d96acd140bbbaa59a29ee/CPR2_2025-26.ods">Capital payments and receipts Q2 2025 to 2026, England
 <p class="gem-c-attachment_metadata"><span class="gem-c-attachment_attribute"><abbr title="OpenDocument Spreadsheet" class="gem-c-attachment_abbr">ODS</abbr></span>, <span class="gem-c-attachment_attribute">1.51 MB</span></p>


  <p class="gem-c-attachment_metadata">
   This file is in an <a href="https://www.gov.uk/guidance/using-open-document-formats-odf-in-your-organisation" target="_self" class="govuk-link">OpenDocument</a> format
Council Tax and national non-domestic rates receipts
This live table provides the latest data available on receipts of Council Taxes collected during a financial year in England. The informatio
Population of the UK 2024, by region
- statista.com
Updated Sep 15, 2025ShareFacebookTwitterEmailClick to copy linkLink copiedCiteStatista (2025). Population of the UK 2024, by region [Dataset]. https://www.statista.com/statistics/294729/uk-population-by-region/Dataset updatedSep 15, 2025Time period covered2024Area coveredUnited KingdomDescriptionThe population of the United Kingdom in 2024 was estimated to be approximately 69.3 million, with over 9.6 million people living in South East England. London had the next highest population, at almost 9.1 million people, followed by the North West England at 7.7 million. With the UK's population generally concentrated in England, most English regions have larger populations than the constituent countries of Scotland, Wales, and Northern Ireland, which had populations of 5.5 million, 3.2 million, and 1.9 million respectively. English counties and cities The United Kingdom is a patchwork of various regional units, within England the largest of these are the regions shown here, which show how London, along with the rest of South East England had around 18 million people living there in this year. The next significant regional units in England are the 47 metropolitan and ceremonial counties. After London, the metropolitan counties of the West Midlands, Greater Manchester, and West Yorkshire were the biggest of these counties, due to covering the large urban areas of Birmingham, Manchester, and Leeds respectively. Regional divisions in Scotland, Wales and Northern Ireland The smaller countries that comprise the United Kingdom each have different local subdivisions. Within Scotland these are called council areas, whereas in Wales the main regional units are called unitary authorities. Scotland's largest Council Area by population is that of Glasgow City at over 650,000, while in Wales, it was the Cardiff Unitary Authority at around 384,000. Northern Ireland, on the other hand, has eleven local government districts, the largest of which is Belfast with a population of approxiamtely 352,000.

Not seeing a result you expected?
Learn how you can add new datasets to our index.
FacebookTwitterAttribution 4.0 (CC BY 4.0)https://creativecommons.org/licenses/by/4.0/
License information was derived automatically
The V1 ('flying bomb' or 'doodlebug') and V2 (a ballistic missile) were two new weapons developed by Nazi Germany. In 1944 and 1945 thousands were fired at London. They killed thousands of people and injured many more.
This dataset includes all impact sites for V1s and V2s within the London County Council boundary. These were manually compiled from bomb maps published in 'The London County Council Bomb Damage Maps 1939-1945' by Laurence Ward (Thames and Hudson, 2015). The original LCC Bomb Damage maps are held at the London Archives.
**Please note that this is not a comprehensive dataset of all V1s and V2s. Only those within the London County Council boundary are included.**
| File | Explanation |
| bomb_map.kml | Map layer downloaded from Google Maps in
Keyhole Markup Language (KML) format
|
| data-conversion.R | Script used to convert the KML file to tables of impacts. |
| V1-impacts.csv | Locations of V1 impact sites with page number (in Ward 2015), longitude, latitude, easting, northing. |
| V2-impacts.csv | Locations of V2 impact sites with page number (in Ward 2015), longitude, latitude, easting, northing. |
We previously analysed this dataset in 'The flying bomb and the actuary', Significance (2019). doi: 10.1111/j.1740-9713.2019.01315.x
The impact sites can also be viewed as a layer on Google Maps. Data is separated into two layers: V1 sites and V2 sites. Each point represents an impact site, with the closest street name (to help with possible cross-reference) and page number in the LCC Bomb Damage Maps: https://www.google.com/maps/d/viewer?mid=1VwyxV_e_LAwzbyJPCAF-C7aCRVNA5W7N&ll=51.509018493447314%2C-0.05324588962980492&z=14