- l
Election 2018 and 2022 Ward Boundaries
- opendata.london.ca
Updated Mar 21, 2019 Share
Share Facebook
 Twitter
 EmailClick to copy linkLink copiedCiteopendata_London (2019). Election 2018 and 2022 Ward Boundaries [Dataset]. https://opendata.london.ca/datasets/3f7bd8a96500488ebad6f53faa60513dDataset updatedMar 21, 2019Dataset authored and provided byopendata_LondonArea coveredDescription
In this layer, the boundaries of 2018 electoral wards are represented by polygons. These are the current/existing ward boundaries.
Ward Maps
- ckan.publishing.service.gov.uk
Updated Nov 30, 2022+ more versionsShareFacebookTwitterEmailClick to copy linkLink copiedCiteckan.publishing.service.gov.uk (2022). Ward Maps [Dataset]. https://ckan.publishing.service.gov.uk/dataset/ward-mapsDataset updatedNov 30, 2022DescriptionThe London Borough of Barnet is divided into 24 electoral Wards. The current warding arrangement came into effect on 5th May 2022. These maps have been created as general resource for the council. The information is sourced from Ordnance Survey Open Data products and may be used more widely subject to the Open Government Licence (v3). Each ward map is available in 2 different sizes, in pdf format and includes an approximate scale and information currency. Ward boundary information is from OS Boundary-Line™ (normally released in May and October) The A3 base map information is from OS OpenMap - Local (normally released in April and October) The A4 base map information is from OS VectorMap District (normally released in May and November) Only the latest version of the maps are published and older versions are not retained. Please note: these maps may not reflect the latest information published by Ordnance Survey, see document dates for date last updated. Data and Resources BarnetWardMaps-A3-OpenMapLocal.zip Zip file of all 24 Barnet Ward maps A3 based on OS OpenMap-Local
Ward Profiles and Atlas
- data.wu.ac.at
csv, html, pdf, xlsUpdated Mar 15, 2018+ more versionsShareFacebookTwitterEmailClick to copy linkLink copiedCiteGreater London Authority (GLA) (2018). Ward Profiles and Atlas [Dataset]. https://data.wu.ac.at/odso/data_gov_uk/Yzc4NjlkZDQtN2EwNS00ZDVkLTllNDItYmRmYzhkYThjMWI3xls, html, csv, pdfAvailable download formatsDataset updatedMar 15, 2018LicenseOpen Government Licence 3.0http://www.nationalarchives.gov.uk/doc/open-government-licence/version/3/
License information was derived automaticallyDescriptionThe ward profiles and ward atlas provide a range of demographic and related data for each ward in Greater London. They are designed to provide an overview of the population in these small areas by presenting a range of data on the population, diversity, households, life expectancy, housing, crime, benefits, land use, deprivation, and employment. Indicators included here are population by age and sex, land area, projections, population density, household composition, religion, ethnicity, birth rates (general fertility rate), death rates (standardised mortality ratio), life expectancy, average house prices, properties sold, housing by council tax band, tenure, property size (bedrooms), dwelling build period and type, mortgage and landlord home repossession, employment and economic activity, Incapacity Benefit, Housing Benefit, Household income, Income Support and JobSeekers Allowance claimant rates, dependent children receiving child-tax credits by lone parents and out-of-work families, child poverty, National Insurance Number registration rates for overseas nationals (NINo), GCSE results, A-level / Level 3 results (average point scores), pupil absence, child obesity, crime rates (by type of crime), fires, ambulance call outs, road casualties, happiness and well-being, land use, public transport accessibility (PTALs), access to public greenspace, access to nature, air emissions / quality, car use, bicycle travel, Indices of Deprivation, and election turnout. The Ward Profiles present key summary measures for the most recent year, using both Excel and InstantAtlas mapping software. This is a useful tool for displaying a large amount of data for numerous geographies, in one place. The Ward Atlas presents a more detailed version of the data including trend data and generally includes the raw numbers as opposed to percentages or rates. The Instant Atlas reports use HTML5 technology, which can be used in modern browsers, including on Apple machines, but will not function on older browsers. WARD PROFILES Compare the ward measure against the Borough, London and National average. WARD ATLAS Access the raw data for all London wards. WARD ATLAS FOR 2014 BOUNDARIES In May 2014, ward boundaries changed in Hackney, Kensington and Chelsea, and Tower Hamlets. This version of the ward atlas gives data for these new wards, as well as retaining data on the unchanged wards in the rest of London for comparison purposes. Data for boroughs has also been included. Very few datasets have been published for the new ward boundaries, so the majority of data contained in this atlas have been modelled using a method of proportion of households from the old boundaries that are located in the new boundaries. Therefore, the data contained in this atlas are indicative only. Instant Atlas for 2014 Ward Atlas Tips: - Select a new indicator from the Data box on the left. Select the theme, then indicator and then year to show the data. - To view data just for one borough*, use the filter tool. - Some legend settings can be altered by clicking on the cog icon next to the Wards tick box within the map legend. - The wards can be ranked in order by clicking at the top of the indicator column of the data table. Note: Additional indicator information and sources are included within the spreadsheet and Instant Atlas report. OTHER SMALL AREA PROFILES Other profiles available include Borough, LSOA and MSOA atlases. Data from these profiles were used to create the Well-being scores tool. *The London boroughs are: City of London, Barking and Dagenham, Barnet, Bexley, Brent, Bromley, Camden, Croydon, Ealing, Enfield, Greenwich, Hackney, Hammersmith and Fulham, Haringey, Harrow, Havering, Hillingdon, Hounslow, Islington, Kensington and Chelsea, Kingston upon Thames, Lambeth, Lewisham, Merton, Newham, Redbridge, Richmond upon Thames, Southwark, Sutton, Tower Hamlets, Waltham Forest, Wandsworth, Westminster. These profiles were created using the most up to date information available at the time of collection (September 2015).
- e
Πρότυπο χαρτογράφησης Excel για τους δήμους και τους Wards του Λονδίνου
- data.europa.eu
unknownUpdated Apr 24, 2012ShareFacebookTwitterEmailClick to copy linkLink copiedCite(2012). Πρότυπο χαρτογράφησης Excel για τους δήμους και τους Wards του Λονδίνου [Dataset]. https://data.europa.eu/data/datasets/excel-mapping-template-for-london-boroughs-and-wards?locale=elunknownAvailable download formatsDataset updatedApr 24, 2012DescriptionA free mapping tool that allows you to create a thematic map of London without any specialist GIS skills or software - all you need is Microsoft Excel. Templates are available for London’s Boroughs and Wards. Full instructions are contained within the spreadsheets.
Macros
The tool works in any version of Excel. But the user MUST ENABLE MACROS, for the features to work. There a some restrictions on functionality in the ward maps in Excel 2003 and earlier - full instructions are included in the spreadsheet.
To check whether the macros are enabled in Excel 2003 click Tools, Macro, Security and change the setting to Medium. Then you have to re-start Excel for the changes to take effect. When Excel starts up a prompt will ask if you want to enable macros - click yes.
In Excel 2007 and later, it should be set by default to the correct setting, but if it has been changed, click on the Windows Office button in the top corner, then Excel options (at the bottom), Trust Centre, Trust Centre Settings, and make sure it is set to 'Disable all macros with notification'. Then when you open the spreadsheet, a prompt labelled 'Options' will appear at the top for you to enable macros.
To create your own thematic borough maps in Excel using the ward map tool as a starting point, read these instructions. You will need to be a confident Excel user, and have access to your boundaries as a picture file from elsewhere. The mapping tools created here are all fully open access with no passwords.
Copyright notice: If you publish these maps, a copyright notice must be included within the report saying: "Contains Ordnance Survey data © Crown copyright and database rights."
NOTE: Excel 2003 users must 'ungroup' the map for it to work.
Excel Mapping Template for London Boroughs and Wards
- ckan.publishing.service.gov.uk
Updated Sep 30, 2025+ more versionsShareFacebookTwitterEmailClick to copy linkLink copiedCiteckan.publishing.service.gov.uk (2025). Excel Mapping Template for London Boroughs and Wards [Dataset]. https://ckan.publishing.service.gov.uk/dataset/excel-mapping-template-for-london-boroughs-and-wards1Dataset updatedSep 30, 2025Area coveredLondonDescriptionA free mapping tool that allows you to create a thematic map of London without any specialist GIS skills or software - all you need is Microsoft Excel. Templates are available for London’s Boroughs and Wards. Full instructions are contained within the spreadsheets. Macros The tool works in any version of Excel. But the user MUST ENABLE MACROS, for the features to work. There a some restrictions on functionality in the ward maps in Excel 2003 and earlier - full instructions are included in the spreadsheet. To check whether the macros are enabled in Excel 2003 click Tools, Macro, Security and change the setting to Medium. Then you have to re-start Excel for the changes to take effect. When Excel starts up a prompt will ask if you want to enable macros - click yes. In Excel 2007 and later, it should be set by default to the correct setting, but if it has been changed, click on the Windows Office button in the top corner, then Excel options (at the bottom), Trust Centre, Trust Centre Settings, and make sure it is set to 'Disable all macros with notification'. Then when you open the spreadsheet, a prompt labelled 'Options' will appear at the top for you to enable macros. To create your own thematic borough maps in Excel using the ward map tool as a starting point, read these instructions. You will need to be a confident Excel user, and have access to your boundaries as a picture file from elsewhere. The mapping tools created here are all fully open access with no passwords. Copyright notice: If you publish these maps, a copyright notice must be included within the report saying: "Contains Ordnance Survey data © Crown copyright and database rights." NOTE: Excel 2003 users must 'ungroup' the map for it to work.
i-Trees Canopy Ward Data - Dataset - data.gov.uk
- ckan.publishing.service.gov.uk
Updated Jun 9, 2025+ more versionsShareFacebookTwitterEmailClick to copy linkLink copiedCiteckan.publishing.service.gov.uk (2025). i-Trees Canopy Ward Data - Dataset - data.gov.uk [Dataset]. https://ckan.publishing.service.gov.uk/dataset/i-trees-canopy-ward-dataDataset updatedJun 9, 2025DescriptionWard boundaries for all London boroughs suitable for use in i-Trees Canopy tool. Based on Ordnance Survey Boundary-Line data available from the OpenData website. Data has been converted to latitude/longitude values (WGS84 geographic coordinate system) and saved in shapefile format, suitable for use on the i-Trees website. The i-Trees tool offers a quick and easy way to produce a statistically valid estimate of land cover types e.g. tree cover, using aerial images available in Google Maps. All that is required is an internet connection and a shapefile which defines your study area. We recommend using the boundary of your ward as a study area and this can be obtained by downloading the zip file for your Borough below. Each zip file contains individual shapefiles for every ward in that area. Each shapefile requires four different files in order to work correctly so please ensure these are all extracted from the zip file before trying to upload on the i-Trees website. For example the shapefile for Brockley ward in Lewisham consists of the following files: -Lewisham_Brockley.dbf -Lewisham_Brockley.prj -Lewisham_Brockley.shp -Lewisham_Brockley.shx
- w
Data from: London Ward Well-Being Scores
- data.wu.ac.at
html +3Updated Mar 15, 2018+ more versionsShareFacebookTwitterEmailClick to copy linkLink copiedCiteGreater London Authority (GLA) (2018). London Ward Well-Being Scores [Dataset]. https://data.wu.ac.at/odso/data_gov_uk/MjMxNTljYTgtN2Q2Yi00YjFiLWEwYWYtNTQ4MDA5MWI1NzM2xls, zip, text/html; charset=utf-8, htmlAvailable download formatsDataset updatedMar 15, 2018Dataset provided byGreater London Authority (GLA)LicenseOpen Government Licence 3.0http://www.nationalarchives.gov.uk/doc/open-government-licence/version/3/
License information was derived automaticallyArea coveredLondonDescriptionThese ward level well being scores present a combined measure of well-being indicators of the resident population based on 12 different indicators. Where possible each indicator score is compared with the England and Wales average, which is zero. Scores over 0 indicate a higher probability that the population on average will experience better well-being according to these measures. Users can adjust the weight of each indicator depending on what they consider to be the more or less important, thus generating bespoke scores. This is done either by entering a number between 0 and 10. The scores throughout the spreadsheet will update automatically. The tool combines data across a range of themes for the last five years of available data (2009-2013). Either view the results in the online interactive tool here, Or download the interactive spreadsheet here The well-being scores are then presented in a ranked bar chart for each borough, and a ward map of London. The spreadsheet also highlights wards in the top and bottom 25 per cent in London. Wards that have shown significant improvement or reduction in their scores relative to the average over the five year period are also highlighted. Borough figures are provided to assist with comparisons. Rankings and summary tables are included. The source data that the tool is based on is included in the spreadsheet. The Excel file is 8.1MB. IMPORTANT NOTE, users must enable macros when prompted upon opening the Excel spreadsheet (or reset security to medium/low) for the map to function. The rest of the tool will function without macros. If you cannot download the Excel file directly try this zip file (2.6MB). If you experience any difficulties with downloading this spreadsheet, please contact the London Datastore in the Intelligence Unit. Detailed information about definitions and sources is contained within the spreadsheet. The 12 measures included are: Health - Life Expectancy - Childhood Obesity - Incapacity Benefits claimant rate Economic security - Unemployment rate Safety - Crime rate - Deliberate Fires Education - GCSE point scores Children - Unauthorised Pupil Absence Families - Children in out-of-work households Transport - Public Transport Accessibility Scores (PTALs) Environment - Access to public open space & nature Happiness - Composite Subjective Well-being Score (Life Satisfaction, Worthwhileness, Anxiety, and Happiness) (New data only available since 2011/12) With some measures if the data shows a high figure that indicates better well-being, and with other measures a low figure indicates better well-being. Therefore scores for Life Expectancy, GCSE scores, PTALs, and Access to Public Open Space/Nature have been reversed so that in all measures low scores indicate probable lower well-being. The data has been turned into scores where each indicator in each year has a standard deviation of 10. This means that each indicator will have an equal effect on the final score when the weightings are set to equal. Why should measuring well-being be important to policy makers? Following research by the Cabinet Office and Office for National Statistics, the government is aiming to develop policy that is more focused on ‘all those things that make life worthwhile’ (David Cameron, November 2010). They are interested in developing new and better ways to understand how policy and public services affect well-being. Why measure well-being for local areas? It is important for London policy makers to consider well-being at a local level (smaller than borough level) because of the often huge differences within boroughs. Local authorities rely on small area data in order to target resources, and with local authorities currently gaining more responsibilities from government, this is of increasing importance. But small area data is also of interest to academics, independent analysts and members of the public with an interest in the subject of well-being. How can well-being be measured within small areas? The Office for National Statistics have been developing new measures of national well-being, and as part of this, at a national and regional level, the ONS has published some subjective data to measure happiness. ONS have not measured well-being for small areas, so this tool has been designed to fill this gap. However, DCLG have published a tool that models life satisfaction data for LSOAs based on a combination of national level happiness data, and 'ACORN' data. Happiness data is not available for small areas because there are no surveys large enough for this level of detail, and so at this geography the focus is on objective indicators. Data availability for small areas is far more limited than for districts, and this means the indicators that the scores are based on are not all perfect measures of well-being, though they are the best available. However, by using a relatively high number of measures across a number of years, this increases the reliability of the well-being scores. How can this tool be used to help policy makers? Each neighbourhood will have its own priorities, but the data in this tool could help provide a solid evidence base for informed local policy-making, and the distribution of regeneration funds. In addition, it could assist users to identify the causes behind an improvement in well-being in certain wards, where examples of good practice could be applied elsewhere. Differences to the previous report This is the 2013 edition of this publication, and there is one change from 2012. Indicators of Election turnout has been replaced with a composite score of subjective well-being indicators. Past versions are still available for 2011 and 2012. The rationale/methodology paper from 2011 is here. The scores from the 2012 spreadsheet are also available in PDF format. The scores in Intelligence Update 21-2012 are based on equal weightings across each measure. This tool was created by the GLA Intelligence Unit. Please contact datastore@london.gov.uk for more information.
- e
Borough Council Election Results 2014
- data.europa.eu
excel xls, pdfUpdated Dec 1, 2014+ more versionsShareFacebookTwitterEmailClick to copy linkLink copiedCiteGreater London Authority (2014). Borough Council Election Results 2014 [Dataset]. https://data.europa.eu/data/datasets/borough-council-election-results-2014excel xls, pdfAvailable download formatsDataset updatedDec 1, 2014Dataset authored and provided byGreater London AuthorityDescription
This report includes a great deal of detail on every aspect of the 2014 London Borough council general elections. No other single volume presents the full results and election statistics from the 32 London boroughs enabling the reader to analyse and compare the results across London in one place. The report presents data for every candidate in every ward (excluding the City of London which operates on a different electoral model). The report also contains analysis of the European election results for London that took place on the same day.
Printed Copies We are able to accept orders for hard copies £30. Click here for further details.
Details of all previous elections reports in the series can be found here.
Summary results of the 2014 local elections in London, showing number and percentage of seats won, turnout and political control.
Final 2014 ward results
These results show the number of votes for each candidate in each ward in London. Turnout, number of ballots, postal votes, and breakdown of rejected votes, Mayoral and European voting figures are also included where available.
Map showing political control in each ward.
https://londondatastore-upload.s3.amazonaws.com/images/London-ward-map-borough-election-2014-new-colours-small.png" alt="">
Also, using these ward results, Oliver O'Brien from CASA has created some eye catching interactive ward maps.
The borough map shows the summary results in both the 2010 and 2014 elections.
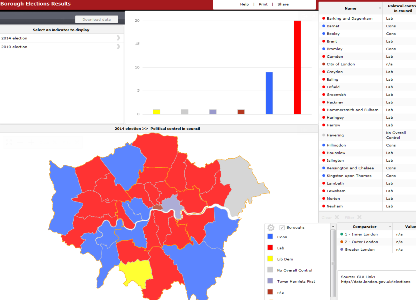
The ward interactive map shows the detailed results for each candidate at ward level for the last three elections between 2006 and 2014.

This motion chart shows the relationship, between share of votes and seats won by the major parties in elections since 1964 at borough level (requires Adobe Flash Player).
 )
) - a
Ward aggregated PTAL stats 2023
- gis-tfl.opendata.arcgis.com
Updated Jun 6, 2025ShareFacebookTwitterEmailClick to copy linkLink copiedCiteTransport for London (2025). Ward aggregated PTAL stats 2023 [Dataset]. https://gis-tfl.opendata.arcgis.com/datasets/ward-aggregated-ptal-stats-2023Dataset updatedJun 6, 2025Dataset authored and provided byTransport for LondonArea coveredDescriptionPublic Transport Accessibility Levels (PTAL) are aggregated at the Ward level, a standard geographical unit in the UK. This dataset includes summary statistics (min, max, and mean PTAL scores) per Ward. The aggregation is based on Access Index values of PTAL (Public Transport Accessibility Level) dataset. PTAL dataset measures accessibility to public transport services across Greater London using a 100m x 100m grid resolution. PTAL scores are derived from walking times to nearby public transport services and service frequencies. This granular dataset is aggregated to the Ward level. The mean of PTAL is calculated based on access indices of grid centroids within each Ward and classified into six PTAL categories again. Similarly, the minimum and maximum values are identified using grid centroids within each Ward. The spatial boundary layer displaying Wards on the map sourced from Office for National Statistics licensed under the Open Government Licence v.3.0.
- e
Teimpléad Mapála Excel do Bhuirgí agus Bardaí Londain
- data.europa.eu
Updated Oct 11, 2021ShareFacebookTwitterEmailClick to copy linkLink copiedCiteGreater London Authority (2021). Teimpléad Mapála Excel do Bhuirgí agus Bardaí Londain [Dataset]. https://data.europa.eu/data/datasets/excel-mapping-template-for-london-boroughs-and-wards1?locale=gaDataset updatedOct 11, 2021Dataset authored and provided byGreater London AuthorityArea coveredLondonDescriptionA free mapping tool that allows you to create a thematic map of London without any specialist GIS skills or software - all you need is Microsoft Excel. Templates are available for London’s Boroughs and Wards. Full instructions are contained within the spreadsheets.
Macros
The tool works in any version of Excel. But the user MUST ENABLE MACROS, for the features to work. There a some restrictions on functionality in the ward maps in Excel 2003 and earlier - full instructions are included in the spreadsheet.
To check whether the macros are enabled in Excel 2003 click Tools, Macro, Security and change the setting to Medium. Then you have to re-start Excel for the changes to take effect. When Excel starts up a prompt will ask if you want to enable macros - click yes.
In Excel 2007 and later, it should be set by default to the correct setting, but if it has been changed, click on the Windows Office button in the top corner, then Excel options (at the bottom), Trust Centre, Trust Centre Settings, and make sure it is set to 'Disable all macros with notification'. Then when you open the spreadsheet, a prompt labelled 'Options' will appear at the top for you to enable macros.
To create your own thematic borough maps in Excel using the ward map tool as a starting point, read these instructions. You will need to be a confident Excel user, and have access to your boundaries as a picture file from elsewhere. The mapping tools created here are all fully open access with no passwords.
Copyright notice: If you publish these maps, a copyright notice must be included within the report saying: "Contains Ordnance Survey data © Crown copyright and database rights."
NOTE: Excel 2003 users must 'ungroup' the map for it to work.
- a
Plan of London Middlesex County Ontario [cartographic material].
- arc-gis-hub-home-arcgishub.hub.arcgis.com
Updated Jul 24, 2025ShareFacebookTwitterEmailClick to copy linkLink copiedCiteWestern University (2025). Plan of London Middlesex County Ontario [cartographic material]. [Dataset]. https://arc-gis-hub-home-arcgishub.hub.arcgis.com/documents/75ffae20ccf04fed8fdfdbc9cdb6c796Dataset updatedJul 24, 2025Dataset authored and provided byWestern UniversityLicenseAttribution-NonCommercial 4.0 (CC BY-NC 4.0)https://creativecommons.org/licenses/by-nc/4.0/
License information was derived automaticallyArea coveredLondon, Ontario, Middlesex CountyDescriptionThis map is part of the Map and Data Centre Collections, and is available for physical viewing under the call number C33 D03 or C207 D18. Explore the item in our Library Catalogue: Collection PermalinkPublication Date: 1875 Publisher Location: Place of publication not identified. Publisher: Publisher not identified. Scale: 1 cm = 40 rods. Geographic Area: London (Ont.) Description: Map of London, Ontario, circa 1875, highlighting political wards in colour, street, railways, and locations of some buildings. Physical Size: 48 x 28 cm Notes: p. 159 of Tackabury's Atlas of the Dominion of Canada / Henry Francis Walling. Montreal, Tackabury, 1875. Written in lower left-hand corner: "2615901".
- e
Exceli vastendusmall Londoni linnaosade ja linnaosade jaoks
- data.europa.eu
Updated Oct 11, 2021ShareFacebookTwitterEmailClick to copy linkLink copiedCiteGreater London Authority (2021). Exceli vastendusmall Londoni linnaosade ja linnaosade jaoks [Dataset]. https://data.europa.eu/data/datasets/excel-mapping-template-for-london-boroughs-and-wards1?locale=etDataset updatedOct 11, 2021Dataset authored and provided byGreater London AuthorityDescriptionA free mapping tool that allows you to create a thematic map of London without any specialist GIS skills or software - all you need is Microsoft Excel. Templates are available for London’s Boroughs and Wards. Full instructions are contained within the spreadsheets.
Macros
The tool works in any version of Excel. But the user MUST ENABLE MACROS, for the features to work. There a some restrictions on functionality in the ward maps in Excel 2003 and earlier - full instructions are included in the spreadsheet.
To check whether the macros are enabled in Excel 2003 click Tools, Macro, Security and change the setting to Medium. Then you have to re-start Excel for the changes to take effect. When Excel starts up a prompt will ask if you want to enable macros - click yes.
In Excel 2007 and later, it should be set by default to the correct setting, but if it has been changed, click on the Windows Office button in the top corner, then Excel options (at the bottom), Trust Centre, Trust Centre Settings, and make sure it is set to 'Disable all macros with notification'. Then when you open the spreadsheet, a prompt labelled 'Options' will appear at the top for you to enable macros.
To create your own thematic borough maps in Excel using the ward map tool as a starting point, read these instructions. You will need to be a confident Excel user, and have access to your boundaries as a picture file from elsewhere. The mapping tools created here are all fully open access with no passwords.
Copyright notice: If you publish these maps, a copyright notice must be included within the report saying: "Contains Ordnance Survey data © Crown copyright and database rights."
NOTE: Excel 2003 users must 'ungroup' the map for it to work.
London Elections Results 2016, Wards, Boroughs, Constituency
- data.wu.ac.at
html, xlsUpdated Mar 15, 2018+ more versionsShareFacebookTwitterEmailClick to copy linkLink copiedCiteGreater London Authority (GLA) (2018). London Elections Results 2016, Wards, Boroughs, Constituency [Dataset]. https://data.wu.ac.at/schema/data_gov_uk/MTI1NGNlMDctOGYxZC00ZWM0LWE2NGEtNzAzMmZlMTQxNmVkxls, htmlAvailable download formatsDataset updatedMar 15, 2018LicenseOpen Government Licence 3.0http://www.nationalarchives.gov.uk/doc/open-government-licence/version/3/
License information was derived automaticallyDescriptionDATA The results for the Mayoral and Assembly elections down to constituency level are available (including turnout and spoils etc). All Geographies - This spreadsheet includes data for Constituencies, Boroughs, Wards and postal votes. Also includes turnout figures and first choice by second choice Mayoral vote matrices. Detailed Constituencies - Contains more detailed data at Constituency level. Includes percentages and a table showing how the London-wide assembly seats were allocated. Time series - Contains elections data from 2000 to 2016 for Constituency and Borough level. Please note that due to boundary changes, 2016 ward data is not comparable with previous years' data. INTERACTIVE MAPPING The 2000-2012 election data for wards, boroughs, and constituencies is presented using interactive maps and charts in an InstantAtlas report. Click on the image below to launch the tool. More info on the 2016 elections can be found on the London Elects website.

Not seeing a result you expected?
Learn how you can add new datasets to our index.
FacebookTwitterIn this layer, the boundaries of 2018 electoral wards are represented by polygons. These are the current/existing ward boundaries.