- s
Local Authority Districts, Counties and Unitary Authorities (April 2021) Map...
- geoportal.statistics.gov.uk
- hub.arcgis.com
Updated Oct 8, 2021+ more versions Share
Share Facebook
 Twitter
 EmailClick to copy linkLink copiedCiteOffice for National Statistics (2021). Local Authority Districts, Counties and Unitary Authorities (April 2021) Map in the UK [Dataset]. https://geoportal.statistics.gov.uk/documents/66b816fda5cd44e5a4ff5c38dcfa2777Dataset updatedOct 8, 2021Dataset authored and provided byOffice for National StatisticsLicense
https://www.ons.gov.uk/methodology/geography/licenceshttps://www.ons.gov.uk/methodology/geography/licences
Area coveredDescriptionA PDF map that shows the local authority districts, counties and unitary authorities in the United Kingdom as at April 2021. The map has been created to show the United Kingdom from country level down to local authority district level. (File Size - 1,969 KB)
- E
Data from: Great Britain Local Authority Districts Council Areas and Unitary...
- find.data.gov.scot
- dtechtive.com
xml, zipUpdated Feb 21, 2017+ more versionsShareFacebookTwitterEmailClick to copy linkLink copiedCiteEDINA (2017). Great Britain Local Authority Districts Council Areas and Unitary Authorities [Dataset]. http://doi.org/10.7488/ds/1882zip(19.1 MB), xml(0.0038 MB)Available download formatsUnique identifierhttps://doi.org/10.7488/ds/1882Dataset updatedFeb 21, 2017Dataset provided byEDINALicenseAttribution 4.0 (CC BY 4.0)https://creativecommons.org/licenses/by/4.0/
License information was derived automaticallyArea coveredGreat Britain, United KingdomDescriptionThis data shows the local authority districts, council areas (Scotland) and unitary authorities for Great Britain. The attached Layer File can be used to symbolise the different types of boundaries. A JPEG image of the map is also contained in the download. This dataset was made from the OS OpenData Boundary Line product http://www.ordnancesurvey.co.uk/oswebsite/products/boundary-line/index.html. GIS vector data. This dataset was first accessioned in the EDINA ShareGeo Open repository on 2012-05-10 and migrated to Edinburgh DataShare on 2017-02-21.
- U
2011 Census Geography boundaries (Local Authorities)
- statistics.ukdataservice.ac.uk
zipUpdated Sep 20, 2022ShareFacebookTwitterEmailClick to copy linkLink copiedCiteBoundary (2022). 2011 Census Geography boundaries (Local Authorities) [Dataset]. https://statistics.ukdataservice.ac.uk/dataset/2011-census-geography-boundaries-local-authoritieszip(92424200), zip(107269382), zip(50210464), zip(45607917), zip(13525), zip(41344789), zip(15337), zip(35828017)Available download formatsDataset updatedSep 20, 2022Dataset provided byBoundaryLicensehttp://reference.data.gov.uk/id/open-government-licencehttp://reference.data.gov.uk/id/open-government-licence
DescriptionLocal Authority is a generic term used to cover London Boroughs, Metropolitan Districts, Non-Metropolitan Districts, and Unitary Authorities in England; Unitary Authorities in Wales; Council Areas in Scotland; and Local Government Districts in Northern Ireland.
The Local Authorities area list contains 404 areas of the following constituent geographies:
- 36 Metropolitan Districts in England
- 201 Non-Metropolitan Districts in England
- 31 London Boroughs in England
- 54 Unitary Authorities in England
- 26 Local Government Districts in Northern Ireland
- 32 Council Areas in Scotland
- 22 Unitary Authorities in Wales
- 2 Census Merged Districts in England
Please visit ONS Beginner's Guide to UK Geography for more info.
The boundaries are available as either extent of the realm (usually this is the Mean Low Water mark but in some cases boundaries extend beyond this to include off shore islands) or
clipped to the coastline (Mean High Water mark).
Local Authority Districts (December 2021) Names and Codes in the UK
- geoportal.statistics.gov.uk
- hub.arcgis.com
- +1more
Updated Nov 24, 2021+ more versionsShareFacebookTwitterEmailClick to copy linkLink copiedCiteLocal Authority Districts (December 2021) Names and Codes in the UK [Dataset]. https://geoportal.statistics.gov.uk/documents/d1fab2d9fb0a4576a7e08f89ac7e0b72Dataset updatedNov 24, 2021Licensehttps://www.ons.gov.uk/methodology/geography/licenceshttps://www.ons.gov.uk/methodology/geography/licences
Area coveredDescriptionThis file contains the names and codes for local authority districts (LAD) and unitary authorities (UA) in the United Kingdom as at 31st December 2021. (File Size - 48KB)Field Names - LAD21CD, LAD21NM, LAD21NMW, FIDField Types - Text, Text, Text, NumberField Lengths - 9, 36, 24FID = The FID, or Feature ID is created by the publication process when the names and codes / lookup products are published to the Open Geography portal. File includes the following LAD changes. E06000061 - North Northamptonshire, E06000062 , West Northamptonshire - new unitary authorities created - (Northamptonshire county abolished)E07000150 - Corby, E07000151 - Daventry, E07000152 - East Northamptonshire, E07000153 - Kettering, E07000154 - Northampton, E07000155 - South Northamptonshire, E07000156 - Wellingborough abolished
Regions and their constituent Counties and Unitary Authorities (April 2011)...
- data.wu.ac.at
- data.europa.eu
html, pdfUpdated Apr 28, 2018+ more versionsShareFacebookTwitterEmailClick to copy linkLink copiedCiteOffice for National Statistics (2018). Regions and their constituent Counties and Unitary Authorities (April 2011) Map in the United Kingdom [Dataset]. https://data.wu.ac.at/schema/data_gov_uk/NmEyYmEzMjItNzEyYy00NmE4LThkYTMtM2Q4MDE4YzQ4YzA3html, pdfAvailable download formatsDataset updatedApr 28, 2018LicenseOpen Government Licence 3.0http://www.nationalarchives.gov.uk/doc/open-government-licence/version/3/
License information was derived automaticallyArea coveredUnited KingdomDescriptionA PDF map shows the Regions and their constituent counties, metropolitan counties, Greater London authority and unitary authorities in England, council areas in Scotland, unitary authorities in Wales and district council areas in Northern Ireland as at April 2011. (File Size - 638 KB).
Playgrounds owned and managed by Clare County Council
- data-clarecoco.opendata.arcgis.com
- hub.arcgis.com
Updated Jan 21, 2020+ more versionsShareFacebookTwitterEmailClick to copy linkLink copiedCiteClare County Council (2020). Playgrounds owned and managed by Clare County Council [Dataset]. https://data-clarecoco.opendata.arcgis.com/maps/d95ed2a5e7ab4784838d8b6bc2db6496Dataset updatedJan 21, 2020Dataset authored and provided byClare County CouncilLicenseAttribution 4.0 (CC BY 4.0)https://creativecommons.org/licenses/by/4.0/
License information was derived automaticallyArea coveredDescriptionPlaygrounds owned and managed by Clare County Council Dataset Publisher: Clare County Council Dataset language: English Spatial Projection: Web Mercator Date of Creation: 2020 Update Frequency: As Required Clare County Council provides this information with the understanding that it is not guaranteed to be accurate, correct or complete. Clare County Council accepts no liability for any loss or damage suffered by those using this data for any purpose.
- d
Natural Capital County Atlas Mapping (England)
- environment.data.gov.uk
- data.europa.eu
zipUpdated Oct 14, 2020+ more versionsShareFacebookTwitterEmailClick to copy linkLink copiedCiteNatural England (2020). Natural Capital County Atlas Mapping (England) [Dataset]. https://environment.data.gov.uk/dataset/347c87af-15fb-4775-b893-336ac10b34d7zipAvailable download formatsDataset updatedOct 14, 2020LicenseOpen Government Licence 3.0http://www.nationalarchives.gov.uk/doc/open-government-licence/version/3/
License information was derived automaticallyDescriptionThis spatial dataset is an output of the Natural England County & City Natural Capital Atlas project (July 2020). It shows variation in ecosystem service flow for habitats across England, based on indicators identified by NE in the 2018 Natural Capital Indicators project. The dataset comprises a hexagonal grid which summarises indicator values across the country (each unit = 5km²).
Natural Capital is an important aspect of current environmental policy and management. This dataset, in combination with the other project outputs, will support understanding of Natural Capital in England and serve as a valuable engagement tool to communicate concepts of the Natural Capital approach to a wide variety of stakeholders.
For full methodology and user guide see documents ‘NCAtlas_Devon’ and ‘NC-Mapping-User-Guidance’ at http://publications.naturalengland.org.uk/publication/6672365834731520.
For full metadata documentation see the data package download below.
Copyright statement: LCM2015 © NERC (CEH) 2011. Contains Ordnance Survey data © Crown Copyright 2007. © Defra. Contains Defra information © Defra - Project MB0102. © Environment Agency. © Forestry Commission. © Historic England [year]. © Joint Nature Conservation Committee. © Natural England copyright. Contains Ordnance Survey data © Crown copyright and database right [year]. Contains data supplied by © NERC - Centre for Ecology & Hydrology. © Natural England copyright. Natural England Licence No. 2011/052 British Geological Survey © NERC, all rights reserved, © NSRI Cranfield University. Contains National Statistics data © Crown copyright and database right [year]. Contains Ordnance Survey data © Crown copyright and database right [year]. Contains Rural Payments Agency. © Barnsley Metropolitan Borough Council. © Bath & North East Somerset Council. © Bedford Borough Council. © London Borough of Bexley. © Birmingham City Council. © Blackburn with Darwen Borough Council. © Blackpool Council. © Bolton Council. © BCP Council. © Bracknell Forest Council. © City of Bradford Metropolitan District Council. © Brighton & Hove City Council. © Bristol City Council. © London Borough of Bromley. © Buckinghamshire County Council. © Bury Council. © Calderdale Council. © Cambridgeshire County Council. © Central Bedfordshire Council. © Cheshire East Council. © Cheshire West and Chester Council. © Cornwall Council. © Cumbria County Council. © Derbyshire County Council. © Devon County Council. © Doncaster Council. © Dorset Council. © Dudley Metropolitan Borough Council. © Durham County Council. © East Riding of Yorkshire Council. © East Sussex County Council. © Essex County Council. © Gateshead Council. © Gloucestershire County Council. © Hampshire County Council. © Herefordshire Council. © Hertfordshire County Council. © Hull City Council. © Isle of Anglesey County Council. © Isle of Wight Council. © Kent County Council. © Kirklees Council. © Knowsley Metropolitan Borough Council. © Lake District National Park. © Lancashire County Council. © Leicester City Council. © Leicestershire County Council. © Lincolnshire County Council. © Manchester City Council. © Medway Council. © Norfolk County Council. © North Lincolnshire Council. © North Somerset Council. © North Yorkshire County Council. © Northamptonshire County Council. © Northumberland County Council. © Nottingham City Council. © Nottinghamshire County Council. © Oldham Council. © Oxfordshire County Council. © Peterborough City Council. © Plymouth City Council. © Bournemouth, Christchurch and Poole Council. © Portsmouth City Council. © Reading Borough Council. © Redcar and Cleveland Borough Council. © Rochdale Borough Council. © Rotherham Metropolitan Borough Council. © Rutland County Council. © Salford City Council. © Sefton Council. © Sheffield City Council. © Shropshire Council. © Slough Borough Council. © Somerset County Council. © South Gloucestershire Council. © Southampton City Council. © St Helens Council. © Staffordshire County Council. © Stockport Metropolitan Borough Council. © Stockton Council. © Suffolk County Council. © Surrey County Council. © Tameside Metropolitan Borough Council. © Thurrock Council. © Torbay Council. © Trafford Council. © Wakefield Council. © Walsall Council. © Warrington Borough Council. © Warwickshire County Council. © West Berkshire Council. © West Sussex County Council. © Wigan Council. © Wiltshire Council. © Royal Borough of Windsor and Maidenhead Council. © Wirral Council. © Wokingham Borough Council. © Worcestershire County Council. © City of York Council.
Live tables on Council Tax
- gov.uk
- sasastunts.com
- +1more
Updated Mar 20, 2025ShareFacebookTwitterEmailClick to copy linkLink copiedCiteLive tables on Council Tax [Dataset]. https://www.gov.uk/government/statistical-data-sets/live-tables-on-council-taxDataset updatedMar 20, 2025AuthorsMinistry of Housing, Communities and Local GovernmentDescriptionBand D Council Tax
Band D Council Tax figures for local authorities since 1993.
https://assets.publishing.service.gov.uk/media/67daeb25a87d546feeda02a9/Band_D_2025-26.ods">Band D Council Tax figures 1993 onwards
 <p class="gem-c-attachment_metadata"><span class="gem-c-attachment_attribute"><abbr title="OpenDocument Spreadsheet" class="gem-c-attachment_abbr">ODS</abbr></span>, <span class="gem-c-attachment_attribute">1.12 MB</span></p>


  <p class="gem-c-attachment_metadata">
   This file is in an <a href="https://www.gov.uk/guidance/using-open-document-formats-odf-in-your-organisation" target="_self" class="govuk-link">OpenDocument</a> format
Average Council Tax per dwelling
Average Council Tax per dwelling for local authorities since 1993.
https://assets.publishing.service.gov.uk/media/67daebe991e6e04923028487/CT_Per_Dwelling_2025-26.ods">https://assets.publishing.service.gov.uk/media/67daebe991e6e04923028487/CT_Per_Dwelling_2025-26.ods">Average Council Tax per dwelling 1993 onwards
 <p class="gem-c-attachment_metadata"><span class="gem-c-attachment_attribute"><abbr title="OpenDocument Spreadsheet" class="gem-c-attachment_abbr">ODS</abbr></span>, <span class="gem-c-attachment_attribute">173 KB</span></p>


  <p class="gem-c-attachment_metadata">
   This file is in an <a href="https://www.gov.uk/guidance/using-open-document-formats-odf-in-your-organisation" target="_self" class="govuk-link">OpenDocument</a> format
Council Tax statistics for town and parish councils in England
Information on local precepting authorities (town and parish councils, charter trustees and Temples) and the amount of Council Tax collected on their behalf by their billing authorities in England.
- s
Local Government Districts of England and Wales, 1911
- searchworks.stanford.edu
zipUpdated May 4, 2021+ more versionsShareFacebookTwitterEmailClick to copy linkLink copiedCite(2021). Local Government Districts of England and Wales, 1911 [Dataset]. https://searchworks.stanford.edu/view/js129bj7579zipAvailable download formatsDataset updatedMay 4, 2021Area coveredWales, EnglandDescriptionThese are digital boundaries for the system of districts essentially created by the 1894 Local Government Act and continuing to exist until 1974. England and Wales were divided into County Boroughs, Municipal Boroughs, Urban Districts and Rural Districts. These generally functioned as sub-divisions of Administrative Counties with powers varying according to status, but County Boroughs were large cities with full independence from their County. The County of London was divided into Metropolitan Boroughs, plus the City of London which had the unique status of County Corporate. This file represents the system as it was used to report the 1911 Census of Population. To distinguish between identical place names with different administrative geographies, an Administrative County Boundaries layer may be used to add County name attributes to this layer. Statistical data and other information used in “A Vision of Britain through Time” can be accessed here: http://www.visionofbritain.org.uk/data.
Ward to Local Authority District (May 2022) Lookup in the UK
- geoportal.statistics.gov.uk
- data.europa.eu
- +1more
Updated Jul 19, 2022+ more versionsShareFacebookTwitterEmailClick to copy linkLink copiedCiteOffice for National Statistics (2022). Ward to Local Authority District (May 2022) Lookup in the UK [Dataset]. https://geoportal.statistics.gov.uk/documents/96172380bb7d429bac154d03bf35a651Dataset updatedJul 19, 2022Licensehttps://www.ons.gov.uk/methodology/geography/licenceshttps://www.ons.gov.uk/methodology/geography/licences
Area coveredDescriptionThis is a lookup file between electoral wards/divisions and local authority districts in the United Kingdom as at 5th May 2022. (File Size - 305 KB) Field Names - WD22CD, WD22NM, LAD22CD, LAD22NMField Types - Text, Text, Text, Text, Field Lengths - 9, 53, 9, 36
Standard Area Measurements for Administrative Areas (December 2022) in the...
- geoportal.statistics.gov.uk
- hub.arcgis.com
Updated Apr 5, 2023+ more versionsShareFacebookTwitterEmailClick to copy linkLink copiedCiteOffice for National Statistics (2023). Standard Area Measurements for Administrative Areas (December 2022) in the UK (V2) [Dataset]. https://geoportal.statistics.gov.uk/datasets/235c70d40c494361bd6b0ddaebdf0badDataset updatedApr 5, 2023Licensehttps://www.ons.gov.uk/methodology/geography/licenceshttps://www.ons.gov.uk/methodology/geography/licences
Area coveredDescriptionThis zip file contains the Standard Area Measurements (SAM) for the administrative areas in the United Kingdom as at 31 December 2022. This includes the wards, local authority districts, counties and regions in England and the countries. All measurements provided are ‘flat’ as they do not take into account variations in relief e.g. mountains and valleys. Measurements are given in hectares (10,000 square metres) to 2 decimal places. Four types of measurements are included: total extent (AREAEHECT), area to mean high water (coastline) (AREACHECT), area of inland water (AREAIHECT) and area to mean high water excluding area of inland water (land area) (AREALHECT). The Eurostat-recommended approach is to use the ‘land area’ measurement to compile population density figures.Change in the ward name W05001063 Pontlliew and Tircoed should have been called Pontlliw and Tircoed and we have made that change.This is a version 2 of the data as there was an error in the calculation of the Local Authorities, Counties, Regions, and CountriesClick the Download button to download the files
Population of England 2023, by county
- statista.com
Updated Oct 23, 2024ShareFacebookTwitterEmailClick to copy linkLink copiedCitePopulation of England 2023, by county [Dataset]. https://www.statista.com/statistics/971694/county-population-england/Dataset updatedOct 23, 2024Time period covered2023Area coveredUnited Kingdom, EnglandDescriptionIn 2023, almost nine million people lived in Greater London, making it the most populated ceremonial county in England. The West Midlands Metropolitan County, which contains the large city of Birmingham, was the second-largest county at 2.98 million inhabitants, followed by Greater Manchester and then West Yorkshire with populations of 2.95 million and 2.4 million, respectively. Kent, Essex, and Hampshire were the three next-largest counties in terms of population, each with around 1.89 million people. A patchwork of regions England is just one of the four countries that compose the United Kingdom of Great Britain and Northern Ireland, with England, Scotland and Wales making up Great Britain. England is therefore not to be confused with Great Britain or the United Kingdom as a whole. Within England, the next subdivisions are the nine regions of England, containing various smaller units such as unitary authorities, metropolitan counties and non-metropolitan districts. The counties in this statistic, however, are based on the ceremonial counties of England as defined by the Lieutenancies Act of 1997. Regions of Scotland, Wales, and Northern Ireland Like England, the other countries of the United Kingdom have their own regional subdivisions, although with some different terminology. Scotland’s subdivisions are council areas, while Wales has unitary authorities, and Northern Ireland has local government districts. As of 2022, the most-populated Scottish council area was Glasgow City, with over 622,000 inhabitants. In Wales, Cardiff had the largest population among its unitary authorities, and in Northern Ireland, Belfast was the local government area with the most people living there.
- e
Ministry of Housing and Local Government (MHLG) mineral planning permissions...
- data.europa.eu
- metadata.bgs.ac.uk
- +2more
htmlUpdated Apr 22, 2021+ more versionsShareFacebookTwitterEmailClick to copy linkLink copiedCiteBritish Geological Survey (BGS) (2021). Ministry of Housing and Local Government (MHLG) mineral planning permissions maps [Dataset]. https://data.europa.eu/data/datasets/ministry-of-housing-and-local-government-mhlg-mineral-planning-permissions-mapshtmlAvailable download formatsDataset updatedApr 22, 2021Dataset authored and provided byBritish Geological Survey (BGS)DescriptionThese are OS 1:25000 paper maps (approximately 1400) upon which the Ministry of Housing and Local Government (currently Department for Communities and Local Government (CLG)) recorded hand drawn boundaries for permitted, withdrawn and refused mineral planning permissions and worked ground for every local authority area in England. Accompanying the maps is an associated card index (see metadata for MHLG Cards). Priority was placed on areas that were given rise to then current casework issues thus, at the time when the maintenance of the maps ended some authority information had been updated recently but other areas had not been visited for many years. Therefore, the variable completeness of the data should be kept in mind when the material is being used. Both the maps and the card index have been used to create the digital mineral planning permissions polygons (see metadata for MHLG Planning Permission Polygons). Polygons for worked ground have not been captured.
Regional gross domestic product: local authorities
- ons.gov.uk
- cy.ons.gov.uk
xlsxUpdated Apr 24, 2024+ more versionsShareFacebookTwitterEmailClick to copy linkLink copiedCiteOffice for National Statistics (2024). Regional gross domestic product: local authorities [Dataset]. https://www.ons.gov.uk/economy/grossdomesticproductgdp/datasets/regionalgrossdomesticproductlocalauthoritiesxlsxAvailable download formatsDataset updatedApr 24, 2024LicenseOpen Government Licence 3.0http://www.nationalarchives.gov.uk/doc/open-government-licence/version/3/
License information was derived automaticallyDescriptionAnnual estimates of balanced UK regional gross domestic product (GDP). Current price estimates and chained volume measures for local authority districts, London boroughs, unitary authorities and Scottish Council areas.
- s
Parish to Ward to Local Authority District (December 2021) Lookup in EW (V2)...
- geoportal.statistics.gov.uk
- data.europa.eu
Updated Nov 25, 2021+ more versionsShareFacebookTwitterEmailClick to copy linkLink copiedCiteOffice for National Statistics (2021). Parish to Ward to Local Authority District (December 2021) Lookup in EW (V2) [Dataset]. https://geoportal.statistics.gov.uk/documents/9c327df79fe74c4eb935446f78711437Dataset updatedNov 25, 2021Dataset authored and provided byOffice for National StatisticsLicensehttps://www.ons.gov.uk/methodology/geography/licenceshttps://www.ons.gov.uk/methodology/geography/licences
Area coveredDescriptionThis is a lookup file between civil parishes/communities, electoral wards/divisions and local authorities/unitary authorities in England and Wales as at 31st December 2021. (File Size - 634 KB) Field Names - PAR21CD, PAR21NM, WD21CD, WD21NM, LAD21CD, LAD21NM, FIDField Types - Text, Text, Text, Text, Text, TextField Lengths - 9, 66, 9, 53, 9, 35FID = The FID, or Feature ID is created by the publication process when the names and codes / lookup products are published to the Open Geography portal. File updated to include changes to 3 parishes in North Northamptonshire following the late receipt of The Borough Council of Wellingborough (Reorganisation of Community Governance) Order 2019
- s
Local Government Districts of England and Wales, 1961
- searchworks.stanford.edu
zipUpdated Nov 28, 2021+ more versionsShareFacebookTwitterEmailClick to copy linkLink copiedCite(2021). Local Government Districts of England and Wales, 1961 [Dataset]. https://searchworks.stanford.edu/view/mm083kv1924zipAvailable download formatsDataset updatedNov 28, 2021Area coveredWales, EnglandDescriptionThese are digital boundaries for the system of districts essentially created by the 1894 Local Government Act and continuing to exist until 1974. England and Wales were divided into County Boroughs, Municipal Boroughs, Urban Districts and Rural Districts. These generally functioned as sub-divisions of Administrative Counties with powers varying according to status, but County Boroughs were large cities with full independence from their County. The County of London was divided into Metropolitan Boroughs, plus the City of London which had the unique status of County Corporate. This file represents the system as it was used to report the 1961 Census of Population. To distinguish between identical place names with different administrative geographies, an Administrative County Boundaries layer may be used to add County name attributes to this layer. Statistical data and other information used in “A Vision of Britain through Time” can be accessed here: http://www.visionofbritain.org.uk/data.
- K
United Kingdom Civil Parish and Community Boundaries
- koordinates.com
csv, dwg, geodatabase +6Updated Aug 29, 2003+ more versionsShareFacebookTwitterEmailClick to copy linkLink copiedCiteOrdnance Survey (OS) (2003). United Kingdom Civil Parish and Community Boundaries [Dataset]. https://koordinates.com/layer/114431-united-kingdom-civil-parish-and-community-boundaries/csv, dwg, geodatabase, shapefile, pdf, mapinfo mif, geopackage / sqlite, kml, mapinfo tabAvailable download formatsDataset updatedAug 29, 2003AuthorsOrdnance Survey (OS)Licensehttps://koordinates.com/license/open-government-license-3/https://koordinates.com/license/open-government-license-3/
Area coveredDescriptionParishes are subdivisions of local authorities in many parts of England, and their councils are the most local level of government. Unlike electoral wards/divisions however, parishes are not found in all parts of England. The Welsh equivalents are communities. Note that the full term for administrative parishes is 'civil parishes', to distinguish them from the ecclesiastical parishes which are found in all parts of the UK.
https://www.ordnancesurvey.co.uk/products/boundary-line#technical
Source:
https://osdatahub.os.uk/downloads/open/BoundaryLine
Licence:
Contains public sector information licensed under the Open Government Licence v3.0.
https://www.nationalarchives.gov.uk/doc/open-government-licence/version/3/
- W
Ministry of Housing and Local Government (MHLG) Mineral Planning Permission...
- cloud.csiss.gmu.edu
- metadata.bgs.ac.uk
- +3more
Updated Dec 26, 2019ShareFacebookTwitterEmailClick to copy linkLink copiedCiteUnited Kingdom (2019). Ministry of Housing and Local Government (MHLG) Mineral Planning Permission Polygons [Dataset]. https://cloud.csiss.gmu.edu/uddi/dataset/ministry-of-housing-and-local-government-mhlg-mineral-planning-permission-polygonsDataset updatedDec 26, 2019Dataset provided byUnited KingdomDescriptionDigital GIS mineral planning permission polygons from 1947 to 1985 as digitised from the Ministry of Housing and Local Government Planning Permission Maps and Cards (see associated metadata for MHLG Maps, Cards and Scanned Maps ). Data digitised included all planning permissions granted, withdrawn and refused for local authority areas for all of England. Currently 32,000 separate planning permission polygons have been captured from the maps and attributed using the associated card index.
- U
Borough Council Election Results 2014
- data.ubdc.ac.uk
- data.europa.eu
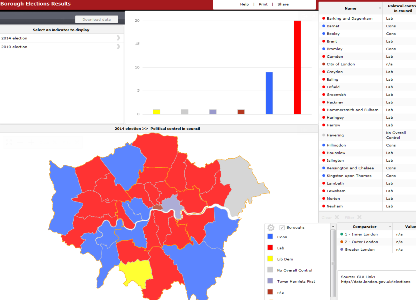
pdf, xlsUpdated Nov 8, 2023+ more versionsShareFacebookTwitterEmailClick to copy linkLink copiedCiteGreater London Authority (2023). Borough Council Election Results 2014 [Dataset]. https://data.ubdc.ac.uk/dataset/borough-council-election-results-2014xls, pdfAvailable download formatsDataset updatedNov 8, 2023Dataset provided byGreater London AuthorityDescription
This report includes a great deal of detail on every aspect of the 2014 London Borough council general elections. No other single volume presents the full results and election statistics from the 32 London boroughs enabling the reader to analyse and compare the results across London in one place. The report presents data for every candidate in every ward (excluding the City of London which operates on a different electoral model). The report also contains analysis of the European election results for London that took place on the same day.
Printed Copies
After much discussion, we are now able to accept orders for hard copies £30, but please note there is a minimum number of orders we must receive before it can be sent to print. Click here for further details.
Details of all previous elections reports in the series can be found here.
Summary results of the 2014 local elections in London, showing number and percentage of seats won, turnout and political control.
Final 2014 ward results
These results show the number of votes for each candidate in each ward in London. Turnout, number of ballots, postal votes, and breakdown of rejected votes, Mayoral and European voting figures are also included where available.
Map showing political control in each ward.
https://londondatastore-upload.s3.amazonaws.com/images/London-ward-map-borough-election-2014-new-colours-small.png" alt="">
Also, using these ward results, Oliver O'Brien from CASA has created some eye catching interactive ward maps.
The borough map shows the summary results in both the 2010 and 2014 elections.
The ward interactive map shows the detailed results for each candidate at ward level for the last three elections between 2006 and 2014.

This motion chart shows the relationship, between share of votes and seats won by the major parties in elections since 1964 at borough level (requires Adobe Flash Player).
 )
) - U
2011 Census Geography boundaries (Wards and Electoral Divisions)
- statistics.ukdataservice.ac.uk
zipUpdated Sep 20, 2022ShareFacebookTwitterEmailClick to copy linkLink copiedCiteBoundary (2022). 2011 Census Geography boundaries (Wards and Electoral Divisions) [Dataset]. https://statistics.ukdataservice.ac.uk/dataset/2011-census-geography-boundaries-wards-and-electoral-divisionszip(174707448), zip(338655660), zip(129161006), zip(328588), zip(125375563), zip(279347), zip(172098761), zip(328269596)Available download formatsDataset updatedSep 20, 2022Dataset provided byBoundaryLicensehttp://reference.data.gov.uk/id/open-government-licencehttp://reference.data.gov.uk/id/open-government-licence
DescriptionElectoral Wards/Divisions are the key building blocks of UK administrative geography. They are the spatial units used to elect local government councillors in metropolitan and non-metropolitan districts, unitary authorities and the London boroughs in England; unitary authorities in Wales; council areas in Scotland; and district council areas in Northern Ireland.
The Wards and Electoral Divisions list contains 9,481 areas of the following constituent geographies:
- 7,218 Census Wards in England
- 453 Census Electoral Divisions in England
- 7 Census Merged Wards in England
- 582 Census Wards in Northern Ireland
- 353 Census Wards in Scotland
- 856 Census Electoral Divisions in Wales
- 12 Census Merged Wards in Wales
Please visit ONS Beginner's Guide to UK Geography for more info.
The boundaries are available as either extent of the realm (usually this is the Mean Low Water mark but in some cases boundaries extend beyond this to include off shore islands) or
clipped to the coastline (Mean High Water mark).
FacebookTwitterhttps://www.ons.gov.uk/methodology/geography/licenceshttps://www.ons.gov.uk/methodology/geography/licences
A PDF map that shows the local authority districts, counties and unitary authorities in the United Kingdom as at April 2021. The map has been created to show the United Kingdom from country level down to local authority district level. (File Size - 1,969 KB)