Most used social networks 2025, by number of users
- statista.com
- abripper.com
- +2more
Updated Oct 16, 2025+ more versions Share
Share Facebook
 Twitter
 EmailClick to copy linkLink copiedCiteStatista (2025). Most used social networks 2025, by number of users [Dataset]. https://www.statista.com/statistics/272014/global-social-networks-ranked-by-number-of-users/Dataset updatedOct 16, 2025Area coveredWorldwideDescription
Market leader Facebook was the first social network to surpass one billion registered accounts and currently sits at more than three billion monthly active users. Meta Platforms owns four of the biggest social media platforms, all with more than one billion monthly active users each: Facebook (core platform), WhatsApp, Messenger, and Instagram. In the third quarter of 2023, Facebook reported around four billion monthly core Family product users. The United States and China account for the most high-profile social platforms Most top-ranked social networks with more than 100 million users originated in the United States, but services like Chinese social networks WeChat, QQ, or video-sharing app Douyin have also garnered mainstream appeal in their respective regions due to local context and content. Douyin’s popularity has led to the platform releasing an international version of its network, TikTok. How many people use social media? The leading social networks are usually available in multiple languages and enable users to connect with friends or people across geographical, political, or economic borders. In 2025, social networking sites are estimated to reach 5.44 billion users, and these figures are still expected to grow as mobile device usage and mobile social networks increasingly gain traction in previously underserved markets.
- m
Data from: A dataset of dynamical social map in ancient China: 618-1644
- data.mendeley.com
Updated Sep 30, 2022+ more versionsShareFacebookTwitterEmailClick to copy linkLink copiedCiteXiongfei Jiang (2022). A dataset of dynamical social map in ancient China: 618-1644 [Dataset]. http://doi.org/10.17632/vjyh3g8w2r.2Unique identifierhttps://doi.org/10.17632/vjyh3g8w2r.2Dataset updatedSep 30, 2022AuthorsXiongfei JiangLicenseAttribution 4.0 (CC BY 4.0)https://creativecommons.org/licenses/by/4.0/
License information was derived automaticallyDescriptionThe data set of this article is related to the paper "Dynamical structure of social map in ancient China" (2022, Physica A, https://doi.org/10.1016/j.physa.2022.128209) . This article demonstrates the data of social relations between cities in ancient China, ranging from 618 AD to 1644 AD. The raw data of social associations between elites used to build social maps are extracted from the China Biographical Database. The raw data contain 14610 elites and 29673 social associations, which cover 366 cities in China. The dataset of this article is relevant both for social and natural scientists interested in the social and economic history of ancient China. The data can be used for further insights/analyses on the evolutionary pattern of geo-social architecture, and the geo-history from the viewpoint of social network.
The dataset contains $3$ files: "Networks.xlsx", "Coordinates.xlsx", and "SocialMap.html". The "Networks.xlsx" has 3 columns, representing the source node (city), target node (city), and weight of a link between two nodes, respectively. The "Networks.xlsx" contains $9$ sheets, which are the data for different dynasties named by Early Tang, Late Tang, Early Northern-Song, Late Northern-Song, Early Southern-Song, Late Southern-Song, Yuan, Early Ming, and Late Ming. Noticeably, the "Networks.xlsx" can be visualized by the network software of Gephi directly. The "Coordinates.xlsx" has 4 columns storing longitude and latitude for all cities that appeared in 9 networks. The first and second columns are English names and Chinese names of cities; the third and fourth columns are longitudes and latitudes of cities. The "SocialMap.html" provides a visualization platform, in which users could select and illustrate the evolution of social maps intuitively.
- H
Replication Data for: Channels for Influence or Maps of Behavior? A Field...
- dataverse.harvard.edu
- search.dataone.org
Updated Nov 22, 2022ShareFacebookTwitterEmailClick to copy linkLink copiedCitePaul Atwell; Noah L. Nathan (2022). Replication Data for: Channels for Influence or Maps of Behavior? A Field Experiment on Social Networks and Cooperation [Dataset]. http://doi.org/10.7910/DVN/O059HNCroissantCroissant is a format for machine-learning datasets. Learn more about this at mlcommons.org/croissant.Unique identifierhttps://doi.org/10.7910/DVN/O059HNDataset updatedNov 22, 2022Dataset provided byHarvard DataverseAuthorsPaul Atwell; Noah L. NathanLicensehttps://dataverse.harvard.edu/api/datasets/:persistentId/versions/1.1/customlicense?persistentId=doi:10.7910/DVN/O059HNhttps://dataverse.harvard.edu/api/datasets/:persistentId/versions/1.1/customlicense?persistentId=doi:10.7910/DVN/O059HN
DescriptionCommunities in developing countries often must cooperate to self-provide or co-produce local public goods. Many expect that community social networks facilitate this cooperation, but few studies directly observe real-life networks in these settings. We collect detailed social network data in rural Northern Ghana to explore how social positions and proximity to community leaders predict donations to a local public good. We then implement a field experiment manipulating participants’ opportunity to communicate and apply social pressure before donating. We find clear evidence that locations in community social networks predict cooperative behavior, but no evidence that communication improves coordination or cooperation, in contrast to common theoretical expectations and laboratory findings. Our results show that evolved, real-life social networks serve as a mapping of community members’ already-engrained behaviors, not only as an active technology through which social influence propagates to solve collective action problems.
🇺🇸 Donald Trump Social Network
- kaggle.com
zipUpdated Jul 19, 2024ShareFacebookTwitterEmailClick to copy linkLink copiedCitemexwell (2024). 🇺🇸 Donald Trump Social Network [Dataset]. https://www.kaggle.com/datasets/mexwell/donald-trump-social-networkzip(20545 bytes)Available download formatsDataset updatedJul 19, 2024AuthorsmexwellDescriptionSource
This folder contains network data for relationships between President Donald Trump and other people, which was originally compiled by John Templon, Anthony Cormier, Alex Campbell, and Jeremy Singer-Vine as part of a larger project of mapping "TrumpWorld" for BuzzFeed News.
The full dataset, which you can access as a Google Sheet or on GitHub also includes information about organizations and agencies. The data was compiled by culling from "public records, news reports, and other sources on the Trump family, his Cabinet picks, and top advisers," as well as via crowdsourced tips and information from the public (if you have any more, you can contribute them here).
Data & Methodology
Nodes: 303; unimodal
Edges: 366; unweighted; undirected
The nodes csv contains 303 different people, and the edges csv contains 366 unweighted relationships between those people, such as friendship, business partner, donor, parent/child, cabinet member, spouse, and more. This information about the relationships, along with the sources from which they were identified, is included as a column (and potential attribute) in the edges csv.
As stated above, the data was compiled by culling from "public records, news reports, and other sources on the Trump family, his Cabinet picks, and top advisers," as well as via crowdsourced tips.
*In order to make this data more accessible for basic social network analysis, I have condensed the network to only the top 303 most connected people in TrumpWorld.
Background & Significance
The relationships between President Donald Trump and other people lend themselves well to basic social network analysis because, as Templon, Cormier, Campbell, and Singer-Vine suggest, "No American president has taken office with a giant network of businesses, investments, and corporate connections like that amassed by Donald J. Trump."
Further, the social network analysis of some of the most powerful people in the nation and the world might help contribute to what Lauren Klein called for at the end of her 2018 MLA talk "Distant Reading After Moretti"--that is, computational analysis "trained on power."
Acknowlegement
Foto von Marco Zuppone auf Unsplash
- N
Neural Tracking of Social Hierarchies in Adolescents’ Real-World Social...
- neurovault.org
zipUpdated Aug 1, 2023+ more versionsShareFacebookTwitterEmailClick to copy linkLink copiedCite(2023). Neural Tracking of Social Hierarchies in Adolescents’ Real-World Social Networks [Dataset]. http://identifiers.org/neurovault.collection:12781zipAvailable download formatsUnique identifierhttps://identifiers.org/neurovault.collection:12781Dataset updatedAug 1, 2023LicenseCC0 1.0 Universal Public Domain Dedicationhttps://creativecommons.org/publicdomain/zero/1.0/
License information was derived automaticallyArea coveredWorldDescriptionA collection of 10 brain maps. Each brain map is a 3D array of values representing properties of the brain at different locations.
Collection description
This collection contains the images from the paper titled "Neural Tracking of Social Hierarchies in Adolescents’ Real-World Social Networks" by Junqiang Dai, Nathan A. Jorgensen, Natasha Duell, Jimmy Capella, Maria Maza, Seh-Joo Kwon, Mitchell J. Prinstein, Kristen A. Lindquist, Eva H. Telzer* (ehtelzer@unc.edu). We combined sociometric nomination and neuroimaging techniques to investigate how adolescents' brains keep track of their emerging peer-based social hierarchies. Uploaded data includes results from whole-brain analyses (i.e., high peer status, low peer status, high vs. low peer status) and conjunction analysis (i.e., the neural representation of high and low peer status). This manuscript is currently submitted to Social Affective Cognitive Neuroscience.
Data from: Board of Directors’ Interlocks: A Social Network Analysis...
- scielo.figshare.com
tiffUpdated Jun 17, 2023ShareFacebookTwitterEmailClick to copy linkLink copiedCiteClaudine Pereira Salgado; Vivian Sebben Adami; Jorge R. de Souza Verschoore Filho; Cristiano Machado Costa (2023). Board of Directors’ Interlocks: A Social Network Analysis Tutorial [Dataset]. http://doi.org/10.6084/m9.figshare.21556978.v1tiffAvailable download formatsUnique identifierhttps://doi.org/10.6084/m9.figshare.21556978.v1Dataset updatedJun 17, 2023AuthorsClaudine Pereira Salgado; Vivian Sebben Adami; Jorge R. de Souza Verschoore Filho; Cristiano Machado CostaLicenseAttribution 4.0 (CC BY 4.0)https://creativecommons.org/licenses/by/4.0/
License information was derived automaticallyDescriptionABSTRACT Objective: the literature on board interlocks has increased in recent years, focusing on understanding board composition and its relationships with other companies’ boards. Such studies usually require multiple procedures of data extraction, handling, and analysis to create and analyze social networks. However, these procedures are not standardized, and there is a lack of methodological instructions available to make this process easier for researchers. This tutorial intends to describe the logical steps taken to collect data, treat them, and map and measure the network properties to provide researchers with the sources to replicate it in their own research. We contribute to the literature in the management field by proposing an empirical methodological approach to conduct board interlocks’ research. Proposal: our tutorial describes and provides examples of data collection, directors’ data treatment, and the use of these data to map and measure network structural properties using an open-source tool - R statistical software. Conclusions: our main contribution is a tutorial detailing the steps required to map and analyze board interlocks, making this process easier, standardized, and more accessible for all researchers who wish to develop social network analysis studies.
- f
SNA metrics.
- plos.figshare.com
xlsUpdated Sep 2, 2025+ more versionsShareFacebookTwitterEmailClick to copy linkLink copiedCiteTroy Francis; Maaike de Vries; Mark Fan; Reza Yousefi-Nooraie; Mathieu Ouimet; Valeria E. Rac; Patricia Trbovich (2025). SNA metrics. [Dataset]. http://doi.org/10.1371/journal.pone.0329176.t001xlsAvailable download formatsUnique identifierhttps://doi.org/10.1371/journal.pone.0329176.t001Dataset updatedSep 2, 2025Dataset provided byPLOS ONEAuthorsTroy Francis; Maaike de Vries; Mark Fan; Reza Yousefi-Nooraie; Mathieu Ouimet; Valeria E. Rac; Patricia TrbovichLicenseAttribution 4.0 (CC BY 4.0)https://creativecommons.org/licenses/by/4.0/
License information was derived automaticallyDescriptionDue to a lack of safeguards, controlled substances (CS) can be diverted (stolen) from healthcare facilities. While it is known that healthcare workers (HCWs) can use their social networks within the medication use process (MUP) to facilitate diversion, the specific connections between HCWs and the MUP tasks most vulnerable to diversion remain poorly understood. Social network analysis (SNA) was used to analyze social connections to identify influential relationships between HCWs and tasks susceptible to diversion.To map the social network structures of MUP tasks vulnerable to CS diversion in two Emergency Departments (EDs), identify influential tasks and HCWs, and report HCW perceptions of in-hospital diversion.This study used a mixed methods approach in the ED of two large hospitals in Toronto, Canada. Previously collected clinical observation data was used to identify tasks at risk of diversion, and cross-sectional surveys were conducted to assess HCW’s involvement in the identified vulnerable tasks. A two-mode SNA was conducted to identify connections between HCWs and tasks susceptible to drug diversion.SNA identified a circular structure across both sites, highlighting the network’s redundancy and capacity to efficiently disseminate information. Nurses were central to tasks with a higher risk of diversion. Physicians and Pharmacists had limited direct involvement in these tasks. Tasks with frequent interprofessional interactions, such as creating, following, or reviewing orders for non-admitted patients, are vulnerable to diversion due to HCWs acting on decisions made by other professionals without closely scrutinizing the details. No significant differences were observed between sites, suggesting a shared perception of diversion. The SNA results highlight the critical role of network structure in shaping vulnerability to diversion. The similarities across both sites suggest a systemic challenge across ED settings that require targeted interventions. By uncovering critical points of influence, we can better understand how diversion occurs and develop targeted interventions to prevent it.
- Z
Data from: SMDRM - Social Media for Disaster Risk Management
- data.niaid.nih.gov
Updated Mar 28, 2022ShareFacebookTwitterEmailClick to copy linkLink copiedCiteLorini Valerio; Salamon Peter; Castillo Carlos (2022). SMDRM - Social Media for Disaster Risk Management [Dataset]. https://data.niaid.nih.gov/resources?id=zenodo_6351658Dataset updatedMar 28, 2022Dataset provided byEuropean CommissionAuthorsLorini Valerio; Salamon Peter; Castillo CarlosLicensehttps://joinup.ec.europa.eu/page/eupl-text-11-12https://joinup.ec.europa.eu/page/eupl-text-11-12
DescriptionSMDRM - Social Media for Disaster Risk Management
Social media has been described as a form of distributed cognition, a mechanism for understanding a situation using information spread across many minds. The interactions among people in social media are a form of collective intelligence, as they allow people to make sense of a developing event collectively. Social media users can contribute to creating a "sensor" for citizen-generated data that modelling or monitoring systems can assimilate during a crisis. Gaining situational awareness in a disaster is critical and time-sensitive. Social media presents the possibilities of a growing data source to help improve response in the early hours and days of a crisis. However, social media platforms may not provide the functionality of summarising the information that is useful for crisis responders.SMDRM is a software platform that streamlines the processing of text and images extracted from Twitter in near real-time during a specific event. The data is collected using a combination of keywords and locations based on daily forecasts from the early warnings systems of the Copernicus Emergency Management Service such as EFAS, GloFAS and EFFIS (emergency.copernicus.eu) or triggered manually in case of earthquakes or not-forecasted events. Text is automatically "annotated" using a binary multilingual classifier trained on 12 languages and extended with multilingual embeddings. Simultaneously, a multi-class convolutional neural network labels relevant images for floods, storms, earthquakes and fires. The information that doesn't embed coordinates is geolocated in a two-step algorithm where location candidates are first selected using a multilingual named-entity recognition tool and then searched on available gazetteers. The last step of the SMDRM data processing is the aggregation of relevant information in spatial (administrative areas) and temporal (daily) units. Social media activity about an event can finally be distributed as a data map and visualised on a map server and made available to users.SMDRM could offer timely information useful for reducing the hazard models' uncertainty and providing added-value information such as reports or descriptions of the situation on the ground or in the vicinity. Other stakeholders, such as research groups could access new data to complement the ones extracted from traditional sensors or earth observation. The platform can adapt to cope with the varying workload as it uses scalable software containers. If the number of tweets is higher during an impactful event, the platform can use more containers to annotate them. SMDR code, together with the tens of thousands of annotated social media messages used for training its models, will be released as an open-source platform whose modules can be adapted to serve other research projects. We describe the platform's architecture and implementation details, and two use cases where images and text were used as a use-case to test the system's modules.
Source https://ui.adsabs.harvard.edu/abs/2021EGUGA..2315012L/abstract
NYC STEW-MAP Staten Island organizations' website hyperlink webscrape
- catalog.data.gov
- s.cnmilf.com
Updated Nov 21, 2022ShareFacebookTwitterEmailClick to copy linkLink copiedCiteU.S. EPA Office of Research and Development (ORD) (2022). NYC STEW-MAP Staten Island organizations' website hyperlink webscrape [Dataset]. https://catalog.data.gov/dataset/nyc-stew-map-staten-island-organizations-website-hyperlink-webscrapeDataset updatedNov 21, 2022Area coveredNew York, Staten IslandDescriptionThe data represent web-scraping of hyperlinks from a selection of environmental stewardship organizations that were identified in the 2017 NYC Stewardship Mapping and Assessment Project (STEW-MAP) (USDA 2017). There are two data sets: 1) the original scrape containing all hyperlinks within the websites and associated attribute values (see "README" file); 2) a cleaned and reduced dataset formatted for network analysis. For dataset 1: Organizations were selected from from the 2017 NYC Stewardship Mapping and Assessment Project (STEW-MAP) (USDA 2017), a publicly available, spatial data set about environmental stewardship organizations working in New York City, USA (N = 719). To create a smaller and more manageable sample to analyze, all organizations that intersected (i.e., worked entirely within or overlapped) the NYC borough of Staten Island were selected for a geographically bounded sample. Only organizations with working websites and that the web scraper could access were retained for the study (n = 78). The websites were scraped between 09 and 17 June 2020 to a maximum search depth of ten using the snaWeb package (version 1.0.1, Stockton 2020) in the R computational language environment (R Core Team 2020). For dataset 2: The complete scrape results were cleaned, reduced, and formatted as a standard edge-array (node1, node2, edge attribute) for network analysis. See "READ ME" file for further details. References: R Core Team. (2020). R: A language and environment for statistical computing. R Foundation for Statistical Computing, Vienna, Austria. URL https://www.R-project.org/. Version 4.0.3. Stockton, T. (2020). snaWeb Package: An R package for finding and building social networks for a website, version 1.0.1. USDA Forest Service. (2017). Stewardship Mapping and Assessment Project (STEW-MAP). New York City Data Set. Available online at https://www.nrs.fs.fed.us/STEW-MAP/data/. This dataset is associated with the following publication: Sayles, J., R. Furey, and M. Ten Brink. How deep to dig: effects of web-scraping search depth on hyperlink network analysis of environmental stewardship organizations. Applied Network Science. Springer Nature, New York, NY, 7: 36, (2022).
Indie Map
- kaggle.com
- data.wu.ac.at
zipUpdated Jul 1, 2017ShareFacebookTwitterEmailClick to copy linkLink copiedCiteRyan (2017). Indie Map [Dataset]. https://www.kaggle.com/snarfed/indiemapzip(19873006 bytes)Available download formatsDataset updatedJul 1, 2017AuthorsRyanLicensehttps://creativecommons.org/publicdomain/zero/1.0/https://creativecommons.org/publicdomain/zero/1.0/
DescriptionThe IndieWeb is a people-focused alternative to the "corporate" web. Participants use their own personal web sites to post, reply, share, organize events and RSVP, and interact in online social networking in ways that have otherwise been limited to centralized silos like Facebook and Twitter.
The Indie Map dataset is a social network of the 2300 most active IndieWeb sites, including all connections between sites and number of links in each direction, broken down by type. It includes:
- 5.8M web pages, including raw HTML, parsed microformats2, and extracted links with metadata.
- 631M links and 706K "friend" relationships between sites.
- 380GB of HTML and HTTP requests in WARC format.
The zip file here contains a JSON file for each site, which includes metadata, a list of other sites linked to and from, and the number of links of each type.
The complete dataset of 5.8M HTML pages is available in a publicly accessible Google BigQuery dataset. The raw pages can also be downloaded as WARC files. They're hosted on Google Cloud Storage.
More details in the full documentation.
Indie Map is free, open source, and placed into the public domain via CC0. Crawled content remains the property of each site's owner and author, and subject to their existing copyrights.
- N
Neural Tracking of Social Hierarchies in Adolescents’ Real-World Social...
- neurovault.org
niftiUpdated Apr 17, 2023+ more versionsShareFacebookTwitterEmailClick to copy linkLink copiedCite(2023). Neural Tracking of Social Hierarchies in Adolescents’ Real-World Social Networks: Low Popularity with Parametric Modulators [Dataset]. http://identifiers.org/neurovault.image:795927niftiAvailable download formatsUnique identifierhttps://identifiers.org/neurovault.image:795927Dataset updatedApr 17, 2023LicenseCC0 1.0 Universal Public Domain Dedicationhttps://creativecommons.org/publicdomain/zero/1.0/
License information was derived automaticallyDescription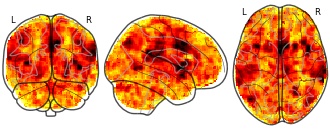
Collection description
This collection contains the images from the paper titled "Neural Tracking of Social Hierarchies in Adolescents’ Real-World Social Networks" by Junqiang Dai, Nathan A. Jorgensen, Natasha Duell, Jimmy Capella, Maria Maza, Seh-Joo Kwon, Mitchell J. Prinstein, Kristen A. Lindquist, Eva H. Telzer* (ehtelzer@unc.edu). We combined sociometric nomination and neuroimaging techniques to investigate how adolescents' brains keep track of their emerging peer-based social hierarchies. Uploaded data includes results from whole-brain analyses (i.e., high peer status, low peer status, high vs. low peer status) and conjunction analysis (i.e., the neural representation of high and low peer status). This manuscript is currently submitted to Social Affective Cognitive Neuroscience.
Subject species
homo sapiens
Modality
fMRI-BOLD
Analysis level
group
Cognitive paradigm (task)
face n-back task
Map type
Z
Public Information (Mature)
- cityofdentongishub-dentontxgis.hub.arcgis.com
Updated Mar 5, 2014ShareFacebookTwitterEmailClick to copy linkLink copiedCiteesri_en (2014). Public Information (Mature) [Dataset]. https://cityofdentongishub-dentontxgis.hub.arcgis.com/items/f01baaccb4b84bcbb9ac0810e717cae3Dataset updatedMar 5, 2014Authorsesri_enDescriptionPublic Information is a configurable app template that highlights areas through authoritative data feeds and social content, allowing the public to contribute to your map. Use CasesEnhance your map by overlaying social media feeds on your operational layers. Displays geotagged social media contributions to understand what is trending through these networks centered on your theme and location. This is a good choice when you want to assess local sentiment on current events.Use a swipe tool to hide and reveal a layer within your map. This is a good choice for inspecting the difference between two scenarios. For example, you could show the difference between current sea level and a projected rise in sea level, or visualize an area before and after a tornado where the map view may want to closely inspect the difference between the scenarios at a large scale.Configurable OptionsPublic Information present content from a web map with social media feeds and can be configured using the following options:Provide a title and description, as well as configure a custom splash screen that displays when the app is first loaded.Set up an interactive layer for taking notes. This is a map notes layer contained in the web map.Enable a swipe layer and choose between vertical or horizontal orientation.Determine a default and alternate basemap to be offered in an on screen basemap widget.Enable layers to be generated via content from Instagram, Flickr, Twitter, Webcams.travel, and YouTube.Configure the ability for feature and location search.Enable or disable many UI and mapping configurable options such as overview map, bookmarks, share dialog, legend, summary information, views count, modified date, etc.Supported DevicesThis application is responsively designed to support use in browsers on desktops, mobile phones, and tablets.Data RequirementsThis application has no data requirements.Get Started This application can be created in the following ways:Click the Create a Web App button on this pageShare a map and choose to Create a Web AppOn the Content page, click Create - App - From Template Click the Download button to access the source code. Do this if you want to host the app on your own server and optionally customize it to add features or change styling.
🚀 Star Wars Network
- kaggle.com
zipUpdated Oct 7, 2024ShareFacebookTwitterEmailClick to copy linkLink copiedCitemexwell (2024). 🚀 Star Wars Network [Dataset]. https://www.kaggle.com/datasets/mexwell/star-wars-networkzip(2697 bytes)Available download formatsDataset updatedOct 7, 2024AuthorsmexwellDescriptionThe Star Wars Network dataset provides a unique opportunity for social network analysis using characters from the Star Wars universe. The dataset comprises two CSV files:
starwars-characters.csv: Contains a list of characters with the following columns:
- number: Unique identifier for each character.
- name: The name of the character.
- scenes: Number of scenes in which the character appears.
starwars-links.csv: Captures the interactions between characters with the following columns:
- character1: Name or ID of the first character.
- character2: Name or ID of the second character.
- scenes: Number of scenes in which both characters appear together.
This dataset is well-suited for building a social network graph that maps out character interactions and relationships based on their shared screen time. With this data, users can explore centrality measures, identify communities, and visualize the network structure of character interactions in the Star Wars universe.
Original data can be found here
Acknowledgement
Foto von Lyman Hansel Gerona auf Unsplash
- Z
Data from: Dataset of the study "Think globally, act locally": A glocal...
- data-staging.niaid.nih.gov
- data.niaid.nih.gov
- +1more
Updated May 20, 2020ShareFacebookTwitterEmailClick to copy linkLink copiedCiteStefania Manca; Stefania Bocconi; Benjamin Gleason (2020). Dataset of the study "Think globally, act locally": A glocal approach to old and new literacies for social media skills [Dataset]. https://data-staging.niaid.nih.gov/resources?id=zenodo_3835986Dataset updatedMay 20, 2020Dataset provided byInstitute of Educational Technology - National Research Council of Italy
School of Education, Iowa State UniversityAuthorsStefania Manca; Stefania Bocconi; Benjamin GleasonLicenseAttribution 4.0 (CC BY 4.0)https://creativecommons.org/licenses/by/4.0/
License information was derived automaticallyDescriptionThis Zenodo item contains the dataset of the study: Manca, S., Bocconi, S., & Gleason, B. (2020). “Think globally, act locally”. A glocal approach to old and new literacies for social media skills. Computers & Education.
Abstract
Despite the documented number of studies that investigate social media in teaching and learning settings, the topic of social media literacy is still an under-researched area. This study adopts the theoretical lens of New Literacy studies to suggest a combined perspective for investigating social media literacies. This perspective considers both social media skills that are transversal across different social media (global skills) or that pertain to a specific social media platform (local skills). It examines practices that are decontextualized (literacy as something to be acquired) or situated and context-dependent (literacy through participation). To map current research on social media skills, a systematic literature review was conducted. Analysis of 54 publications was carried out following the UNESCO DLGF framework for digital literacy competencies, and also using a critical lens based on four metaphors whereby, for learning purposes, social media are seen as a tool, as a process, as collaboration, and as participation. The results show that most of the studies consider global social media skills, while only a few examine skills sets specific to a particular social media platform. Besides, most of the identified skills concern decontextualized practices, with very few studies emphasizing the importance of fostering situated social media practices. We conclude that there is a need for more expansive theoretical elaboration in the field, and provide a number of recommendations for investigating, understanding, and designing educational curricula and activities that support the development of social media literacy.
- n
Data from: Chatty maps: constructing sound maps of urban areas from social...
- data.niaid.nih.gov
- datadryad.org
zipUpdated Feb 29, 2016ShareFacebookTwitterEmailClick to copy linkLink copiedCiteLuca Maria Aiello; Rossano Schifanella; Daniele Quercia; Francesco Aletta (2016). Chatty maps: constructing sound maps of urban areas from social media data [Dataset]. http://doi.org/10.5061/dryad.tg735zipAvailable download formatsUnique identifierhttps://doi.org/10.5061/dryad.tg735Dataset updatedFeb 29, 2016Dataset provided byUniversity of Sheffield
Bell Labs, Cambridge, UK
Yahoo Labs, London, UK
University of TurinAuthorsLuca Maria Aiello; Rossano Schifanella; Daniele Quercia; Francesco AlettaLicensehttps://spdx.org/licenses/CC0-1.0.htmlhttps://spdx.org/licenses/CC0-1.0.html
DescriptionUrban sound has a huge influence over how we perceive places. Yet, city planning is concerned mainly with noise, simply because annoying sounds come to the attention of city officials in the form of complaints, whereas general urban sounds do not come to the attention as they cannot be easily captured at city scale. To capture both unpleasant and pleasant sounds, we applied a new methodology that relies on tagging information of georeferenced pictures to the cities of London and Barcelona. To begin with, we compiled the first urban sound dictionary and compared it with the one produced by collating insights from the literature: ours was experimentally more valid (if correlated with official noise pollution levels) and offered a wider geographical coverage. From picture tags, we then studied the relationship between soundscapes and emotions. We learned that streets with music sounds were associated with strong emotions of joy or sadness, whereas those with human sounds were associated with joy or surprise. Finally, we studied the relationship between soundscapes and people's perceptions and, in so doing, we were able to map which areas are chaotic, monotonous, calm and exciting. Those insights promise to inform the creation of restorative experiences in our increasingly urbanized world.
- m
Data for: FIFA: Finding Important Features Automatically for predicting...
- data.mendeley.com
Updated May 21, 2020ShareFacebookTwitterEmailClick to copy linkLink copiedCiteKaveh Kadkhoda Mohammadmosaferi (2020). Data for: FIFA: Finding Important Features Automatically for predicting community evolution in dynamic social networks [Dataset]. http://doi.org/10.17632/67pypfbfjr.1Unique identifierhttps://doi.org/10.17632/67pypfbfjr.1Dataset updatedMay 21, 2020AuthorsKaveh Kadkhoda MohammadmosaferiLicenseCC0 1.0 Universal Public Domain Dedicationhttps://creativecommons.org/publicdomain/zero/1.0/
License information was derived automaticallyDescriptionTime segmentation DBLP dataset is divided into eleven time windows (time span 01/01/2003 to 31/12/2013). Facebook Wall Posts dataset is divided into eight time windows (time span 01/01/2005 to 31/12/2008). Wiki-Talk dataset is segmented into six time windows (time span 24/11/2007 to 31/12/2007). Enron email dataset is segmented into twelve time windows (time span 01/01/2001 to 31/12/2001). Reddit-reply dataset is segmented into six time windows (time span 07/01/2014 to 13/01/2014). Stack Overflow dataset is segmented into six time windows (time span 24/01/2016 to 29/02/2016).
Social group discovery Communities of each time window are discovered using Infomap, Label Propagation, and Leiden algorithms. For running the community detection algorithms, we assume that the datasets are undirected and unweighted graphs. The communities whose size was smaller than two members were ignored.
Community evolution tracking and chain identification In order to track community evolution, we investigate each community to find its similar community or communities from previous time windows, which is called community matching. We employed ICEM (Identification of Community Evolution by Mapping) (Kadkhoda Mohammadmosaferi & Naderi, 2020) method in order to determine the evolution events because it is a highly efficient approach to track community evolution and considers partial evolution and non-consecutive time windows. ICEM has two parameters which are α and β, in this paper, the thresholds for being partially similar and very similar are set to α=10% and β=90%, respectively.
Each uploaded dataset contains chains of evolution for a community detection algorithm.
Reference: Kadkhoda Mohammadmosaferi, K., Naderi, H., 2020. Evolution of communities in dynamic social networks: An efficient map-based approach. Expert Syst. Appl. 147, 113221.
A global map of human presence in 2017
- data.niaid.nih.gov
Updated Dec 17, 2024ShareFacebookTwitterEmailClick to copy linkLink copiedCiteLuo, Peixian; Yi, Jiawei; Du, Yunyan; Huang, Sheng; Wang, Nan; Tu, Wenna; Hu, Dingchen; Wei, Haitao (2024). A global map of human presence in 2017 [Dataset]. https://data.niaid.nih.gov/resources?id=zenodo_8172734Dataset updatedDec 17, 2024Dataset provided byInstitute of Geographic Sciences and Natural Resources Research
College of Resources Tai'an, Shandong University of Science and Technology - Taian Campus, Taian 271019, ChinaAuthorsLuo, Peixian; Yi, Jiawei; Du, Yunyan; Huang, Sheng; Wang, Nan; Tu, Wenna; Hu, Dingchen; Wei, HaitaoLicenseAttribution 4.0 (CC BY 4.0)https://creativecommons.org/licenses/by/4.0/
License information was derived automaticallyDescriptionUnderstanding global patterns of human presence is crucial for monitoring anthropogenic pressures on ecological integrity, optimizing tourism management, and informing decision-making in various domains. However, existing datasets on human presence are insufficient and primarily limited to local scales.
We combined massive geotagged microblogs and multi-covariates to infer the global human presence in 2017 at a fine spatial resolution of 0.01 degrees. Specifically, we proposed a Human Presence Indicator (HPI) to quantify human presence. It categorizes the intensity of human presence at a location in four levels based on year-long statistics of geotagged data. HPI-0, HPI-1, HPI-2, and HPI-3 represent no human presence, occasional/frequent/sustained human presence, respectively.
The model achieved a macro-F1 score of 0.72 on a test set comprising over 1.9 million grids in China and 0.84 on manually labeled samples worldwide. Cross-validation with external datasets, including geotagged social media data from X and global human settlement and population data, corroborated the model's effectiveness.
The related article is currently under review.
- G
Social Network Analysis Tools Market Research Report 2033
- growthmarketreports.com
csv, pdf, pptxUpdated Aug 22, 2025ShareFacebookTwitterEmailClick to copy linkLink copiedCiteGrowth Market Reports (2025). Social Network Analysis Tools Market Research Report 2033 [Dataset]. https://growthmarketreports.com/report/social-network-analysis-tools-marketcsv, pdf, pptxAvailable download formatsDataset updatedAug 22, 2025Dataset authored and provided byGrowth Market ReportsTime period covered2024 - 2032Area coveredGlobalDescriptionSocial Network Analysis Tools Market Outlook
According to our latest research, the global Social Network Analysis Tools market size reached USD 3.2 billion in 2024, demonstrating a robust expansion driven by the growing need for advanced analytics in digital ecosystems. The market is projected to grow at a compound annual growth rate (CAGR) of 19.4% from 2025 to 2033, reaching an estimated USD 15.1 billion by 2033. This impressive growth is primarily fueled by the increasing adoption of data-driven decision-making across enterprises, the surge in social media penetration, and the critical demand for actionable insights from vast networks of digital interactions.
One of the primary growth factors for the Social Network Analysis Tools market is the exponential rise in digital data generated across social platforms. Organizations are increasingly leveraging these tools to extract meaningful patterns, trends, and relationships from complex and unstructured data sets. The proliferation of social media users, coupled with the integration of artificial intelligence and machine learning technologies, has enabled businesses to gain deeper insights into consumer behavior, sentiment analysis, and emerging trends. Furthermore, the growing importance of customer engagement and personalized marketing strategies is compelling enterprises to invest in sophisticated social network analysis solutions to maintain a competitive edge in dynamic markets.
Another significant driver is the escalating need for risk management and fraud detection in various sectors, including BFSI, healthcare, and government. As cyber threats and fraudulent activities become more sophisticated, organizations are turning to social network analysis tools to monitor, detect, and prevent suspicious behavior within vast digital communities. The ability of these tools to map relationships, identify influential nodes, and uncover hidden connections has proven invaluable in mitigating risks and ensuring compliance with regulatory standards. This has led to increased adoption across sectors where data security and integrity are paramount, further accelerating market growth.
Moreover, the shift towards remote work and digital collaboration has amplified the demand for workforce management solutions powered by social network analysis. Enterprises are utilizing these tools to assess employee engagement, identify knowledge hubs, and optimize internal communication networks. By visualizing organizational structures and informal networks, companies can enhance productivity, foster innovation, and address workforce challenges more effectively. The integration of social network analysis into human resource management and organizational development strategies is expected to remain a key growth catalyst for the market in the coming years.
Regionally, North America continues to dominate the Social Network Analysis Tools market, accounting for the largest revenue share in 2024. This dominance can be attributed to the presence of major technology providers, high digital adoption rates, and a mature analytics landscape. However, the Asia Pacific region is anticipated to witness the fastest growth during the forecast period, driven by rapid digitalization, expanding social media user base, and increasing investments in advanced analytics infrastructure. Europe also holds a significant market share, supported by stringent data privacy regulations and a strong focus on innovation and research. Latin America and the Middle East & Africa are gradually emerging as promising markets, fueled by growing awareness and digital transformation initiatives.
Component Analysis
The Social Network Analysis Tools market by component is bifurcated into Software and Services, each playing a crucial role in addressing the diverse needs of end-users. The software segment comprises standalone platforms and integrated solutions that enable users to visualize, analyze, and interpret complex social networks. These software offeri Social media articles dataset - article titles and links
- zenodo.org
zipUpdated Dec 18, 2021ShareFacebookTwitterEmailClick to copy linkLink copiedCiteKristóf Gyódi; Kristóf Gyódi; Łukasz Nawaro; Łukasz Nawaro; Michał Paliński; Michał Paliński (2021). Social media articles dataset - article titles and links [Dataset]. http://doi.org/10.5281/zenodo.5789701zipAvailable download formatsUnique identifierhttps://doi.org/10.5281/zenodo.5789701Dataset updatedDec 18, 2021AuthorsKristóf Gyódi; Kristóf Gyódi; Łukasz Nawaro; Łukasz Nawaro; Michał Paliński; Michał PalińskiLicenseAttribution 4.0 (CC BY 4.0)https://creativecommons.org/licenses/by/4.0/
License information was derived automaticallyDescriptionThis dataset contains the raw results of topic mapping presented at ngi.https://ngitopics.delabapps.eu.
The dataset includes the title and link to the collected article, as well as the location on the map.
There is a separate dataset for each analysed map: six umbrella topics + 6 regions
For details on data collection and methodology see: https://ngitopics.delabapps.eu/report.pdf and https://ngitopics.delabapps.eu/report_multilanguage.pdf
- N
Neural Tracking of Social Preference in Adolescents’ Real-World Social...
- neurovault.org
Updated Mar 17, 2023+ more versionsShareFacebookTwitterEmailClick to copy linkLink copiedCite(2023). Neural Tracking of Social Preference in Adolescents’ Real-World Social Networks: Low status Peer with PM [Dataset]. http://identifiers.org/neurovault.image:794929Unique identifierhttps://identifiers.org/neurovault.image:794929Dataset updatedMar 17, 2023LicenseCC0 1.0 Universal Public Domain Dedicationhttps://creativecommons.org/publicdomain/zero/1.0/
License information was derived automaticallyDescriptionSPM{T_[116]} - computed with APS Estimate
Collection description
This collection contains the images from the paper titled "Neural Tracking of Social Hierarchies in Adolescents’ Real-World Social Networks" by Junqiang Dai, Nathan A. Jorgensen, Natasha Duell, Jimmy Capella, Maria Maza, Seh-Joo Kwon, Mitchell J. Prinstein, Kristen A. Lindquist, Eva H. Telzer* (ehtelzer@unc.edu). We combined sociometric nomination and neuroimaging techniques to investigate how adolescents' brains keep track of their emerging peer-based social hierarchies. Uploaded data includes results from whole-brain analyses (i.e., high peer status, low peer status, high vs. low peer status) and conjunction analysis (i.e., the neural representation of high and low peer status). This manuscript is currently submitted to Social Affective Cognitive Neuroscience.
Subject species
homo sapiens
Map type
Other
FacebookTwitterMarket leader Facebook was the first social network to surpass one billion registered accounts and currently sits at more than three billion monthly active users. Meta Platforms owns four of the biggest social media platforms, all with more than one billion monthly active users each: Facebook (core platform), WhatsApp, Messenger, and Instagram. In the third quarter of 2023, Facebook reported around four billion monthly core Family product users. The United States and China account for the most high-profile social platforms Most top-ranked social networks with more than 100 million users originated in the United States, but services like Chinese social networks WeChat, QQ, or video-sharing app Douyin have also garnered mainstream appeal in their respective regions due to local context and content. Douyin’s popularity has led to the platform releasing an international version of its network, TikTok. How many people use social media? The leading social networks are usually available in multiple languages and enable users to connect with friends or people across geographical, political, or economic borders. In 2025, social networking sites are estimated to reach 5.44 billion users, and these figures are still expected to grow as mobile device usage and mobile social networks increasingly gain traction in previously underserved markets.