- d
Calumet & Arizona Co. Oliver Geologic Map Level 1350 Floor 9
- datadiscoverystudio.org
pdfUpdated May 7, 2014+ more versions Share
Share Facebook
 Twitter
 EmailClick to copy linkLink copiedCiteArizona Department of Mines and Mineral Resources (2014). Calumet & Arizona Co. Oliver Geologic Map Level 1350 Floor 9 [Dataset]. http://datadiscoverystudio.org/geoportal/rest/metadata/item/6a255ff2f84243348f0fe6e89c30027a/htmlpdfAvailable download formatsDataset updatedMay 7, 2014AuthorsArizona Department of Mines and Mineral ResourcesArea coveredDescription
ADMMR map collection: Calumet & Arizona Co. Oliver Geologic Map Level 1350 Floor 9; 1 in. to 50 feet; 49 x 32 in.
- E
UK ecological status map version 2
- catalogue.ceh.ac.uk
zipUpdated May 23, 2016+ more versionsShareFacebookTwitterEmailClick to copy linkLink copiedCiteR. Dyer; T. Oliver (2016). UK ecological status map version 2 [Dataset]. http://doi.org/10.5285/58b248a8-6e34-4ffb-ae32-3744566399a2zipAvailable download formatsUnique identifierhttps://doi.org/10.5285/58b248a8-6e34-4ffb-ae32-3744566399a2Dataset updatedMay 23, 2016Dataset provided byNERC EDS Environmental Information Data CentreAuthorsR. Dyer; T. OliverTime period coveredJan 1, 1970 - Dec 31, 2013Area coveredDescriptionA spatial indicator of ecological status for valuation of biodiversity across the UK, based on species occurrence records for eleven taxonomic groups (Bees, Birds, Bryophytes, Butterflies, Carabidae, Hoverflies, Isopoda, Ladybirds, Moths, Orthoptera and Vascular plants) was developed. UK species occurrence data were collated from the Biological Records Centre (BRC). The mean ecological status was calculated across all taxonomic groups for the 2000 to 2013 time period, relative to the species richness maximums from the 1970-1990 time period. This version supersedes the dataset 'UK ecological status map'.
- a
South Gillies & Oliver Lake, ON - Aug 31. 2024 - Survey Summary Map
- elsalvador-westernu.opendata.arcgis.com
Updated Nov 6, 2024+ more versionsShareFacebookTwitterEmailClick to copy linkLink copiedCiteWestern University (2024). South Gillies & Oliver Lake, ON - Aug 31. 2024 - Survey Summary Map [Dataset]. https://elsalvador-westernu.opendata.arcgis.com/items/10ef8b6ebdb449e9ad92289da1ce2159Dataset updatedNov 6, 2024Dataset authored and provided byWestern UniversityLicenseAttribution-NonCommercial 4.0 (CC BY-NC 4.0)https://creativecommons.org/licenses/by-nc/4.0/
License information was derived automaticallyArea coveredSouth Gillies, GilliesDescriptionSurvey summary map for the August 31, 2024 South Gillies and Oliver Lake, ON tornadoes. Ground survey conducted September 5-6, 2024. Map includes ground photos, drone photos, tornado centrelines, worst damage points, survey route and drone flight paths. All data are preliminary.
- w
Before Oliver Heat Map
- data.wu.ac.at
csv, json, xmlUpdated Jan 10, 2018+ more versionsShareFacebookTwitterEmailClick to copy linkLink copiedCiteBaltimore Police Department (2018). Before Oliver Heat Map [Dataset]. https://data.wu.ac.at/schema/data_baltimorecity_gov/c3R2Yi10YnF2csv, xml, jsonAvailable download formatsDataset updatedJan 10, 2018Dataset provided byBaltimore Police DepartmentLicenseAttribution 3.0 (CC BY 3.0)https://creativecommons.org/licenses/by/3.0/
License information was derived automaticallyDescriptionAll BPD data on Open Baltimore is preliminary data and subject to change. The information presented through Open Baltimore represents Part I victim based crime data. The data do not represent statistics submitted to the FBI's Uniform Crime Report (UCR); therefore any comparisons are strictly prohibited. For further clarification of UCR data, please visit http://www.fbi.gov/about-us/cjis/ucr/ucr. Please note that this data is preliminary and subject to change. Prior month data is likely to show changes when it is refreshed on a monthly basis. All data is geocoded to the approximate latitude/longitude location of the incident and excludes those records for which an address could not be geocoded. Any attempt to match the approximate location of the incident to an exact address is strictly prohibited.
- d
USGS US Topo 7.5-minute map for Oliver Lake, IN 2010
- datadiscoverystudio.org
geopdfUpdated May 17, 2010ShareFacebookTwitterEmailClick to copy linkLink copiedCiteU.S. Geological Survey (2010). USGS US Topo 7.5-minute map for Oliver Lake, IN 2010 [Dataset]. http://datadiscoverystudio.org/geoportal/rest/metadata/item/dccd172f7eb34cd7864f1a20904faf01/htmlgeopdf(16.327671)Available download formatsDataset updatedMay 17, 2010Area coveredDescriptionLayered GeoPDF 7.5 Minute Quadrangle Map. Layers of geospatial data include orthoimagery, roads, grids, geographic names, elevation contours, hydrography, and other selected map features.
- N
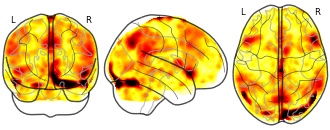
oliver.xie's temporary collection: pmap_L
- neurovault.org
niftiUpdated Aug 21, 2023+ more versionsShareFacebookTwitterEmailClick to copy linkLink copiedCite(2023). oliver.xie's temporary collection: pmap_L [Dataset]. http://identifiers.org/neurovault.image:802572niftiAvailable download formatsUnique identifierhttps://identifiers.org/neurovault.image:802572Dataset updatedAug 21, 2023LicenseCC0 1.0 Universal Public Domain Dedicationhttps://creativecommons.org/publicdomain/zero/1.0/
License information was derived automaticallyDescriptionCollection description
None
Subject species
homo sapiens
Modality
fMRI-BOLD
Cognitive paradigm (task)
rest eyes open
Map type
Z
- Z
London 1890s Ordnance Survey Text Layer
- data.niaid.nih.gov
- zenodo.org
Updated Mar 20, 2025ShareFacebookTwitterEmailClick to copy linkLink copiedCitedi Lenardo, Isabella (2025). London 1890s Ordnance Survey Text Layer [Dataset]. https://data.niaid.nih.gov/resources?id=zenodo_14982946Dataset updatedMar 20, 2025Dataset provided byZou, Mengjie
di Lenardo, Isabella
Petitpierre, RemiLicenseAttribution 4.0 (CC BY 4.0)https://creativecommons.org/licenses/by/4.0/
License information was derived automaticallyArea coveredLondonDescriptionThis dataset contains a sample of 10,000 (3.5%) out of a total of 285,846 text sequences extracted from the 1891–1896 Map of London by the Ordnance Survey (OS).
The methodology used for the automated recognition, linking, and sequencing of the text is detailed in the article Recognizing and Sequencing Multi-word Texts in Maps Using an Attentive Pointer by M. Zou et al., 2025.
Description of the content
The map is drawn at a scale of five-feet to the mile (c.a. 1:1,056). The text on the map is an invaluable source of information about the Greater London in the late Victorian period. It includes the names of streets, squares, parks, watercourses and even some estates ('Poplars', 'The Grange', 'Arbutus Lodge'). In addition, the map contains many details of the function of buildings and economic activity, such as factories ('Sweet Factory', 'Crown Linoleum Works', 'Imperial Flour Mills', 'Lion Brewery'), warehouses or commercial infrastructure ('Warehouse', 'Jamaica Wharf', 'Rag Store'), offices ('Offices'), etc. The map also mentions public buildings such as schools ('School Boys, Girls & Infants', 'Sunday School'), hospitals or clinics ('St. Saviour's Union Infirmary', 'Beulah Spa Hydropathic Establishment', 'South Western Fever Hospital'), railway stations ('Clapham Station'), post offices, banks, police stations, etc. Other social venues are also mentioned, such as public houses, i.e. pubs ('P.H.'), clubs, casinos, and recreational areas (e.g. 'Cricket Ground'). Special attention is given to churches, with a regular count of the number of seats (e.g. 'Baptist Chapel Seats for 600').
In addition, the map provides details that can be of great interest in the study of everyday life in London at the end of the 19th century. For example, there are numerous mentions of 'Stables', 'Drinking Fountain's or 'Urinal'[s]. Fire protection infrastructure is highlighted, e.g. fire plugs ('F.P.') and fire alarms ('F.A.'). The map also includes information on elevation (e.g. '11·6') and flood levels (e.g. 'High Water Mark of Ordinary Tides').
A list of abbreviations used in the Ordnance Survey maps, created by Richard Oliver [1], is made available by the National Library of Scotland (link).
Organization of the data
The data in 10k_text_london_OS_1890s.geojson is organized as a regular geojson file.
Example structure
{ "type": "FeatureCollection", "features": [ { "type": "Feature", "geometry": { "type": "MultiPolygon", "coordinates": [[[ [x1, y1], [x2, y2], ...]]] }, "properties": { "label": "Oxford Circus", } },
... # Further text sequences] }
Image documents
The original map document consists of 729 separate sheets, digitized, georeferenced, and served as geographic tiles by the National Library of Scotland [2].
Descriptive statistics
Total Number of text sequences: 285,846Sample size: 10,000Total Area covered: 450 square km
Use and Citation
For any mention of this dataset, please cite :
@misc{text_london_OS_1890s, author = {Zou, Mengjie and Petitpierre, R{\'{e}}mi and di Lenardo, Isabella}, title = {{London 1890s Ordnance Survey Text Layer}}, year = {2025}, publisher = {Zenodo}, url = {https://doi.org/10.5281/zenodo.14982946}}@article{recognizing_sequencing_2025, author = {Zou, Mengjie and Dai, Tianhao and Petitpierre, R{\'{e}}mi and Vaienti, Beatrice and di Lenardo, Isabella}, title = {{Recognizing and Sequencing Multi-word Texts in Maps Using an Attentive Pointer}}, year = {2025}}
Corresponding author
Rémi PETITPIERRE - remi.petitpierre@epfl.ch - ORCID - Github - Scholar - ResearchGate
License
This project is licensed under the CC BY 4.0 License.
Liability
We do not assume any liability for the use of this dataset.
References
Oliver R. (2013). Ordnance Survey maps: A concise guide for historians. The Charles Close Society. London, UK. 3rd Ed. 320 pages
Ordnance Survey, London, five feet to the mile, 1893-1896 (1896), https://maps.nls.uk/os/townplans-england/london-1056-1890s.html, digitized by the National Library of Scotland (NLS)
- b
Ballarat Oliver Street and Dytes Parade - Dataset - Ballarat Open Data
- ballaratopendata.org.au
Updated Apr 4, 2022+ more versionsShareFacebookTwitterEmailClick to copy linkLink copiedCite(2022). Ballarat Oliver Street and Dytes Parade - Dataset - Ballarat Open Data [Dataset]. https://ballaratopendata.org.au/dataset/hul_ballaratoliverstreetanddytesparade_modifiedDataset updatedApr 4, 2022Area coveredBallaratDescription"The map of Allotments 11, 12, Section 29, Oliver Street & Dytes Parade. Cull. This map is georeferenced by CeRDI using a projective transformation ( linear rotation and translation of coordinates: scale 1:25000). More Information: www.access.prov.vic.gov.au, www.landata.vic.gov.au Author: City of Ballarat Owner: Department of Environment, Land, Water & Planning"
- f
Population size, marker statistics, map characteristics, and key traits for...
- plos.figshare.com
- datasetcatalog.nlm.nih.gov
xlsUpdated Jun 1, 2023ShareFacebookTwitterEmailClick to copy linkLink copiedCiteRebekah E. Oliver; Nicholas A. Tinker; Gerard R. Lazo; Shiaoman Chao; Eric N. Jellen; Martin L. Carson; Howard W. Rines; Donald E. Obert; Joseph D. Lutz; Irene Shackelford; Abraham B. Korol; Charlene P. Wight; Kyle M. Gardner; Jiro Hattori; Aaron D. Beattie; Åsmund Bjørnstad; J. Michael Bonman; Jean-Luc Jannink; Mark E. Sorrells; Gina L. Brown-Guedira; Jennifer W. Mitchell Fetch; Stephen A. Harrison; Catherine J. Howarth; Amir Ibrahim; Frederic L. Kolb; Michael S. McMullen; J. Paul Murphy; Herbert W. Ohm; Brian G. Rossnagel; Weikai Yan; Kelci J. Miclaus; Jordan Hiller; Peter J. Maughan; Rachel R. Redman Hulse; Joseph M. Anderson; Emir Islamovic; Eric W. Jackson (2023). Population size, marker statistics, map characteristics, and key traits for RIL populations used for consensus mapping. [Dataset]. http://doi.org/10.1371/journal.pone.0058068.t002xlsAvailable download formatsUnique identifierhttps://doi.org/10.1371/journal.pone.0058068.t002Dataset updatedJun 1, 2023Dataset provided byPLOS ONEAuthorsRebekah E. Oliver; Nicholas A. Tinker; Gerard R. Lazo; Shiaoman Chao; Eric N. Jellen; Martin L. Carson; Howard W. Rines; Donald E. Obert; Joseph D. Lutz; Irene Shackelford; Abraham B. Korol; Charlene P. Wight; Kyle M. Gardner; Jiro Hattori; Aaron D. Beattie; Åsmund Bjørnstad; J. Michael Bonman; Jean-Luc Jannink; Mark E. Sorrells; Gina L. Brown-Guedira; Jennifer W. Mitchell Fetch; Stephen A. Harrison; Catherine J. Howarth; Amir Ibrahim; Frederic L. Kolb; Michael S. McMullen; J. Paul Murphy; Herbert W. Ohm; Brian G. Rossnagel; Weikai Yan; Kelci J. Miclaus; Jordan Hiller; Peter J. Maughan; Rachel R. Redman Hulse; Joseph M. Anderson; Emir Islamovic; Eric W. JacksonLicenseAttribution 4.0 (CC BY 4.0)https://creativecommons.org/licenses/by/4.0/
License information was derived automaticallyDescription*AB, AF, AM, STS markers based on oat sequence; BA, genomic SNPs based on tetraploid oat; BM, genomic microsatellite based on enriched oat libraries; DS, genomic SNP based on DArT; ES, genic SNP based on EST; Pc, disease resistance phenotypic marker based on crown rust; TLP, microsatellite based on thaumatin-like pathogenesis-related protein.†Markers identified as framework markers on the final maps using MultiPoint.‡O, high oil; Cr, crown rust resistance; Sr, stem rust resistance; H, historic mapping population; DON, Deoxynivalenol (toxin of Fusarium head blight); Tocol, high tocopherol; PCr, partial crown rust resistance; BG, high beta-glucan.
Data from: High resolution annual average air pollution concentration maps...
- zenodo.org
- data.niaid.nih.gov
binUpdated Jan 24, 2020ShareFacebookTwitterEmailClick to copy linkLink copiedCiteOliver Schmitz; Oliver Schmitz; Rob Beelen; Maciej Strak; Gerard Hoek; Ivan Soenario; Bert Brunekreef; Ilonca Vaartjes; Martin J. Dijst; Diederick E. Grobbee; Derek Karssenberg; Rob Beelen; Maciej Strak; Gerard Hoek; Ivan Soenario; Bert Brunekreef; Ilonca Vaartjes; Martin J. Dijst; Diederick E. Grobbee; Derek Karssenberg (2020). High resolution annual average air pollution concentration maps for the Netherlands [Dataset]. http://doi.org/10.5281/zenodo.1408592binAvailable download formatsUnique identifierhttps://doi.org/10.5281/zenodo.1408592Dataset updatedJan 24, 2020AuthorsOliver Schmitz; Oliver Schmitz; Rob Beelen; Maciej Strak; Gerard Hoek; Ivan Soenario; Bert Brunekreef; Ilonca Vaartjes; Martin J. Dijst; Diederick E. Grobbee; Derek Karssenberg; Rob Beelen; Maciej Strak; Gerard Hoek; Ivan Soenario; Bert Brunekreef; Ilonca Vaartjes; Martin J. Dijst; Diederick E. Grobbee; Derek KarssenbergLicenseAttribution 4.0 (CC BY 4.0)https://creativecommons.org/licenses/by/4.0/
License information was derived automaticallyArea coveredNetherlandsDescriptionRaster-based air pollution concentration maps for the Netherlands. The dataset consists of air pollution concentration maps for six pollutants (NO2, NO2background, NOx, PM2.5, PM2.5absorbance, PM10), covering the land mass of the Netherlands at 5m spatial resolution. The maps were calculated using the Land Use Regression models from the European Study of Cohorts for Air Pollution Effects (ESCAPE) project. Several Python scripts used for data preparation and the model scripts creating the datasets are included. Use the free 7-Zip to uncompress. Uncompressed size: 78 GiB.
A description of concepts, datasets and scripts is given in the manuscript "High resolution annual average air pollution concentration maps for the Netherlands" by Oliver Schmitz, Rob Beelen, Maciej Strak, Gerard Hoek, Ivan Soenario, Bert Brunekreef, Ilonca Vaartjes, Martin J. Dijst, Diederick E. Grobbee, and Derek Karssenberg. Scientific Data 6:190035 (2019). https://doi.org/10.1038/sdata.2019.35
The datasets are licensed under a Creative Commons license (CC-BY 4.0). The Python scripts are licensed under the MIT License.
Contact: o.schmitz@uu.nl
- e
GIS of the Ancient Parishes of England and Wales, 1500-1850 - Dataset -...
- b2find.eudat.eu
Updated Oct 19, 2023ShareFacebookTwitterEmailClick to copy linkLink copiedCite(2023). GIS of the Ancient Parishes of England and Wales, 1500-1850 - Dataset - B2FIND [Dataset]. https://b2find.eudat.eu/dataset/c96b9636-2395-5d32-8efc-ffa21a2b4d90Dataset updatedOct 19, 2023Area coveredWales, EnglandDescriptionIn the middle of 2001 Roger Kain and Richard Oliver, from the University of Exeter, published a substantial work entitled Historic Parishes of England and Wales: Electronic Map - Gazetteer- Metadata. This was the final product of a project aimed at locating and mapping the boundaries of parish and sub-parish units of the mid-nineteenth century. The authors published the results in a series of electronic maps supplied on CD-ROM. Each one of these 115 maps contain a scanned 1”:1 mile OS New Popular Series map, overlain by the boundaries. A reference number can be found in each of the polygons that can then be used to look up information about that parish in gazetteer in an accompanying book. A major limitation of this work is that although the boundaries are in digital form, they are divided into 115 tiles, none of which have any spatial co-ordinate information inherent in them. This means that although the maps are invaluable as a reference tool, they can not be used together within a GIS to select, analyse and present historic information. We have therefore created a single digital map of the boundaries to provide a single, continuous coverage of polygons, each of which contain the information provided by Kain and Oliver in their accompanying book. This information includes the parish name, Ancient County, and a reference number that coincides with entries for that parish in the 1851 census report. It is recommended that users also order disc 1 of study 4348; Historic Parishes of England and Wales : an Electronic Map of Boundaries before 1850 with a Gazetteer and Metadata Please note: this study does not include information on named individuals and would therefore not be useful for personal family history research.
- b
Subdivision Ballarat East Oliver and Humffray Streets - Dataset - Ballarat...
- ballaratopendata.org.au
Updated Apr 4, 2022+ more versionsShareFacebookTwitterEmailClick to copy linkLink copiedCite(2022). Subdivision Ballarat East Oliver and Humffray Streets - Dataset - Ballarat Open Data [Dataset]. https://ballaratopendata.org.au/dataset/hul_subdivisionballarateastoliverandhumffraystreets_modifiedDataset updatedApr 4, 2022Area coveredBallarat East, BallaratDescription"The map of Allotment 9, Section XII, Oliver & Humffray Streets. This map is georeferenced by CeRDI using a projective transformation ( linear rotation and translation of coordinates: scale 1:25000). More Information: www.access.prov.vic.gov.au, www.landata.vic.gov.au Author: City of Ballarat Owner: Department of Environment, Land, Water & Planning"
- N
zorro's temporary collection: Oliver
- neurovault.org
niftiUpdated Aug 15, 2017+ more versionsShareFacebookTwitterEmailClick to copy linkLink copiedCite(2017). zorro's temporary collection: Oliver [Dataset]. http://identifiers.org/neurovault.image:52646niftiAvailable download formatsUnique identifierhttps://identifiers.org/neurovault.image:52646Dataset updatedAug 15, 2017LicenseCC0 1.0 Universal Public Domain Dedicationhttps://creativecommons.org/publicdomain/zero/1.0/
License information was derived automaticallyDescriptionPositive emotions vs neutral emotions
Collection description
None
Subject species
homo sapiens
Modality
fMRI-BOLD
Cognitive paradigm (task)
Emotion Recognition Task
Map type
T
- d
AREA: Nevada ITEM: 152 TITLE: Isostatic gravity anomaly map - Reno 1x2...
- datadiscoverystudio.org
Updated Jan 1, 2012ShareFacebookTwitterEmailClick to copy linkLink copiedCite(2012). AREA: Nevada ITEM: 152 TITLE: Isostatic gravity anomaly map - Reno 1x2 degrees AUTHORS: Oliver, H. W. [Dataset]. http://datadiscoverystudio.org/geoportal/rest/metadata/item/4a52ba9ffd75401ea55a71b9e4495f39/htmlDataset updatedJan 1, 2012Area coveredDescriptionNOTES: 1 of 9 maps, see Nevada Items 153-160; isostatic gravity anomaly; contour interval = 5 mgal; parameters: T=25 km; delta gamma=0.4 km; color; date uncertain but probably about 1980; scale: 1:250,000; correspondence; UTMs from center of 1x2-degree q
- f
Parameters of the SSS used in this paper.
- plos.figshare.com
xlsUpdated Jun 1, 2023ShareFacebookTwitterEmailClick to copy linkLink copiedCiteAntoni Burguera; Gabriel Oliver (2023). Parameters of the SSS used in this paper. [Dataset]. http://doi.org/10.1371/journal.pone.0146396.t003xlsAvailable download formatsUnique identifierhttps://doi.org/10.1371/journal.pone.0146396.t003Dataset updatedJun 1, 2023Dataset provided byPLOS ONEAuthorsAntoni Burguera; Gabriel OliverLicenseAttribution 4.0 (CC BY 4.0)https://creativecommons.org/licenses/by/4.0/
License information was derived automaticallyDescriptionParameters of the SSS used in this paper.
- f
Slant correction.
- figshare.com
xlsUpdated Jun 1, 2023ShareFacebookTwitterEmailClick to copy linkLink copiedCiteAntoni Burguera; Gabriel Oliver (2023). Slant correction. [Dataset]. http://doi.org/10.1371/journal.pone.0146396.t001xlsAvailable download formatsUnique identifierhttps://doi.org/10.1371/journal.pone.0146396.t001Dataset updatedJun 1, 2023Dataset provided byPLOS ONEAuthorsAntoni Burguera; Gabriel OliverLicenseAttribution 4.0 (CC BY 4.0)https://creativecommons.org/licenses/by/4.0/
License information was derived automaticallyDescriptionSlant correction.
- U
An updated stress map of the continental U.S. reveals heterogeneous...
- data.usgs.gov
- res1catalogd-o-tdatad-o-tgov.vcapture.xyz
- +1more
Updated Dec 28, 2023ShareFacebookTwitterEmailClick to copy linkLink copiedCiteWilliam Levandowski; Robert Herrmann; Richard Briggs; Oliver Boyd; Ryan Gold (2023). An updated stress map of the continental U.S. reveals heterogeneous intraplate stress [Dataset]. http://doi.org/10.5066/P9BA1104Unique identifierhttps://doi.org/10.5066/P9BA1104Dataset updatedDec 28, 2023AuthorsWilliam Levandowski; Robert Herrmann; Richard Briggs; Oliver Boyd; Ryan GoldLicenseU.S. Government Workshttps://www.usa.gov/government-works
License information was derived automaticallyTime period covered1900 - 2018Area coveredUnited States, Contiguous United StatesDescriptionEarthquake focal mechanisms and stress inversion results for the conterminous United States.
Sightings from R/V Song of the Whale during the spring 2019 MAPS survey...
- gbif.org
- obis.org
- +1more
Updated Apr 24, 2021ShareFacebookTwitterEmailClick to copy linkLink copiedCiteOliver Boisseau; Oliver Boisseau (2021). Sightings from R/V Song of the Whale during the spring 2019 MAPS survey (NMFS permit 14809) [Dataset]. http://doi.org/10.15468/c67aszUnique identifierhttps://doi.org/10.15468/c67aszDataset updatedApr 24, 2021AuthorsOliver Boisseau; Oliver BoisseauLicenseAttribution-NonCommercial 4.0 (CC BY-NC 4.0)https://creativecommons.org/licenses/by-nc/4.0/
License information was derived automaticallyTime period coveredApr 6, 2019 - May 18, 2019Area coveredDescriptionOriginal provider: Marine Conservation Research
Dataset credits: Oliver Boisseau, Marine Conservation Research International
Abstract: The dataset contains all sightings of cetaceans and other megafuana made during the MAPS spring cruise in Apr/May 2019 (NMFS permit 14809). When conductiong visual effort, two observers were situated either side of R/V Song of the Whale on an observation platform with an approximate eye-height of 5.5 m above sea-level during daylight hours. The observers scanned the trackline and in front of the vessel using naked eye; 7 x 50 binoculars were used to identify species and estimate group size. During periods of bad weather, observers were stationed on deck with an approximate eye-height of 3.5 m above sea-level.
Purpose: The MAPS (Marine Mammal Passive Acoustics and Spatial Ecology) cruises form part of a BOEM project to describe the distribution and behaviour of deep-diving cetaceans in the offshore waters of North Carolina (NMFS permit 14809). MAPS is a cooperative agreement between the Bureau of Ocean Energy Management and the University of North Carolina Wilmington in partnership with Duke University.
Supplemental information: Environmental attributes were recorded less frequently than the GPS data and not all GPS records get environmental attributes attached.
- E
UK ecological status map
- catalogue.ceh.ac.uk
- cloud.csiss.gmu.edu
- +3more
Updated Apr 30, 2014+ more versionsShareFacebookTwitterEmailClick to copy linkLink copiedCiteR. Dyer; T. Oliver (2014). UK ecological status map [Dataset]. http://doi.org/10.5285/f30e4fde-634b-402a-b807-b5188d21b998Unique identifierhttps://doi.org/10.5285/f30e4fde-634b-402a-b807-b5188d21b998Dataset updatedApr 30, 2014Dataset provided byNERC EDS Environmental Information Data CentreAuthorsR. Dyer; T. OliverTime period coveredJan 1, 1970 - Dec 31, 2013Area coveredDescriptionA spatial indicator of ecological status for valuation of biodiversity across the UK, based on species occurrence records was developed. UK species occurrence data were collated from the Biological Records Centre (BRC). The mean ecological status was calculated across all taxonomic groups for the 2000 to 2013 time period, relative to the species richness maximums from the 1970-1990 time period, showing differences as colours.
- a
Oliver Lake, Alberta - Boundary (GIS data, polygon features) - Open...
- open.alberta.ca
Updated Aug 23, 2008+ more versionsShareFacebookTwitterEmailClick to copy linkLink copiedCite(2008). Oliver Lake, Alberta - Boundary (GIS data, polygon features) - Open Government [Dataset]. https://open.alberta.ca/dataset/gda-dig_2008_0823Dataset updatedAug 23, 2008Area coveredAlbertaDescriptionAll available bathymetry and related information for Oliver Lake were collected and hard copy maps digitized where necessary. The data were validated against more recent data (Shuttle Radar Topography Mission 'SRTM' imagery and Indian Remote Sensing 'IRS' imagery) and corrected where necessary. The published data set contains the lake bathymetry formatted as an Arc ascii grid. Bathymetric contours and the boundary polygon are available as shapefiles.
FacebookTwitterADMMR map collection: Calumet & Arizona Co. Oliver Geologic Map Level 1350 Floor 9; 1 in. to 50 feet; 49 x 32 in.