- f
Data from: The Hispania Map of the Hogenberg Road Atlas (1579) and the...
- tandf.figshare.com
tiffUpdated Jun 1, 2023 Share
Share Facebook
 Twitter
 EmailClick to copy linkLink copiedCiteFederico Pablo-Martí; Jesús López Requena (2023). The Hispania Map of the Hogenberg Road Atlas (1579) and the Current Spanish Transport Network [Dataset]. http://doi.org/10.6084/m9.figshare.19683163.v1tiffAvailable download formatsUnique identifierhttps://doi.org/10.6084/m9.figshare.19683163.v1Dataset updatedJun 1, 2023Dataset provided byTaylor & FrancisAuthorsFederico Pablo-Martí; Jesús López RequenaLicense
Attribution 4.0 (CC BY 4.0)https://creativecommons.org/licenses/by/4.0/
License information was derived automaticallyArea coveredHispaniaDescriptionThe Itinerarium Orbis Christiani, edited by Hogenberg between 1579 and 1580, is little known, despite being considered the first European road atlas. The Hispania map offers us a network of transport routes the implementation of which was believed to be later and representative of innovative advances in terms of the visual differentiation of these routes. This article contextualizes this map and analyzes it in detail, dating its creation and identifying its sources. It then studies the Spanish transport network during the sixteenth century and, specifically, the characteristics of the three types of routes shown on the map. This is done by comparing it with several itineraries and maps of the time. To confirm the reliability of the Hogenberg map and to ensure the actual existence of the other types of routes shown on the map, proximity algorithms were applied. The research results question the traditional view of the origin and motivations of the Spanish transport network, tracing its unplanned birth at least as far back as the sixteenth century.
- a
Effective Sig Tor Parameter
- noaa.hub.arcgis.com
Updated Feb 22, 2024ShareFacebookTwitterEmailClick to copy linkLink copiedCiteNOAA GeoPlatform (2024). Effective Sig Tor Parameter [Dataset]. https://noaa.hub.arcgis.com/maps/84ef92cefee246f8a6cb0ae5f95dd39aDataset updatedFeb 22, 2024Dataset authored and provided byNOAA GeoPlatformLicenseCC0 1.0 Universal Public Domain Dedicationhttps://creativecommons.org/publicdomain/zero/1.0/
License information was derived automaticallyArea coveredDescriptionWeb map displaying Northern Plains regional effective significant tornado parameter values at 23Z February 8, 2024. Web map implemented in a story map documenting the February 8, 2024 severe weather event in southern Wisconsin. Web map also appears in an interactive application showcasing the near-storm environment in place over southern Wisconsin on February 8.
- a
Mapa Digital 2001
- geourban-sigluz.opendata.arcgis.com
Updated Jul 25, 2023+ more versionsShareFacebookTwitterEmailClick to copy linkLink copiedCiteSIG Universidad del Zulia (2023). Mapa Digital 2001 [Dataset]. https://geourban-sigluz.opendata.arcgis.com/items/7a25b60e017241699c1c47a5f44c0147Dataset updatedJul 25, 2023Dataset authored and provided bySIG Universidad del ZuliaArea coveredDescriptionEste mapa de entidades es un trabajo generado a partir de un archivo CAD creado en el año 2001, partiendo de un vuelo aerofotogramétrico. Fue Georreferenciado en el sistema de coordenadas planas UTM, zona 19 norte, bajo los parámetros del elipsoide WGS84.
- o
Data from: Cómo hacer un mapa con QGIS
- explore.openaire.eu
Updated Jan 1, 2020ShareFacebookTwitterEmailClick to copy linkLink copiedCiteÓscar Chic; Sara Soto; José A. García (2020). Cómo hacer un mapa con QGIS [Dataset]. https://explore.openaire.eu/search/other?pid=10261/213974Dataset updatedJan 1, 2020AuthorsÓscar Chic; Sara Soto; José A. GarcíaDescriptionCon este curso se conseguirá obtener una perspectiva genérica de los Sistemas de Información Geográfica (SIG), así como de la organización interna de la información. Comprender la importancia de los sistemas de referencia de coordenadas al trabajar con datos geoespaciales, y cómo realizar transformaciones de forma adecuada cuando trabajamos con varios datum. Manejar las principales herramientas de los SIG a través del programa libre QGIS: carga de diferentes tipos de datos, visualización, selección, filtrado, edición, etc. Adquirir conocimientos de expresión cartográfica como la simbología y el etiquetado. Conocer qué es un mapa y los diferentes tipos de mapas. Realizar una composición de mapa con QGIS, con sus elementos básicos, cartela, textos, etc. Programa: Conocimiento genérico de lo que es un Sistema de Información Geográfica (SIG). Importancia y el manejo de los sistemas de referencia de coordenadas aplicados a los datos geoespaciales. Manejar de forma básica con el programa libre QGIS. Conceptos en cuanto a la expresión cartográfica, simbología y etiquetado. Concepto de lo que es un mapa, tipos de mapas, elementos que lo componen y cómo poder elaborarlo a través del programa de QGIS. Curso en la Segunda Convocatoria del plan de formación 2020 del Consejo Superior de Investigaciones Científicas (CSIC) impartido del 9 al 13 de noviembre de 2020 en Barcelona y con una duración de 25 horas Peer reviewed
Andes SIGAndes BRGM 1:2M Detailed Geology
- onegeology-geonetwork.brgm.fr
- hosted-metadata.bgs.ac.uk
html, jpeg +1Updated Oct 26, 2015ShareFacebookTwitterEmailClick to copy linkLink copiedCiteBRGM (2015). Andes SIGAndes BRGM 1:2M Detailed Geology [Dataset]. http://onegeology-geonetwork.brgm.fr/geonetwork3/srv/api/records/b97f8a8463b823b4eb3524c05f53958e2207de53ogc:wms-1.3.0-http-get-map, jpeg, htmlAvailable download formatsDataset updatedOct 26, 2015AuthorsBRGMArea coveredDescriptionThe 1:2M-scale digital map covering the whole Andes Cordillera is available in this OGC WMS service for your personal, non-commercial use only and is being served as a contribution to the OneGeology initiative (www.onegeology.org). More information about this map of the GIS Andes package is available at the following address: http://gisandes.brgm.fr/gis_geol.htm. In bibliography, this map should be cited as follows: Cassard D. (1999): GIS Andes: A metallogenic GIS of the Andes Cordillera. 4th International Symposium on Andean Geodynamics, October 4-6, 1999, Gottingen, Germany; Extended Abstracts. Institut de Recherche pour le Developpement Publisher, Paris 1999: 147-150. For information about more of the French Geological Survey's maps that are available digitally, please visit http://www.brgm.fr/cartegeol.jsp
- e
Information SIG Strategic Map of Noise of Malaga — Railway Traffic Conflict...
- data.europa.eu
unknownUpdated Jul 10, 2023+ more versionsShareFacebookTwitterEmailClick to copy linkLink copiedCite(2023). Information SIG Strategic Map of Noise of Malaga — Railway Traffic Conflict Lnight Index [Dataset]. https://data.europa.eu/data/datasets/https-datosabiertos-malaga-eu-dataset-informacion-sig-mapa-estrategico-de-ruido-de-malaga-conflicto-trafico-ferroviario-indice-lnocheunknown(649395)Available download formatsDataset updatedJul 10, 2023LicenseAttribution-ShareAlike 4.0 (CC BY-SA 4.0)https://creativecommons.org/licenses/by-sa/4.0/
License information was derived automaticallyDescriptionIt shows the areas where the levels obtained by the Strategic Noise Map are higher than the applicable acoustic quality objectives according to acoustic area, rail traffic, Night Index.
- e
Information SIG Strategic Map of Noise of Malaga — Trafico rodado vehiculos...
- data.europa.eu
unknownUpdated Jun 19, 2025+ more versionsShareFacebookTwitterEmailClick to copy linkLink copiedCite(2025). Information SIG Strategic Map of Noise of Malaga — Trafico rodado vehiculos Index Lnight [Dataset]. https://data.europa.eu/data/datasets/https-datosabiertos-malaga-eu-dataset-informacion-sig-mapa-estrategico-de-ruido-de-malaga-trafico-rodado-vehiculos-indice-lnocheunknown(18433826)Available download formatsDataset updatedJun 19, 2025LicenseAttribution-ShareAlike 4.0 (CC BY-SA 4.0)https://creativecommons.org/licenses/by-sa/4.0/
License information was derived automaticallyDescriptionThey show the data related to the sound levels obtained by the Strategic Noise Map, of the road traffic of vehicles, Lnight index.
- N
ibs_DTI_tmap_sig_246: all t map sig.nii
- neurovault.org
niftiUpdated Apr 24, 2025ShareFacebookTwitterEmailClick to copy linkLink copiedCite(2025). ibs_DTI_tmap_sig_246: all t map sig.nii [Dataset]. http://identifiers.org/neurovault.image:898819niftiAvailable download formatsUnique identifierhttps://identifiers.org/neurovault.image:898819Dataset updatedApr 24, 2025LicenseCC0 1.0 Universal Public Domain Dedicationhttps://creativecommons.org/publicdomain/zero/1.0/
License information was derived automaticallyDescription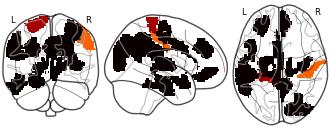
Collection description
90个病人,44个健康人的结构连接矩阵做双样本t检验,经过FDR校正之后显著性的脑区
Subject species
homo sapiens
Map type
Other
- g
Map repository at 1/50 000e
- gimi9.com
+ more versionsShareFacebookTwitterEmailClick to copy linkLink copiedCiteMap repository at 1/50 000e [Dataset]. https://gimi9.com/dataset/eu_https-data-strasbourg-eu-explore-dataset-referentiel-cartographique-au-50-000e-LicenseLicence Ouverte / Open Licence 1.0https://www.etalab.gouv.fr/wp-content/uploads/2014/05/Open_Licence.pdf
License information was derived automaticallyDescriptionMapping for medium scales (from 1/25 000th to 1/75 000th) in the territory of the Urban Community of Strasbourg, adjacent municipalities and the city of Kehl (620 km²). It is a schematic comic (lane axis) of decametric precision, including built islands, communication axes, green spaces, streams, public places, level points and toponymy. It is the reference information for communication, consultation and volume dissemination actions at the intercommunal level. The database is vectored in 2 Dimensions. It has 17 classes, or about 22000 objects. Its update is annual. Download in gpk format Download in geojson format Download in shp format Download in dwg format These files are updated every 3 months.
- e
Information SIG Strategic Map of Noise of Malaga — Traffic Railway Index...
- data.europa.eu
unknownUpdated Jun 26, 2025+ more versionsShareFacebookTwitterEmailClick to copy linkLink copiedCiteAyuntamiento de Málaga (2025). Information SIG Strategic Map of Noise of Malaga — Traffic Railway Index Lnight [Dataset]. https://data.europa.eu/data/datasets/https-datosabiertos-malaga-eu-dataset-informacion-sig-mapa-estrategico-de-ruido-de-malaga-trafico-ferroviario-indice-lnocheunknown(804121)Available download formatsDataset updatedJun 26, 2025Dataset authored and provided byAyuntamiento de MálagaLicenseAttribution-ShareAlike 4.0 (CC BY-SA 4.0)https://creativecommons.org/licenses/by-sa/4.0/
License information was derived automaticallyArea coveredMálagaDescriptionThey show the data related to the sound levels obtained by the Strategic Noise Map, of rail traffic, Lnight index.
- d
Data from: Tikal Report 11: Georeferenced Map- "Perdido Quadrangle" (without...
- search.dataone.org
Updated Aug 30, 2013+ more versionsShareFacebookTwitterEmailClick to copy linkLink copiedCiteCarr, Christopher (University of Cincinnati, Department of Geography) (2013). Tikal Report 11: Georeferenced Map- "Perdido Quadrangle" (without border) [Dataset]. http://doi.org/10.6067/XCV8P55PC3Unique identifierhttps://doi.org/10.6067/XCV8P55PC3Dataset updatedAug 30, 2013Dataset provided bythe Digital Archaeological RecordAuthorsCarr, Christopher (University of Cincinnati, Department of Geography)Area coveredDescriptionThese maps are georeferenced versions of the maps produced by The University Museum, University of Pennsylvania, project at Tikal, Guatemala and published as Tikal Report 11. These georeferenced maps are intended for use with GIS (Geographic Information System) software. The maps should be useful for archaeologists, tourists and managers of Tikal National Park. This map set consists of eleven georeferenced maps. The set includes two versions of the overview map of the central sixteen square kilometers of Tikal—the "Ruins of Tikal" map. One version includes the map border. The other version is without the border. The nine remaining maps cover the inner nine square kilometers in detail, without borders. The maps were georeferenced as part of a University of Cincinnati project in Tikal, under permit of the Guatemalan government. The UC Project georeferenced the maps using land survey methods. We created transformation equations based on a point of beginning, a reference direction and a map scale. Directions and distances on the ground were transformed into UTM projected directions and distances. The point of beginning was the Petty Company benchmark shown on the "Camp Quad" map. In 2010 we determined the location with a GPS receiver. We accessed both the horizontal and vertical accuracy of the georeferenced maps. Based on 96 test points spread throughout the area of the maps, we found the median horizontal accuracy of the maps, compared to GPS, to be 5.6 meters. Based on 103 test points spread throughout the area of the maps, we found the median vertical accuracy of the maps, compared to a NASA radar altimetry mission, to be 2.1 meters. The borders of the maps were removed so the set of maps will “seamlessly” fit together in GIS. See Tikal Report No.11 for versions of the maps with borders (one version of the georeferenced "Ruins of Tikal" map includes the border). The georeferencing files are optimized for use in ArcGIS version 9.2 and beyond. The PDF file of TR11 from which these maps were extracted was made with the generous assistance of the University Museum Library and the Tikal Archives. Details of the georeferencing and accuracy check are in a report to the Dirección Patrimonio Cultural y Natural de Guatemala: Christopher Carr, Eric Weaver, Nicholas Dunning, and Vernon Scarborough (2011) EVALUACIÓN DE LA EXACTITUD DE LOS MAPAS DE TIKAL DE LA UNIVERSIDAD DE PENNSYLVANIA, POR GPS Y ESTACIÓN TOTAL (Accuracy assessment of the Penn Project maps of Tikal, by GPS and Total Station). In Lentz, D., C. Ramos, N. Dunning, V. Scarborough and L. Grazioso. PROYECTO DE SILVICULTURA Y MANEJO DE AGUAS DE LOS ANTIGUOS MAYAS DE TIKAL. Additional details of the strategies the Penn Project used to produce these high quality maps, the georeferencing methodology, and the accuracy check process are forthcoming in a book chapter. The book is on the UC project at Tikal, to be published by Cambridge University Press. The chapter is Carr, Weaver, Dunning and Scarborough. Bringing the University of Pennsylvania maps of Tikal into the era of electronic GIS. In Lentz, Dunning, Scarborough (eds). Tikal and Maya Ecology: Water, Landscapes and Resilience. Permission to publish these maps must be secured from: The University of Pennsylvania Museum of Archaeology and Anthropology, 3260 South Street, Philadelphia, PA 19104, Tel: (215) 898-4050, Fax: (215) 573-9369, Email: publications@pennmuseum.org. .................................................................................................................. Estos mapas son versiones georeferenciados de los mapas producidos por el Museo Universitario de la Universidad de Pennsylvania, Proyecto Tikal, Guatemala y publicado como Informe de Tikal No. 11. La intensión de estos mapas georeferenciados es para ser utilizados con el Sistema de Información Geográfica (SIG). Los mapas deben ser útiles para los arqueólogos, los turistas y los administradores del Parque Nacional Tikal. Este conjunto de mapas consta de once mapas georreferenciados. El juego incluye dos versiones del mapa general de los 16 km2 centrales del mapa de las "Ruins of Tikal". Una versión del mapa incluye sus encuadrados. La otra versión esta sin los encuadrados. Los nueve mapas restantes cubren los mapas interiores de 9 km2 en detalle, sin encuadrados. Los mapas fueron georeferenciados como parte de un proyecto de la Universidad de Cincinnati en Tikal, con permiso del Ministerio de Cultura y Deportes del Gobierno de Guatemala. El Proyecto de la Universidad de Cincinnati georeferenció los mapas utilizando métodos de reconocimiento de campo. Creamos ecuaciones de transformación basado en un punto de inicio, una dirección de referencia y un mapa a escala. Direcciones y distancias en el campo se transformaron en direcciones proyectadas UTM y distancias. El punto de inicio fue el punto de refere... Visit https://dataone.org/datasets/doi%3A10.6067%3AXCV8P55PC3_meta%24v%3D1377891476776 for complete metadata about this dataset.
- D
Información SIG Mapa Estratégico de Ruido de Málaga - Tráfico Ferroviario...
- datosabiertos.malaga.eu
- datos.gob.es
- +1more
shpUpdated Nov 30, 2017ShareFacebookTwitterEmailClick to copy linkLink copiedCiteMEDIO AMBIENTE Y SOSTENIBILIDAD (2017). Información SIG Mapa Estratégico de Ruido de Málaga - Tráfico Ferroviario Índice Ldía [Dataset]. https://datosabiertos.malaga.eu/dataset/informacion-sig-mapa-estrategico-de-ruido-de-malaga-trafico-ferroviario-indice-ldiashp(744840)Available download formatsDataset updatedNov 30, 2017Dataset provided byMEDIO AMBIENTE Y SOSTENIBILIDADLicenseAttribution-ShareAlike 4.0 (CC BY-SA 4.0)https://creativecommons.org/licenses/by-sa/4.0/
License information was derived automaticallyArea coveredMálagaDescriptionMuestran los datos relativos a los niveles sonoros obtenidos por el Mapa Estratégico de Ruido, del tráfico ferroviario, índice Ldía.
- g
Worldwide seabed sediment map
- guyane-sig.fr
- catalogue.tools4msp.eu
- +1more
Updated Apr 5, 2024+ more versionsShareFacebookTwitterEmailClick to copy linkLink copiedCite(2024). Worldwide seabed sediment map [Dataset]. https://www.guyane-sig.fr/geonetwork/srv/search?keyword=ProductDataset updatedApr 5, 2024DescriptionThe “World Seabed Sediment Map” product contains geo-referenced digital data, describing the nature of the sediment encountered in different seas and oceans of the world. The objects are all surface areas and the description of an object includes in particular the nature of the sediment including rock-type bottoms.
- a
Mapa - Modelo de Resistencia
- conexionbiocaribe-pnnc.opendata.arcgis.com
Updated Nov 4, 2019ShareFacebookTwitterEmailClick to copy linkLink copiedCitesig.dtca_pnnc (2019). Mapa - Modelo de Resistencia [Dataset]. https://conexionbiocaribe-pnnc.opendata.arcgis.com/maps/bf445f70b5c9443ab042540a8ad7ae94Dataset updatedNov 4, 2019Dataset authored and provided bysig.dtca_pnncArea coveredDescriptionMapa del modelo de resistencia (2019)
- a
Mid Morning Day 1 Sig Wind Risk
- noaa.hub.arcgis.com
Updated Oct 18, 2023ShareFacebookTwitterEmailClick to copy linkLink copiedCiteNOAA GeoPlatform (2023). Mid Morning Day 1 Sig Wind Risk [Dataset]. https://noaa.hub.arcgis.com/maps/noaa::mid-morning-day-1-sig-wind-riskDataset updatedOct 18, 2023Dataset authored and provided byNOAA GeoPlatformLicenseCC0 1.0 Universal Public Domain Dedicationhttps://creativecommons.org/publicdomain/zero/1.0/
License information was derived automaticallyArea coveredDescriptionFeature layer showing the significant wind probabilities from the mid-morning (1630Z August 10, 2020) update of the Storm Prediction Center's day one convective outlook for August 10, 2020. Feature layer appears in a web map documenting the evolution of the Storm Prediction Center convective outlooks leading up to the August 10, 2020 Midwest derecho. Outlook GeoJSON files obtained from the Storm Prediction Center convective outlook archive.
- D
Información SIG Mapa Estratégico de Ruido de Málaga - Ruido total Índice...
- datosabiertos.malaga.eu
- datos.gob.es
- +1more
shpUpdated Jun 12, 2014+ more versionsShareFacebookTwitterEmailClick to copy linkLink copiedCiteMEDIO AMBIENTE Y SOSTENIBILIDAD (2014). Información SIG Mapa Estratégico de Ruido de Málaga - Ruido total Índice Lden [Dataset]. https://datosabiertos.malaga.eu/dataset/informacion-sig-mapa-estrategico-de-ruido-de-malaga-ruido-total-indice-ldenshp(19866243)Available download formatsDataset updatedJun 12, 2014Dataset provided byMEDIO AMBIENTE Y SOSTENIBILIDADLicenseAttribution-ShareAlike 4.0 (CC BY-SA 4.0)https://creativecommons.org/licenses/by-sa/4.0/
License information was derived automaticallyArea coveredMálagaDescriptionMuestran los datos relativos a los niveles sonoros obtenidos por el Mapa Estratégico de Ruido, ruido total, índice Lden.
- D
Información SIG Mapa Estratégico de Ruido de Málaga - Conflicto tráfico...
- datosabiertos.malaga.eu
- datos.gob.es
- +2more
shpUpdated Jun 12, 2014ShareFacebookTwitterEmailClick to copy linkLink copiedCiteMEDIO AMBIENTE Y SOSTENIBILIDAD (2014). Información SIG Mapa Estratégico de Ruido de Málaga - Conflicto tráfico ferroviario Índice Lnoche [Dataset]. https://datosabiertos.malaga.eu/dataset/informacion-sig-mapa-estrategico-de-ruido-de-malaga-conflicto-trafico-ferroviario-indice-lnocheshp(649395)Available download formatsDataset updatedJun 12, 2014Dataset provided byMEDIO AMBIENTE Y SOSTENIBILIDADLicenseAttribution-ShareAlike 4.0 (CC BY-SA 4.0)https://creativecommons.org/licenses/by-sa/4.0/
License information was derived automaticallyArea coveredMálagaDescriptionMuestra las zonas donde los niveles obtenidos por el Mapa Estratégico de Ruido son superiores a los objetivos de calidad acústica aplicables según área acústica, del tráfico ferroviario, Índice Lnoche.
- W
Mapa Concesiones Carreteras
- cloud.csiss.gmu.edu
csv, jsonUpdated Feb 13, 2019ShareFacebookTwitterEmailClick to copy linkLink copiedCitewww.datos.gov.co (2019). Mapa Concesiones Carreteras [Dataset]. https://cloud.csiss.gmu.edu/uddi/dataset/mapa-concesiones-carreterasjson, csvAvailable download formatsDataset updatedFeb 13, 2019Dataset provided bywww.datos.gov.coDescriptionInformación Geográfica de las Concesiones del modo Carretero a Cargo de la Agencia Nacional de Infraestructura ANI
- g
Map repository at 1/10 000e
- gimi9.com
Updated Jul 6, 2025ShareFacebookTwitterEmailClick to copy linkLink copiedCite(2025). Map repository at 1/10 000e [Dataset]. https://gimi9.com/dataset/eu_https-data-strasbourg-eu-explore-dataset-referentiel-cartographique-au-10-000e-/Dataset updatedJul 6, 2025LicenseLicence Ouverte / Open Licence 1.0https://www.etalab.gouv.fr/wp-content/uploads/2014/05/Open_Licence.pdf
License information was derived automaticallyDescriptionMapping for medium scales (1/5 000th to 1/25 000th) on the territory of the Eurometropolis of Strasbourg, adjacent municipalities and the city of Kehl. It is a schematic comic (lane anamorphosis) of precision 5 to 10 m, including individualised building, public building, communication channels, green spaces, forests, streams and toponymy. It is the reference information for communication, consultation and volume dissemination actions at the level of a municipality. The database is vectored in 2 Dimensions. It has 32 classes, or about 56000 objects. Its update is ongoing. Download in gpk format Download in geojson format Download in shp format Download in dwg format These files are updated every 3 months.
- e
Information SIG Strategic Map of Noise of Malaga — Total Noise Index Night
- data.europa.eu
unknownShareFacebookTwitterEmailClick to copy linkLink copiedCiteAyuntamiento de Málaga, Information SIG Strategic Map of Noise of Malaga — Total Noise Index Night [Dataset]. https://data.europa.eu/data/datasets/https-datosabiertos-malaga-eu-dataset-informacion-sig-mapa-estrategico-de-ruido-de-malaga-ruido-total-indice-lnocheunknown(18660723)Available download formatsDataset authored and provided byAyuntamiento de MálagaLicenseAttribution-ShareAlike 4.0 (CC BY-SA 4.0)https://creativecommons.org/licenses/by-sa/4.0/
License information was derived automaticallyDescriptionThey show the data related to the sound levels obtained by the Strategic Noise Map, total noise, Lnight index.
FacebookTwitterData from: The Hispania Map of the Hogenberg Road Atlas (1579) and the Current Spanish Transport Network
Attribution 4.0 (CC BY 4.0)https://creativecommons.org/licenses/by/4.0/
License information was derived automatically
The Itinerarium Orbis Christiani, edited by Hogenberg between 1579 and 1580, is little known, despite being considered the first European road atlas. The Hispania map offers us a network of transport routes the implementation of which was believed to be later and representative of innovative advances in terms of the visual differentiation of these routes. This article contextualizes this map and analyzes it in detail, dating its creation and identifying its sources. It then studies the Spanish transport network during the sixteenth century and, specifically, the characteristics of the three types of routes shown on the map. This is done by comparing it with several itineraries and maps of the time. To confirm the reliability of the Hogenberg map and to ensure the actual existence of the other types of routes shown on the map, proximity algorithms were applied. The research results question the traditional view of the origin and motivations of the Spanish transport network, tracing its unplanned birth at least as far back as the sixteenth century.