MD COVID-19 - Total Hospitalizations
- opendata.maryland.gov
- healthdata.gov
- +2more
csv, xlsx, xmlUpdated Mar 14, 2022+ more versions Share
Share Facebook
 Twitter
 EmailClick to copy linkLink copiedCiteMaryland Department of Health Prevention and Health Promotion Administration, MDH PHPA (2022). MD COVID-19 - Total Hospitalizations [Dataset]. https://opendata.maryland.gov/Health-and-Human-Services/MD-COVID-19-Total-Hospitalizations/g59h-ffnvxml, xlsx, csvAvailable download formatsDataset updatedMar 14, 2022AuthorsMaryland Department of Health Prevention and Health Promotion Administration, MDH PHPALicense
U.S. Government Workshttps://www.usa.gov/government-works
License information was derived automaticallyArea coveredMarylandDescriptionNOTE: This layer is deprecated (last updated 3/14/2022). This was formerly a daily update.
Summary The cumulative number of COVID-19 positive Maryland residents who have been hospitalized.
Description The MD COVID-19 - Total Hospitalizations data layer is a collection of the statewide cumulative total of individuals who tested positive for COVID-19 that have been reported each day by each local health department as having been hospitalized. As published to coronavirus.maryland.gov, this is the "Ever Hospitalized" number. "Ever Hospitalized" refers to the cumulative number of individuals who were admitted to the hospital at some point during their COVID-19 illness.
Terms of Use The Spatial Data, and the information therein, (collectively the "Data") is provided "as is" without warranty of any kind, either expressed, implied, or statutory. The user assumes the entire risk as to quality and performance of the Data. No guarantee of accuracy is granted, nor is any responsibility for reliance thereon assumed. In no event shall the State of Maryland be liable for direct, indirect, incidental, consequential or special damages of any kind. The State of Maryland does not accept liability for any damages or misrepresentation caused by inaccuracies in the Data or as a result to changes to the Data, nor is there responsibility assumed to maintain the Data in any manner or form. The Data can be freely distributed as long as the metadata entry is not modified or deleted. Any data derived from the Data must acknowledge the State of Maryland in the metadata.
- d
MD COVID-19 - Total Currently Hospitalized - Acute and ICU
- catalog.data.gov
- opendata.maryland.gov
- +1more
Updated Jun 29, 2025+ more versionsShareFacebookTwitterEmailClick to copy linkLink copiedCiteopendata.maryland.gov (2025). MD COVID-19 - Total Currently Hospitalized - Acute and ICU [Dataset]. https://catalog.data.gov/dataset/md-covid-19-total-currently-hospitalized-acute-and-icuDataset updatedJun 29, 2025Dataset provided byopendata.maryland.govDescriptionNOTE: This dataset is no longer being updated as of 4/27/2023. It is retired and no longer included in public COVID-19 data dissemination. See this link for more information https://imap.maryland.gov/pages/covid-data Summary The daily occupancy number of COVID-19 designated hospital beds in Maryland. Description The MD COVID-19 - Total Currently Hospitalized - Acute and ICU data layer is a collection of the statewide cumulative total of individuals who tested positive for COVID-19 that have been reported each day via CRISP as currently occupying a COVID-19 bed in a Maryland hospital facility. MD COVID-19 - Total Currently Hospitalized comprises two subsets: Adult Acute Care Beds and Adult ICU Beds. Terms of Use The Spatial Data, and the information therein, (collectively the "Data") is provided "as is" without warranty of any kind, either expressed, implied, or statutory. The user assumes the entire risk as to quality and performance of the Data. No guarantee of accuracy is granted, nor is any responsibility for reliance thereon assumed. In no event shall the State of Maryland be liable for direct, indirect, incidental, consequential or special damages of any kind. The State of Maryland does not accept liability for any damages or misrepresentation caused by inaccuracies in the Data or as a result to changes to the Data, nor is there responsibility assumed to maintain the Data in any manner or form. The Data can be freely distributed as long as the metadata entry is not modified or deleted. Any data derived from the Data must acknowledge the State of Maryland in the metadata.
- d
MD COVID-19 - MASTER Case Tracker
- catalog.data.gov
- opendata.maryland.gov
Updated Oct 25, 2025+ more versionsShareFacebookTwitterEmailClick to copy linkLink copiedCiteopendata.maryland.gov (2025). MD COVID-19 - MASTER Case Tracker [Dataset]. https://catalog.data.gov/dataset/md-covid-19-master-case-trackerDataset updatedOct 25, 2025Dataset provided byopendata.maryland.govArea coveredMarylandDescriptionNote:This dataset represents archived records covering the period from March 2020 through October 2025. The most recent dataset, containing data from October 2025 to the present, is available at: https://data.maryland.gov/Health-and-Human-Services/COVID-Master-Tracker/37gh-4yqf/about_data Summary The cases, tests, positivity rates, hospitalizations, and confirmed and probable deaths for COVID-19 in Maryland. Description The MD COVID-19 - MASTER Case Tracker is a collection of Total Cases, Total Tests, Postivity Rates, Persons Tested Negative, Total Daily Hospital Beds, Total Ever Hospitalized, Total Persons Documented to Have Completed Home Isolation, Cases by County, Cases by Age Distribution, Cases by Gender Distribution, Cases by Race and Ethnicity Distribution, Confirmed Deaths Statewide, Confirmed Deaths by Date of Death, Confirmed Deaths by County, Confirmed Deaths by Age Distribution, Confirmed Deaths by Gender Distribution, Confirmed Deaths by Race And Ethnicity Distribution, Probable Deaths Statewide, Probable Deaths by Date of Death, Probable Deaths by County, Probable Deaths by Age Distribution, Probable Deaths by Gender Distribution, and Probable Deaths by Race And Ethnicity Distribution. Terms of Use The Spatial Data, and the information therein, (collectively the "Data") is provided "as is" without warranty of any kind, either expressed, implied, or statutory. The user assumes the entire risk as to quality and performance of the Data. No guarantee of accuracy is granted, nor is any responsibility for reliance thereon assumed. In no event shall the State of Maryland be liable for direct, indirect, incidental, consequential or special damages of any kind. The State of Maryland does not accept liability for any damages or misrepresentation caused by inaccuracies in the Data or as a result to changes to the Data, nor is there responsibility assumed to maintain the Data in any manner or form. The Data can be freely distributed as long as the metadata entry is not modified or deleted. Any data derived from the Data must acknowledge the State of Maryland in the metadata.
- d
MDCOVID-19 Total Currently Hospitalized Adult and Pediatric Acute and ICU
- catalog.data.gov
- opendata.maryland.gov
Updated Oct 18, 2025+ more versionsShareFacebookTwitterEmailClick to copy linkLink copiedCiteopendata.maryland.gov (2025). MDCOVID-19 Total Currently Hospitalized Adult and Pediatric Acute and ICU [Dataset]. https://catalog.data.gov/dataset/mdcovid-19-total-currently-hospitalized-adult-and-pediatric-acute-and-icuDataset updatedOct 18, 2025Dataset provided byopendata.maryland.govDescriptionNote Note: Starting October 10th, 2025 this dataset is deprecated and is no longer being updated. Summary The daily occupancy number of COVID-19 designated hospital beds in Maryland. Description The MD COVID-19 - Total Currently Hospitalized - Acute and ICU data layer is a collection of the statewide cumulative total of individuals who tested positive for COVID-19 that have been reported each day via CRISP as currently occupying a COVID-19 bed in a Maryland hospital facility. MD COVID-19 - Total Currently Hospitalized comprises four subsets: Adult Acute Care Beds, Adult ICU Beds Pediatrics Acute Care Beds and Pediatrics ICU Care Beds.
MD COVID-19 - Total Hospitalizations - rcy9-5djq - Archive Repository
- healthdata.gov
csv, xlsx, xmlUpdated Jul 25, 2023+ more versionsShareFacebookTwitterEmailClick to copy linkLink copiedCite(2023). MD COVID-19 - Total Hospitalizations - rcy9-5djq - Archive Repository [Dataset]. https://healthdata.gov/dataset/MD-COVID-19-Total-Hospitalizations-rcy9-5djq-Archi/it8c-k5z8xlsx, csv, xmlAvailable download formatsDataset updatedJul 25, 2023DescriptionThis dataset tracks the updates made on the dataset "MD COVID-19 - Total Hospitalizations" as a repository for previous versions of the data and metadata.
- M
COVID19 Total Hospitalizations - Maryland
- catalog.midasnetwork.us
Updated Jan 13, 2022ShareFacebookTwitterEmailClick to copy linkLink copiedCiteMaryland Department of Health (2022). COVID19 Total Hospitalizations - Maryland [Dataset]. https://catalog.midasnetwork.us/collection/203Dataset updatedJan 13, 2022Dataset provided byMIDAS COORDINATION CENTERAuthorsMaryland Department of HealthLicenseApache License, v2.0https://www.apache.org/licenses/LICENSE-2.0
License information was derived automaticallyTime period coveredMar 13, 2020 - Jan 13, 2022Area coveredState, MarylandVariables measuredViruses, disease, COVID-19, pathogen, Homo sapiens, host organism, Population count, infectious disease, hospital stay dataset, viral Infectious disease, and 3 moreDescriptionThe dataset comprises of the collection of the statewide cumulative total of Maryland individuals (or residents) who tested positive for COVID-19 that have been reported each day by each local health department as having been hospitalized. As published to coronavirus.maryland.gov, this is the "Ever Hospitalized" number. "Ever Hospitalized" refers to the cumulative number of individuals who were admitted to the hospital at some point during their COVID-19 illness. The dataset can be downloaded and viewed in a CSV file format.
- y
Maryland Coronavirus Cases Currently Hospitalized
- ycharts.com
htmlUpdated May 6, 2024ShareFacebookTwitterEmailClick to copy linkLink copiedCiteUS Department of Health & Human Services (2024). Maryland Coronavirus Cases Currently Hospitalized [Dataset]. https://ycharts.com/indicators/maryland_coronavirus_cases_currently_hospitalizedhtmlAvailable download formatsDataset updatedMay 6, 2024Dataset provided byYChartsAuthorsUS Department of Health & Human ServicesLicensehttps://www.ycharts.com/termshttps://www.ycharts.com/terms
Time period coveredJul 15, 2020 - Apr 27, 2024Area coveredMarylandVariables measuredMaryland Coronavirus Cases Currently HospitalizedDescriptionView daily updates and historical trends for Maryland Coronavirus Cases Currently Hospitalized. Source: US Department of Health & Human Services. Track ec…
MD COVID-19 Total Currently Hospitalized Adult and Pediatric Acute and ICU -...
- healthdata.gov
csv, xlsx, xmlUpdated Apr 8, 2025+ more versionsShareFacebookTwitterEmailClick to copy linkLink copiedCite(2025). MD COVID-19 Total Currently Hospitalized Adult and Pediatric Acute and ICU - jpv3-byab - Archive Repository [Dataset]. https://healthdata.gov/dataset/MD-COVID-19-Total-Currently-Hospitalized-Adult-and/ig52-pbrucsv, xml, xlsxAvailable download formatsDataset updatedApr 8, 2025DescriptionThis dataset tracks the updates made on the dataset "MD COVID-19 Total Currently Hospitalized Adult and Pediatric Acute and ICU" as a repository for previous versions of the data and metadata.
- a
MDCOVID19 TotalCurrentlyHospitalized AdultandPediatric AcuteAndICU
- hub.arcgis.com
- data.imap.maryland.gov
- +1more
Updated Oct 8, 2021ShareFacebookTwitterEmailClick to copy linkLink copiedCiteArcGIS Online for Maryland (2021). MDCOVID19 TotalCurrentlyHospitalized AdultandPediatric AcuteAndICU [Dataset]. https://hub.arcgis.com/datasets/5804ed5beed24fc690fbf6b86711ffdaDataset updatedOct 8, 2021Dataset authored and provided byArcGIS Online for MarylandDescriptionNotice:Starting October 10th, 2025 this dataset is deprecated and is no longer being updated. Please refer to the Open Data resource at https://data.maryland.gov/Health-and-Human-Services/COVID-Master-Tracker/37gh-4yqf for continued weekly updates. SummaryThe daily occupancy number of COVID-19 designated hospital beds in Maryland.DescriptionThe MD COVID-19 - Total Currently Hospitalized - Acute and ICU data layer is a collection of the statewide cumulative total of individuals who tested positive for COVID-19 that have been reported each day via CRISP as currently occupying a COVID-19 bed in a Maryland hospital facility. MD COVID-19 - Total Currently Hospitalized comprises four subsets: Adult Acute Care Beds, Adult ICU Beds Pediatrics Acute Care Beds and Pediatrics ICU Care Beds.COVID-19 is a disease caused by a respiratory virus first identified in Wuhan, Hubei Province, China in December 2019. COVID-19 is a new virus that hasn't caused illness in humans before. Worldwide, COVID-19 has resulted in thousands of infections, causing illness and in some cases death. Cases have spread to countries throughout the world, with more cases reported daily. The Maryland Department of Health reports daily on COVID-19 cases by county.
- u
Data from: Randomized Controlled Trial of Losartan for Patients With...
- investigacion.usc.gal
Updated 2021+ more versionsShareFacebookTwitterEmailClick to copy linkLink copiedCiteUniversity of Minnesota; Michael A. Puskarich, MD, MS; Nicholas E. Ingraham, MD; Lisa H. Merck,MD, MPH; Brian E. Driver, MD; David A. Wacker, MD, PhD; Lauren Page Black, MD, MPH; Alan E. Jones; Courtney V. Fletcher; Andrew C. Nelson, MD, PhD; Thomas A. Murray, PhD; Christopher J. Tignanelli, MD, MS; Christopher Lewandowski, MD; Joseph Farhat, MD; Justin L. Benoit, MD, MS, FAEMS; Dana Byrne, MD; Alex Hall, DHSc; Ronald A. Reilkoff, MD; Michelle H. Biros, MD, MS; Kartik Cherabuddi, MD; Jeffrey G. Chipman, MD; Timothy W. Schacker, MD; Tyler Bold, MD, PhD; Kenneth Beckman, PhD; Ryan Langlois, Ph.D; Matthew T. Aliota, Ph.D; Faheem W. Guirgis, MD; James Galbriath; Margaret Beyer, BS; Chas Salmen, MD; Brian W. Roberts; David W. Wright, MD; Helen T. Voelker; University of Minnesota; Michael A. Puskarich, MD, MS; Nicholas E. Ingraham, MD; Lisa H. Merck,MD, MPH; Brian E. Driver, MD; David A. Wacker, MD, PhD; Lauren Page Black, MD, MPH; Alan E. Jones; Courtney V. Fletcher; Andrew C. Nelson, MD, PhD; Thomas A. Murray, PhD; Christopher J. Tignanelli, MD, MS; Christopher Lewandowski, MD; Joseph Farhat, MD; Justin L. Benoit, MD, MS, FAEMS; Dana Byrne, MD; Alex Hall, DHSc; Ronald A. Reilkoff, MD; Michelle H. Biros, MD, MS; Kartik Cherabuddi, MD; Jeffrey G. Chipman, MD; Timothy W. Schacker, MD; Tyler Bold, MD, PhD; Kenneth Beckman, PhD; Ryan Langlois, Ph.D; Matthew T. Aliota, Ph.D; Faheem W. Guirgis, MD; James Galbriath; Margaret Beyer, BS; Chas Salmen, MD; Brian W. Roberts; David W. Wright, MD; Helen T. Voelker (2021). Randomized Controlled Trial of Losartan for Patients With COVID-19 Requiring Hospitalization [Dataset]. https://investigacion.usc.gal/documentos/67a9c7ad19544708f8c6f808Dataset updated2021AuthorsUniversity of Minnesota; Michael A. Puskarich, MD, MS; Nicholas E. Ingraham, MD; Lisa H. Merck,MD, MPH; Brian E. Driver, MD; David A. Wacker, MD, PhD; Lauren Page Black, MD, MPH; Alan E. Jones; Courtney V. Fletcher; Andrew C. Nelson, MD, PhD; Thomas A. Murray, PhD; Christopher J. Tignanelli, MD, MS; Christopher Lewandowski, MD; Joseph Farhat, MD; Justin L. Benoit, MD, MS, FAEMS; Dana Byrne, MD; Alex Hall, DHSc; Ronald A. Reilkoff, MD; Michelle H. Biros, MD, MS; Kartik Cherabuddi, MD; Jeffrey G. Chipman, MD; Timothy W. Schacker, MD; Tyler Bold, MD, PhD; Kenneth Beckman, PhD; Ryan Langlois, Ph.D; Matthew T. Aliota, Ph.D; Faheem W. Guirgis, MD; James Galbriath; Margaret Beyer, BS; Chas Salmen, MD; Brian W. Roberts; David W. Wright, MD; Helen T. Voelker; University of Minnesota; Michael A. Puskarich, MD, MS; Nicholas E. Ingraham, MD; Lisa H. Merck,MD, MPH; Brian E. Driver, MD; David A. Wacker, MD, PhD; Lauren Page Black, MD, MPH; Alan E. Jones; Courtney V. Fletcher; Andrew C. Nelson, MD, PhD; Thomas A. Murray, PhD; Christopher J. Tignanelli, MD, MS; Christopher Lewandowski, MD; Joseph Farhat, MD; Justin L. Benoit, MD, MS, FAEMS; Dana Byrne, MD; Alex Hall, DHSc; Ronald A. Reilkoff, MD; Michelle H. Biros, MD, MS; Kartik Cherabuddi, MD; Jeffrey G. Chipman, MD; Timothy W. Schacker, MD; Tyler Bold, MD, PhD; Kenneth Beckman, PhD; Ryan Langlois, Ph.D; Matthew T. Aliota, Ph.D; Faheem W. Guirgis, MD; James Galbriath; Margaret Beyer, BS; Chas Salmen, MD; Brian W. Roberts; David W. Wright, MD; Helen T. VoelkerDescriptionThis is a multi-center, double-blinded study of COVID-19 infected patients requiring inpatient hospital admission randomized 1:1 to daily Losartan or placebo for 7 days or hospital discharge.
Data_Sheet_1_Geographic disparities and temporal changes of COVID-19...
- frontiersin.figshare.com
txtUpdated Jun 2, 2023+ more versionsShareFacebookTwitterEmailClick to copy linkLink copiedCiteMd Marufuzzaman Khan; Nirmalendu Deb Nath; Matthew Schmidt; Grace Njau; Agricola Odoi (2023). Data_Sheet_1_Geographic disparities and temporal changes of COVID-19 hospitalization risks in North Dakota.CSV [Dataset]. http://doi.org/10.3389/fpubh.2023.1062177.s001txtAvailable download formatsUnique identifierhttps://doi.org/10.3389/fpubh.2023.1062177.s001Dataset updatedJun 2, 2023AuthorsMd Marufuzzaman Khan; Nirmalendu Deb Nath; Matthew Schmidt; Grace Njau; Agricola OdoiLicenseAttribution 4.0 (CC BY 4.0)https://creativecommons.org/licenses/by/4.0/
License information was derived automaticallyArea coveredNorth DakotaDescriptionBackgroundAlthough the burden of the coronavirus disease 2019 (COVID-19) has been different across communities in the US, little is known about the disparities in COVID-19 burden in North Dakota (ND) and yet this information is important for guiding planning and provision of health services. Therefore, the objective of this study was to identify geographic disparities of COVID-19 hospitalization risks in ND.MethodsData on COVID-19 hospitalizations from March 2020 to September 2021 were obtained from the ND Department of Health. Monthly hospitalization risks were computed and temporal changes in hospitalization risks were assessed graphically. County-level age-adjusted and spatial empirical Bayes (SEB) smoothed hospitalization risks were computed. Geographic distributions of both unsmoothed and smoothed hospitalization risks were visualized using choropleth maps. Clusters of counties with high hospitalization risks were identified using Kulldorff's circular and Tango's flexible spatial scan statistics and displayed on maps.ResultsThere was a total of 4,938 COVID-19 hospitalizations during the study period. Overall, hospitalization risks were relatively stable from January to July and spiked in the fall. The highest COVID-19 hospitalization risk was observed in November 2020 (153 hospitalizations per 100,000 persons) while the lowest was in March 2020 (4 hospitalizations per 100,000 persons). Counties in the western and central parts of the state tended to have consistently high age-adjusted hospitalization risks, while low age-adjusted hospitalization risks were observed in the east. Significant high hospitalization risk clusters were identified in the north-west and south-central parts of the state.ConclusionsThe findings confirm that geographic disparities in COVID-19 hospitalization risks exist in ND. Specific attention is required to address counties with high hospitalization risks, especially those located in the north-west and south-central parts of ND. Future studies will investigate determinants of the identified disparities in hospitalization risks.
- V
Dataset from Randomized Controlled Trial of Losartan for Patients With...
- data-staging.niaid.nih.gov
- data.niaid.nih.gov
Updated Feb 22, 2025ShareFacebookTwitterEmailClick to copy linkLink copiedCiteUniversity of Minnesota; Christopher Tignanelli, MD; Michael Puskarich, MD, MS (2025). Dataset from Randomized Controlled Trial of Losartan for Patients With COVID-19 Requiring Hospitalization [Dataset]. http://doi.org/10.25934/00007230Unique identifierhttps://doi.org/10.25934/00007230Dataset updatedFeb 22, 2025Dataset provided byUniversity of MinnesotaAuthorsUniversity of Minnesota; Christopher Tignanelli, MD; Michael Puskarich, MD, MSArea coveredUnited StatesVariables measuredDyspnea, Mortality, Viral load, Hypotensive, Renal injury, Intensive Care, Hospitalization, Oxygen Saturation, Respiratory Failure, Oxygen Therapy System, and 6 moreDescriptionThis is a multi-center, double-blinded study of COVID-19 infected patients requiring inpatient hospital admission randomized 1:1 to daily Losartan or placebo for 7 days or hospital discharge.
COVID 19 DATASET TILL 22/2/2022
- kaggle.com
zipUpdated Feb 23, 2022ShareFacebookTwitterEmailClick to copy linkLink copiedCiteTaranveer Singh Anttal (2022). COVID 19 DATASET TILL 22/2/2022 [Dataset]. https://www.kaggle.com/datasets/taranvee/covid-19-dataset-till-2222022zip(9372578 bytes)Available download formatsDataset updatedFeb 23, 2022AuthorsTaranveer Singh AnttalLicenseAttribution 4.0 (CC BY 4.0)https://creativecommons.org/licenses/by/4.0/
License information was derived automaticallyDescriptionData on COVID-19 (coronavirus) by Our World in Data
🗂️ Download our complete COVID-19 dataset : CSV | XLSX | JSON
Our complete COVID-19 dataset is a collection of the COVID-19 data maintained by Our World in Data. We will update it daily throughout the duration of the COVID-19 pandemic (more information on our updating process and schedule here). It includes the following data:
Metrics Source Updated Countries Vaccinations Official data collated by the Our World in Data team Daily 218 Tests & positivity Official data collated by the Our World in Data team Weekly 151 Hospital & ICU Official data collated by the Our World in Data team Daily 47 Confirmed cases JHU CSSE COVID-19 Data Daily 216 Confirmed deaths JHU CSSE COVID-19 Data Daily 216 Reproduction rate Arroyo-Marioli F, Bullano F, Kucinskas S, Rondón-Moreno C Daily 189 Policy responses Oxford COVID-19 Government Response Tracker Daily 186 Other variables of interest International organizations (UN, World Bank, OECD, IHME…) Fixed 241 A specific section of this repository is also dedicated to vaccinations, with a lighter dataset containing only vaccination data.
The data you find here and our data sources
- Confirmed cases and deaths: our data comes from the COVID-19 Data Repository by the Center for Systems Science and Engineering (CSSE) at Johns Hopkins University (JHU). We discuss how and when JHU collects and publishes this data here. The cases & deaths dataset is updated daily. *Note: the number of cases or deaths reported by any institution—including JHU, the WHO, the ECDC and others—on a given day does not necessarily represent the actual number on that date. This is because of the long reporting chain that exists between a new case/death and its inclusion in statistics. This also means that negative values in cases and deaths can sometimes appear when a country corrects historical data, because it had previously overestimated the number of cases/deaths. Alternatively, large changes can sometimes (although rarely) be made to a country's entire time series if JHU decides (and has access to the necessary data) to correct values retrospectively.*
- Hospitalizations and intensive care unit (ICU) admissions: our data is collected from official sources and collated by Our World in Data. The complete list of country-by-country sources is available here.
- Testing for COVID-19: this data is collected by the Our World in Data team from official reports; you can find further details in our post on COVID-19 testing, including our checklist of questions to understand testing data, information on geographical and temporal coverage, and detailed country-by-country source information. The testing dataset is updated around twice a week.
- Vaccinations against COVID-19: this data is collected by the Our World in Data team from official reports.
- Other variables: this data is collected from a variety of sources (United Nations, World Bank, Global Burden of Disease, Blavatnik School of Government, etc.). More information is available in our codebook.
The complete Our World in Data COVID-19 dataset
**Our complete COVID-19 dataset is available in CSV, XLSX, and JSON formats, and inc...
- a
MDCOVID19 TotalNumberReleasedFromIsolation
- data-maryland.opendata.arcgis.com
- data.imap.maryland.gov
- +2more
Updated May 22, 2020+ more versionsShareFacebookTwitterEmailClick to copy linkLink copiedCiteArcGIS Online for Maryland (2020). MDCOVID19 TotalNumberReleasedFromIsolation [Dataset]. https://data-maryland.opendata.arcgis.com/datasets/02cc59cfe5144cdc9844859615ecc412Dataset updatedMay 22, 2020Dataset authored and provided byArcGIS Online for MarylandDescriptionSummaryThe cumulative number of COVID-19 positive Maryland residents who have been released from home isolation.DescriptionThe MD COVID-19 - Total Number Released from Isolation data layer is a collection of the statewide cumulative total of individuals who tested positive for COVID-19 that have been reported each day by each local health department via the ESSENCE system as having been released from home isolation. As "recovery" can mean different things as people experience COVID-19 disease to varying degrees of severity, MDH reports on individuals released from isolation. "Released from isolation" refers to those who have met criteria and are well enough to be released from home isolation. Some of these individuals may have been hospitalized at some point.COVID-19 is a disease caused by a respiratory virus first identified in Wuhan, Hubei Province, China in December 2019. COVID-19 is a new virus that hasn't caused illness in humans before. Worldwide, COVID-19 has resulted in thousands of infections, causing illness and in some cases death. Cases have spread to countries throughout the world, with more cases reported daily. The Maryland Department of Health reports daily on COVID-19 cases by county.
- N
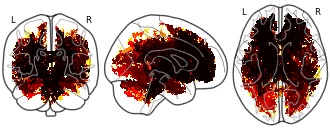
Brain white matter microstructure is altered in previously hospitalized...
- neurovault.org
niftiUpdated Apr 6, 2023+ more versionsShareFacebookTwitterEmailClick to copy linkLink copiedCite(2023). Brain white matter microstructure is altered in previously hospitalized patients with post COVID-19 condition: MRI findings with generalized diffusion encoding: Higher mean diffusivity in patient group compared to control group [Dataset]. http://identifiers.org/neurovault.image:795535niftiAvailable download formatsUnique identifierhttps://identifiers.org/neurovault.image:795535Dataset updatedApr 6, 2023LicenseCC0 1.0 Universal Public Domain Dedicationhttps://creativecommons.org/publicdomain/zero/1.0/
License information was derived automaticallyDescriptionThreshold-free cluster-enhanced p-value images (fully corrected for multiple comparisons across space) showing where mean diffusivity (MD) is significantly higher for the patient group. Note that the image are 1-p for convenience of display, so thresholding at .95 gives significant clusters.
Collection description
There is mounting evidence of the long-term effects of COVID-19 on the central nervous system. However, conventional magnetic resonance imaging (MRI) fails to detect consistent patterns connecting the symptomatology to brain tissue abnormalities. Diffusion MRI (dMRI) exploits the random motion of water molecules to achieve unique sensitivity to structures at the microscopic level. In this work we employ Q-space trajectory imaging (QTI), an advanced diffusion MRI method, to examine the brain white matter of 16 patients previously hospitalized for COVID-19 who experience persisting symptoms compatible with post COVID condition (PCC). We compare this group to a matched control group using the tract-based spatial statistics applied to the scalar maps obtained with QTI. These are fractional anisotropy (FA), microscopic fractional anisotropy (µFA), mean diffusivity (MD), size variance (CMD), and orientational coherence (Cc)). These observed changes can be indicative of vasogenic edema, demyelination, and axonal damage.
Subject species
homo sapiens
Modality
Diffusion MRI
Analysis level
group
Cognitive paradigm (task)
None / Other
Map type
IP
DataSheet_1_The safety of colorectal cancer surgery during the COVID-19: a...
- frontiersin.figshare.com
docxUpdated Jul 17, 2023+ more versionsShareFacebookTwitterEmailClick to copy linkLink copiedCiteQiuxiang Wang; Ruike Wu; Juan Wang; Yilin Li; Qin Xiong; Fengjiao Xie; Peimin Feng (2023). DataSheet_1_The safety of colorectal cancer surgery during the COVID-19: a systematic review and meta-analysis.docx [Dataset]. http://doi.org/10.3389/fonc.2023.1163333.s001docxAvailable download formatsUnique identifierhttps://doi.org/10.3389/fonc.2023.1163333.s001Dataset updatedJul 17, 2023AuthorsQiuxiang Wang; Ruike Wu; Juan Wang; Yilin Li; Qin Xiong; Fengjiao Xie; Peimin FengLicenseAttribution 4.0 (CC BY 4.0)https://creativecommons.org/licenses/by/4.0/
License information was derived automaticallyDescriptionBackgroundThe ongoing coronavirus disease 2019 (COVID-19) pandemic has placed unprecedented pressure on the healthcare systems. This study evaluated the safety of colorectal cancer (CRC) surgery during the COVID-19 pandemic.MethodsA systematic review and meta-analysis were performed according to Preferred Reporting Items for Systematic Reviews and Meta-Analyses (PRISMA) guidelines (PROSPERO ID: CRD 42022327968). Relevant articles were systematically searched in the PubMed, Embase, Web of Science, and Cochrane databases. The postoperative complications, anastomotic leakage, postoperative mortality, 30-day readmission, tumor stage, total hospitalization, postoperative hospitalization, preoperative waiting, operation time, and hospitalization in the intensive care unit (ICU) were compared between the pre-pandemic and during the COVID-19 pandemic periods.ResultsAmong the identified 561 articles, 12 met the inclusion criteria. The data indicated that preoperative waiting time related to CRC surgery was higher during the COVID-19 pandemic (MD, 0.99; 95%CI, 0.71–1.28; p < 0.00001). A similar trend was observed for the total operative time (MD, 25.07; 95%CI, 11.14–39.00; p =0.0004), and on T4 tumor stage during the pandemic (OR, 1.77; 95%CI, 1.22–2.59; p=0.003). However, there was no difference in the postoperative complications, postoperative 90-day mortality, anastomotic leakage, and 30-day readmission times between pre-COVID-19 pandemic and during the COVID-19 pandemic periods. Furthermore, there was no difference in the total hospitalization time, postoperative hospitalization time, and hospitalization time in ICU related to CRC surgery before and during the COVID-19 pandemic.ConclusionThe COVID-19 pandemic did not affect the safety of CRC surgery. The operation of CRC during the COVID-19 pandemic did not increase postoperative complications, postoperative 90-day mortality, anastomotic leakage, 30-day readmission, the total hospitalization time, postoperative hospitalization time, and postoperative ICU hospitalization time. However, the operation of CRC during COVID-19 pandemic increased T4 of tumor stage during the COVID-19 pandemic. Additionally, the preoperative waiting and operation times were longer during the COVID-19 pandemic. This provides a reference for making CRC surgical strategy in the future.Systematic review registrationhttps://www.crd.york.ac.uk/prospero/, identifier CRD42022327968.
- Z
A Randomized, Double Blinded, Placebo-Controlled Clinical Trial Evaluating...
- data.niaid.nih.gov
Updated Feb 2, 2022ShareFacebookTwitterEmailClick to copy linkLink copiedCiteMila B. Ortigoza, MD, PhD; Hyunah Yoon, MD; Keith S Goldfeld, DrPH; Gia F Cobb, MA; Liise-anne Pirofski, MD; for the CONTAIN Study Group (2022). A Randomized, Double Blinded, Placebo-Controlled Clinical Trial Evaluating the Efficacy and Safety of anti-SARS-CoV-2 Convalescent Plasma in Hospitalized Patients (CONTAIN COVID-19) [Dataset]. https://data.niaid.nih.gov/resources?id=zenodo_5652142Dataset updatedFeb 2, 2022Dataset provided byDivision of Infectious Disease, Department of Medicine, Albert Einstein College of Medicine and Montefiore Medical Center, Bronx, NY, USA
Division of Infectious Disease, Department of Medicine, NYU Grossman School of Medicine, New York, NY, USA
Department of Population Health, NYU Grossman School of Medicine, New York, NY, USA
Department of Medicine, NYU Grossman School of Medicine, New York, NY, USAAuthorsMila B. Ortigoza, MD, PhD; Hyunah Yoon, MD; Keith S Goldfeld, DrPH; Gia F Cobb, MA; Liise-anne Pirofski, MD; for the CONTAIN Study GroupDescriptionThis dataset contains de-identified patient data of 941 patients from 21 centers across the United States who were enrolled in the CONTAIN COVID-19 randomized controlled trial that ran from 4/17/2020-3/15/2021. The information in this dataset was used to conduct the analysis reported in the CONTAIN COVID-19 manuscript published in JAMA Internal Medicine (doi: 10.1001/jamainternmed.2021.6850) and includes demographic information, baseline history, baseline medications, baseline laboratory values, clinical status based on the WHO 11-point scale at 14 and 28 days after randomization, antibody titers, randomization arms.
- V
Dataset from A Randomized, Controlled Clinical Trial of the Safety and...
- data.niaid.nih.gov
Updated Mar 26, 2025ShareFacebookTwitterEmailClick to copy linkLink copiedCiteThe Queen's Medical Center; Todd Seto, MD (2025). Dataset from A Randomized, Controlled Clinical Trial of the Safety and Efficacy of Hydroxychloroquine for the Treatment of COVID-19 in Hospitalized Patients [Dataset]. http://doi.org/10.25934/00006595Unique identifierhttps://doi.org/10.25934/00006595Dataset updatedMar 26, 2025Dataset provided byQueen's Medical CenterAuthorsThe Queen's Medical Center; Todd Seto, MDArea coveredUnited StatesVariables measuredMortality, Clinical status, Hospitalization, Mechanical ventilation, Oxygenation MonitoringDescriptionThis study is a randomized, open label clinical trial to evaluate the safety and efficacy of hydroxychloroquine (HCQ) plus usual care compared to usual care in approximately 350 hospitalized patients diagnosed with COVID-19. The study will be a 2-arm, non-blinded comparison between open label hydroxychloroquine and usual care. The course of treatment (HCQ) is five days. Participants will be followed to study day 28.
Demographic, clinical and laboratory patient characteristics stratified by...
- plos.figshare.com
xlsUpdated Jun 9, 2023ShareFacebookTwitterEmailClick to copy linkLink copiedCiteVera Wilke; Mihaly Sulyok; Maria-Ioanna Stefanou; Vivien Richter; Benjamin Bender; Ulrike Ernemann; Ulf Ziemann; Nisar Malek; Katharina Kienzle; Constantin Klein; Stefanie Bunk; Siri Goepel; Annerose Mengel (2023). Demographic, clinical and laboratory patient characteristics stratified by the occurrence of delirium. [Dataset]. http://doi.org/10.1371/journal.pone.0278214.t002xlsAvailable download formatsUnique identifierhttps://doi.org/10.1371/journal.pone.0278214.t002Dataset updatedJun 9, 2023AuthorsVera Wilke; Mihaly Sulyok; Maria-Ioanna Stefanou; Vivien Richter; Benjamin Bender; Ulrike Ernemann; Ulf Ziemann; Nisar Malek; Katharina Kienzle; Constantin Klein; Stefanie Bunk; Siri Goepel; Annerose MengelLicenseAttribution 4.0 (CC BY 4.0)https://creativecommons.org/licenses/by/4.0/
License information was derived automaticallyDescriptionDemographic, clinical and laboratory patient characteristics stratified by the occurrence of delirium.
Overall clinical and laboratory characteristics of the study cohort.
- plos.figshare.com
xlsUpdated Jun 21, 2023+ more versionsShareFacebookTwitterEmailClick to copy linkLink copiedCiteVera Wilke; Mihaly Sulyok; Maria-Ioanna Stefanou; Vivien Richter; Benjamin Bender; Ulrike Ernemann; Ulf Ziemann; Nisar Malek; Katharina Kienzle; Constantin Klein; Stefanie Bunk; Siri Goepel; Annerose Mengel (2023). Overall clinical and laboratory characteristics of the study cohort. [Dataset]. http://doi.org/10.1371/journal.pone.0278214.t001xlsAvailable download formatsUnique identifierhttps://doi.org/10.1371/journal.pone.0278214.t001Dataset updatedJun 21, 2023AuthorsVera Wilke; Mihaly Sulyok; Maria-Ioanna Stefanou; Vivien Richter; Benjamin Bender; Ulrike Ernemann; Ulf Ziemann; Nisar Malek; Katharina Kienzle; Constantin Klein; Stefanie Bunk; Siri Goepel; Annerose MengelLicenseAttribution 4.0 (CC BY 4.0)https://creativecommons.org/licenses/by/4.0/
License information was derived automaticallyDescriptionOverall clinical and laboratory characteristics of the study cohort.
FacebookTwitterU.S. Government Workshttps://www.usa.gov/government-works
License information was derived automatically
NOTE: This layer is deprecated (last updated 3/14/2022). This was formerly a daily update.
Summary The cumulative number of COVID-19 positive Maryland residents who have been hospitalized.
Description The MD COVID-19 - Total Hospitalizations data layer is a collection of the statewide cumulative total of individuals who tested positive for COVID-19 that have been reported each day by each local health department as having been hospitalized. As published to coronavirus.maryland.gov, this is the "Ever Hospitalized" number. "Ever Hospitalized" refers to the cumulative number of individuals who were admitted to the hospital at some point during their COVID-19 illness.
Terms of Use The Spatial Data, and the information therein, (collectively the "Data") is provided "as is" without warranty of any kind, either expressed, implied, or statutory. The user assumes the entire risk as to quality and performance of the Data. No guarantee of accuracy is granted, nor is any responsibility for reliance thereon assumed. In no event shall the State of Maryland be liable for direct, indirect, incidental, consequential or special damages of any kind. The State of Maryland does not accept liability for any damages or misrepresentation caused by inaccuracies in the Data or as a result to changes to the Data, nor is there responsibility assumed to maintain the Data in any manner or form. The Data can be freely distributed as long as the metadata entry is not modified or deleted. Any data derived from the Data must acknowledge the State of Maryland in the metadata.