Countries with the most Facebook users 2025
- statista.com
 Share
Share Facebook
 Twitter
 EmailClick to copy linkLink copiedCiteStatista, Countries with the most Facebook users 2025 [Dataset]. https://www.statista.com/statistics/268136/top-15-countries-based-on-number-of-facebook-users/Time period coveredOct 2025Area coveredWorldwideDescription
As of October 2025, India had the largest Facebook audience worldwide, with over 403 million users. To put this figure into perspective, if India’s Facebook user base were a country, it would rank as the third most populous nation globally. Besides India, three other markets had more than 100 million Facebook users each: the United States, Indonesia and Brazil. Facebook – the most used social media Meta, the company that was previously called Facebook, owns four of the most popular social media platforms worldwide, WhatsApp, Facebook Messenger, Facebook, and Instagram. As of the third quarter of 2021, there were around 3.5 billion cumulative monthly users of the company’s products worldwide. With around 2.9 billion monthly active users, Facebook is the most popular social media worldwide. With an audience of this scale, it is no surprise that the vast majority of Facebook’s revenue is generated through advertising. Facebook usage by device As of July 2021, it was found that 98.5 percent of active users accessed their Facebook account from mobile devices. In fact, almost 81.8 percent of Facebook audiences worldwide access the platform only via mobile phone. Facebook is not only available through mobile browser as the company has published several mobile apps for users to access their products and services. As of the third quarter 2021, the four core Meta products were leading the ranking of most downloaded mobile apps worldwide, with WhatsApp amassing approximately six billion downloads.
U.S. Meta Platform audiences 2025, by age and gender
- statista.com
Updated Apr 25, 2014ShareFacebookTwitterEmailClick to copy linkLink copiedCiteStatista (2014). U.S. Meta Platform audiences 2025, by age and gender [Dataset]. https://www.statista.com/statistics/1319311/us-meta-audience-by-age-and-gender/Dataset updatedApr 25, 2014Time period coveredFeb 2025Area coveredUnited StatesDescriptionAs of February 2025, Meta's largest audience were women and men aged 25 to 34 years, with each group making up 12.2 percent of users, respectively. Overall, less than 15 percent of Meta's audience, which includes platforms Facebook, Instagram, and Messenger, were aged between 65 years and above.
Most downloaded Meta Platforms apps worldwide 2025
- statista.com
Updated Nov 28, 2025ShareFacebookTwitterEmailClick to copy linkLink copiedCiteStatista (2025). Most downloaded Meta Platforms apps worldwide 2025 [Dataset]. https://www.statista.com/statistics/1367142/top-global-meta-app-downloads/Dataset updatedNov 28, 2025Area coveredWorldwideDescriptionIn 2025 to date, Facebook was the most popular Meta Platforms app, generating approximately ***** million downloads from iOS and Google Play Store users during the year. Second-ranked Messenger was downloaded *** million times by global users. Meta AI ranked third, with approximately **** million downloads worldwide during the examined period.
- b
Facebook Revenue and Usage Statistics (2025)
- businessofapps.com
Updated Aug 8, 2017ShareFacebookTwitterEmailClick to copy linkLink copiedCiteBusiness of Apps (2017). Facebook Revenue and Usage Statistics (2025) [Dataset]. https://www.businessofapps.com/data/facebook-statistics/Dataset updatedAug 8, 2017Dataset authored and provided byBusiness of AppsLicenseAttribution-NonCommercial-NoDerivs 4.0 (CC BY-NC-ND 4.0)https://creativecommons.org/licenses/by-nc-nd/4.0/
License information was derived automaticallyDescriptionFacebook probably needs no introduction; nonetheless, here is a quick history of the company. The world’s biggest and most-famous social network was launched by Mark Zuckerberg while he was a...
Facebook: quarterly number of MAU (monthly active users) worldwide 2008-2023...
- statista.com
ShareFacebookTwitterEmailClick to copy linkLink copiedCiteStatista, Facebook: quarterly number of MAU (monthly active users) worldwide 2008-2023 [Dataset]. https://www.statista.com/statistics/264810/number-of-monthly-active-facebook-users-worldwide/Area coveredWorldwideDescriptionWith roughly three billion monthly active users as of the second quarter of 2023, Facebook is the most used online social network worldwide. The platform surpassed two billion active users in the second quarter of 2017, taking just over 13 years to reach this milestone. In comparison, Meta-owned Instagram took 11.2 years, and Google’s YouTube took just over 14 years to achieve this landmark. As of January 2022, Facebook’s leading audience base was in India, with almost 330 million users whilst the United States ranked second with an approximate total of 179 million users. The platform also finds remarkable popularity in Indonesia and Brazil. Social Media usage in the United States In January 2021, Facebook was the platform on which users in the United States spent the most time per day. The average time spent on Facebook was 33 minutes, followed by TikTok with 32 minutes and Twitter with 31 daily minutes. Due to the COVID-19 outbreak in 2020, all major social media platforms saw an increase in daily usage, which then either plateaued or decreased in 2021. At the end of 2021, over a quarter of all Facebook users in the United States belonged to the 25 to 34 year age group and 18.2 percent of users were in the 35 to 44 year age group. In general, Facebook users were more likely to be female. Meta Platforms Meta is Facebook’s recently renamed parent company and had a grand total of 3.59 billion core product users by the final quarter of 2021. Other Meta products include Instagram, Facebook Messenger, WhatsApp and Oculus – Meta’s virtual reality subsidiary which produces VR headsets. In 2021, Meta's revenue amounted to 117 billion US dollars, up from around 86 billion U.S. dollars in the previous financial year.
META Earnings Call Q&A Dataset
- kaggle.com
zipUpdated Nov 19, 2025ShareFacebookTwitterEmailClick to copy linkLink copiedCiteDevaang Barthwal (2025). META Earnings Call Q&A Dataset [Dataset]. https://www.kaggle.com/datasets/devaangbarthwal/meta-earnings-call-q-and-a-datasetzip(376463 bytes)Available download formatsDataset updatedNov 19, 2025AuthorsDevaang BarthwalLicensehttps://creativecommons.org/publicdomain/zero/1.0/https://creativecommons.org/publicdomain/zero/1.0/
Description💬 About Dataset This dataset contains the Analysts Q&A portion of Meta Platforms, Inc. (META) Earnings Call transcripts.
Content: It is a collection of question-and-answer exchanges between financial analysts and Meta executives (such as Mark Zuckerberg, Sheryl Sandberg, and David Wehner) during quarterly earnings calls.
Files: The data is separated into CSV files for specific quarters, for example: META_Q1_2021_qna.csv, META_Q3_2024_qna.csv, etc., allowing for time-series analysis of analyst interest and company responses.
Columns: The files typically include columns for the questioner_name, questioner_organization, the analyst's question, and the corresponding answers from Meta executives.
Topics: The content covers a range of topics discussed during the calls, including financial performance, advertising, social networks, the creator economy, and investment in AR/VR and the Metaverse.
Use Cases: This data is valuable for financial analysis, natural language processing (NLP) tasks, sentiment analysis, and for training Large Language Models (LLMs) to answer finance- or company-specific questions.
The current dataset version contains 22 files and covers earnings call Q&A sessions from Q3 2020 up to Q2 2025.
💡 Project Ideas (NLP & Data Science) Executive Tone and Sentiment Analysis:
Project: Develop a model to classify the sentiment (e.g., optimistic, cautious, concerned) in the answers provided by Meta executives (Mark Zuckerberg, Sheryl Sandberg, etc.) over time.
Goal: Track how the company's tone changes across quarters and correlate it with the stock price (alpha generation) or market events.
Analyst Concern and Topic Modeling:
Project: Use Topic Modeling (like LDA or BERT-based methods) on the analysts' questions to identify the most pressing concerns each quarter (e.g., competition, Metaverse investment, advertising changes, regulatory risk).
Goal: Visualize the evolution of Wall Street's focus on Meta over the years.
Question Answering (QA) System / Financial Chatbot:
Project: Fine-tune a Large Language Model (LLM) like BERT or a transformer model (e.g., FinBERT) on the Q&A pairs to create a specialized Financial AI Agent that can answer questions about Meta's historical priorities and statements, using the dataset as its knowledge base.
Goal: Build a RAG (Retrieval-Augmented Generation) system to quickly extract specific facts and quotes from the transcripts.
Executive Response Style Analysis:
Project: Analyze linguistic features—like readability, word choice, and use of contrastive words—to measure the evasiveness or directness of executive answers when responding to tough analyst questions.
Goal: Predict which questions are most likely to receive a less direct answer.
📈 Use Cases (Finance & Research) Investment Research and Signal Generation:
Use Case: Extract meaningful investment signals. For example, quantifying the frequency of discussion around key topics (like "Reels monetization" or "AI infrastructure") can indicate future company focus and capital allocation.
Benefit: Provides a systematic, data-driven way to supplement traditional financial models.
Competitive and Trend Analysis:
Use Case: Compare the language and themes discussed in Meta's calls with those of key competitors (e.g., Google, Amazon) to understand industry-wide priorities or areas where Meta is gaining or losing ground.
Quantifying Financial Risk:
Use Case: Use NLP to identify and track the mentions and sentiment around negative or uncertain terms (e.g., "headwinds," "supply chain," "regulatory risk") to build an early warning system for potential downside risk management.
Training Domain-Specific LLMs:
Use Case: The structured Q&A data is highly valuable for pre-training or fine-tuning LLMs on financial domain-specific language to improve their ability to understand and generate text in a corporate finance context.
Facebook: number of daily active users worldwide 2011-2023
- koffeekind.store
- statista.com
- +1more
Updated May 22, 2024ShareFacebookTwitterEmailClick to copy linkLink copiedCiteStatista (2024). Facebook: number of daily active users worldwide 2011-2023 [Dataset]. https://koffeekind.store/?_=%2Fstatistics%2F346167%2Ffacebook-global-dau%2F%23Aarz%2FF%2BjY2PiPwGZQx2YJQCt8%2B0C%2BiMhDataset updatedMay 22, 2024Area coveredWorldwideDescriptionDuring the fourth quarter of 2023, the number of daily active users on Facebook reached 2.1 billion, a minor increase on the previous quarter. When compared with the number of daily active users in the final quarter of 2022, the platform has gained around 100 million users. Facebook’s penetration rate for the United States in 2023 was 72.13 percent, up from 71.43 percent in 2022. The social network’s audience reach is projected to stand at 75.79 percent by 2027.
Most popular social media websites
As of May 2021, Facebook was the most used social media site in the United States, accounting for 71.8 percent of all social media visits. Ranking in second place was Pinterest with 12.4 percent, followed by Twitter and Instagram, with 9.15 percent and 3.82 percent, respectively. Although other sites remain popular, Facebook’s number of visits made it undoubtably the leading social media platform in terms of social media site visits.
For Generation Z and Millennials in the United States, Facebook was one of the least popular platforms used to connect with others. Gen Z and Millennials preferred video sharing platforms, specifically Snapchat, TikTok and YouTube.
Meta’s revenue
Facebook Inc was renamed as Meta in 2021, in a strategic step toward the metaverse. Meta Platforms is now the parent company of Facebook, Instagram, Facebook Messenger and WhatsApp amongst others, together being known as Meta’s Family of Apps.
Meta’s annual revenue for 2021 was 117.92 billion U.S. dollars, up from 85.97 billion in 2020. Within a decade, the company has increased its annual revenue by approximately 114 billion U.S. dollars. In the most recent fiscal year, Meta’s Family of Apps were responsible for over 115 billion U.S. dollars’ worth of Meta’s revenue.
- 3
Feed content views from content viewers in the US, broken down by inclusion...
- 360analytika.com
csvUpdated Sep 6, 2025ShareFacebookTwitterEmailClick to copy linkLink copiedCite360 Analytika (2025). Feed content views from content viewers in the US, broken down by inclusion of links and the most-viewed domains [Dataset]. https://360analytika.com/feed-content-views-from-content-viewers-in-the-us-broken-down-by-inclusion-of-links-and-the-most-viewed-domains/csvAvailable download formatsDataset updatedSep 6, 2025Dataset authored and provided by360 AnalytikaLicenseAttribution 4.0 (CC BY 4.0)https://creativecommons.org/licenses/by/4.0/
License information was derived automaticallyDescriptionThe measurement of the type of content that US users interact with the most on social media sites such as Meta’s Facebook and Instagram is known as “feed content views” from content viewers in the US, broken down by the inclusion of links and the most-viewed domains. It keeps track of how frequently postings show up in users’ feeds and are viewed, differentiating between posts with external links (which take users to other websites) and those without (which are updates that are just text, images, or videos). The most-viewed domains—that is, the external websites that get the most traffic from link-sharing on these platforms—are also highlighted. This analysis sheds light on the sources of online content consumption as well as user engagement trends.
📈💸 MAANG share prices 😎🧑💻
- kaggle.com
zipUpdated Nov 9, 2024ShareFacebookTwitterEmailClick to copy linkLink copiedCiteAlexander Kapturov (2024). 📈💸 MAANG share prices 😎🧑💻 [Dataset]. https://www.kaggle.com/datasets/kapturovalexander/maang-share-prices-till-february-2024/versions/8/datazip(645623 bytes)Available download formatsDataset updatedNov 9, 2024AuthorsAlexander KapturovLicensehttps://creativecommons.org/publicdomain/zero/1.0/https://creativecommons.org/publicdomain/zero/1.0/
Description🏦 Share prices of technological giants: Meta, Apple, Amazon, Netflix and Google till February 2024
Meta (share prices since 2013 - 02.2024)
Meta Platforms, Inc., doing business as Meta, and formerly named Facebook, Inc., and The Facebook, Inc., is an American multinational technology conglomerate based in Menlo Park, California. The company owns and operates Facebook, Instagram, Threads, and WhatsApp, among other products and services. Meta ranks among the largest American information technology companies, alongside other Big Five corporations Alphabet (Google), Amazon, Apple, and Microsoft. The company was ranked #31 on the Forbes Global 2000 ranking in 2023.
https://www.googleapis.com/download/storage/v1/b/kaggle-user-content/o/inbox%2F10074224%2F0092cfb5e21b4649fead60c2b969b799%2Fmeta.webp?generation=1708923032286895&alt=media" alt="">
Apple (share prices since 1981 - 02.2024)
Apple Inc. (formerly Apple Computer, Inc.) is an American multinational technology company headquartered in Cupertino, California, in Silicon Valley. It designs, develops, and sells consumer electronics, computer software, and online services. Devices include the iPhone, iPad, Mac, Apple Watch, and Apple TV; operating systems include iOS, iPadOS, and macOS; and software applications and services include iTunes, iCloud, and Apple Music.
As of March 2023, Apple was the world's largest company by market capitalization, but it lost this position to Microsoft in January 2024. In 2022, it was the largest technology company by revenue, with US$394.3 billion. As of June 2022, Apple was the fourth-largest personal computer vendor by unit sales, the largest manufacturing company by revenue, and the second-largest manufacturer of mobile phones in the world. It is one of the Big Five American information technology companies, alongside Alphabet (the parent company of Google), Amazon, Meta (the parent company of Facebook), and Microsoft.
https://www.googleapis.com/download/storage/v1/b/kaggle-user-content/o/inbox%2F10074224%2F355fd858e8cf894c85d34012937de7cb%2Fmaxresdefault.jpg?generation=1708925753123441&alt=media" alt="">
Amazon (share prices since 1998 - 02.2024)
Amazon.com, Inc., doing business as Amazon, is an American multinational technology company focusing on e-commerce, cloud computing, online advertising, digital streaming, and artificial intelligence. It is considered one of the Big Five Am
https://www.googleapis.com/download/storage/v1/b/kaggle-user-content/o/inbox%2F10074224%2F8c7eaaa939f4afa87230e4cfc7a73965%2F02.webp?generation=1708925895528644&alt=media" alt="">erican technology companies; the other four are Alphabet (parent company of Google), Apple, Meta (parent company of Facebook), and Microsoft.
Netflix (share prices since 2003 - 02.2024)
Netflix is an American subscription video on-demand over-the-top streaming service. The service primarily distributes original and acquired films and television shows from various genres, and it is available internationally in multiple languages.
Launched on January 16, 2007, nearly a decade after Netflix, Inc. began its pioneering DVD‑by‑mail movie rental service, Netflix is the most-subscribed video on demand streaming media service, with 260.28 million paid memberships in more than 190 countries as of January 2024. By 2022, "Netflix Original" productions accounted for half of its library in the United States and the namesake company had ventured into other categories, such as video game publishing of mobile games via its flagship service. As of October 2023, Netflix is the 24th most-visited website in the world with 23.66% of its traffic coming from the United States, followed by the United Kingdom at 5.84% and Brazil at 5.64%.
https://www.googleapis.com/download/storage/v1/b/kaggle-user-content/o/inbox%2F10074224%2F98710ac371805da8047b14bbd5f73b2e%2Fhppsunsetbronsonicon_1200xx4905-2759-184-0.jpg?generation=1708926012776496&alt=media" alt="">
Google (share prices since 2005 - 02.2024)
Google LLC (Alphabet Inc.) is an American multinational technology company focusing on artificial intelligence, online advertising, search engine technology, cloud computing, computer software, quantum computing, e-commerce, and consumer electronics. It has been referred to as "the most powerful company in the world" and as one of the world's most valuable brands due to its market dominance, data collection, and technological advantages in the field of artificial intelligence. Google's parent company Alphabet Inc. is one of the five Big Tech companies, alongside Amazon, Apple, Meta, and Microsoft.
https://www.googleapis.com/download/storage/v1/b/kaggle-user-content/o/inbox%2F10074224%2F86a517c27caafb1d081b4facc0752a9d%2FGoogle%20HQ.jpg?generation=1708926639236016&alt=media" alt="">
- G
Meta-Learning Market Research Report 2033
- growthmarketreports.com
csv, pdf, pptxUpdated Aug 23, 2025ShareFacebookTwitterEmailClick to copy linkLink copiedCiteGrowth Market Reports (2025). Meta-Learning Market Research Report 2033 [Dataset]. https://growthmarketreports.com/report/meta-learning-marketpdf, csv, pptxAvailable download formatsDataset updatedAug 23, 2025Dataset authored and provided byGrowth Market ReportsTime period covered2024 - 2032Area coveredGlobalDescriptionMeta-Learning Market Outlook
According to our latest research, the global meta-learning market size in 2024 stands at USD 1.8 billion, reflecting a robust momentum in artificial intelligence-driven solutions across industries. The market is experiencing a remarkable compound annual growth rate (CAGR) of 41.2% from 2025 to 2033, driven by the escalating demand for adaptive, efficient, and scalable machine learning systems. By 2033, the meta-learning market is forecasted to reach an impressive USD 39.6 billion, as per our comprehensive analysis. The primary growth factor propelling the market is the increasing necessity for AI models that can learn from minimal data and rapidly adapt to new tasks, thereby enhancing operational efficiency and innovation across multiple sectors.
One of the most significant growth drivers for the meta-learning market is the exponential rise in the deployment of artificial intelligence and machine learning technologies across diverse industry verticals. Businesses are seeking advanced solutions that can automate model selection, hyperparameter tuning, and feature engineering, which are often labor-intensive and require deep expertise. Meta-learning, often referred to as "learning to learn," empowers organizations to build models that generalize better and adapt swiftly to evolving data environments. The proliferation of big data, coupled with the need for real-time analytics, is prompting enterprises to invest in meta-learning frameworks, which can efficiently handle dynamic and heterogeneous datasets. Additionally, the integration of meta-learning with edge computing and IoT devices is opening new avenues for intelligent automation and predictive analytics, further accelerating market expansion.
Another pivotal factor fueling the growth of the meta-learning market is the increasing adoption of AI-driven personalization in sectors such as healthcare, finance, retail, and education. In healthcare, meta-learning enables the development of adaptive diagnostic tools that can learn from limited patient data and offer personalized treatment recommendations. In finance, it facilitates fraud detection models that can quickly adjust to new fraudulent patterns. Retailers are leveraging meta-learning to optimize customer experiences through tailored product recommendations and dynamic pricing strategies. The education sector is also witnessing a surge in the use of meta-learning-powered adaptive learning platforms that cater to individual learning paths. This widespread application landscape, supported by advancements in deep learning and neural network architectures, is significantly contributing to the rapid adoption of meta-learning solutions globally.
The growing collaboration between academia, technology providers, and enterprises is another key factor driving the meta-learning market. Major technology companies are investing heavily in research and development to enhance the capabilities of meta-learning algorithms and platforms. Open-source initiatives and the availability of pre-trained models are encouraging small and medium enterprises (SMEs) to experiment with meta-learning without incurring prohibitive costs. Furthermore, the increasing focus on explainable AI and model transparency is fostering trust among end-users, which is crucial for the widespread adoption of meta-learning in regulated industries such as BFSI and healthcare. The evolving regulatory landscape, aimed at ensuring ethical AI deployment, is also shaping the market dynamics by promoting responsible innovation and compliance.
From a regional perspective, North America currently dominates the meta-learning market, accounting for the largest revenue share in 2024, followed by Europe and Asia Pacific. The presence of leading AI research institutions, high technology adoption rates, and substantial investments in AI infrastructure are key factors underpinning North America's leadership. Europe is witnessing significant growth, driven by robust government initiatives and a thriving startup ecosystem. Meanwhile, Asia Pacific is emerging as the fastest-growing region, propelled by rapid digital transformation, increasing investments in AI and machine learning, and the expanding presence of global technology vendors. The regional outlook for the meta-learning market remains highly optimistic, with each region contributing uniquely to the overall market expansion.<a href=" - N
Meta, MO Age Group Population Dataset: A complete breakdown of Meta age...
- neilsberg.com
csv, jsonUpdated Sep 16, 2023+ more versionsShareFacebookTwitterEmailClick to copy linkLink copiedCiteNeilsberg Research (2023). Meta, MO Age Group Population Dataset: A complete breakdown of Meta age demographics from 0 to 85 years, distributed across 18 age groups [Dataset]. https://www.neilsberg.com/research/datasets/70c0a7a7-3d85-11ee-9abe-0aa64bf2eeb2/csv, jsonAvailable download formatsDataset updatedSep 16, 2023Dataset authored and provided byNeilsberg ResearchLicenseAttribution 4.0 (CC BY 4.0)https://creativecommons.org/licenses/by/4.0/
License information was derived automaticallyArea coveredMeta, MissouriVariables measuredPopulation Under 5 Years, Population over 85 years, Population Between 5 and 9 years, Population Between 10 and 14 years, Population Between 15 and 19 years, Population Between 20 and 24 years, Population Between 25 and 29 years, Population Between 30 and 34 years, Population Between 35 and 39 years, Population Between 40 and 44 years, and 9 moreMeasurement techniqueThe data presented in this dataset is derived from the latest U.S. Census Bureau American Community Survey (ACS) 2017-2021 5-Year Estimates. To measure the two variables, namely (a) population and (b) population as a percentage of the total population, we initially analyzed and categorized the data for each of the age groups. For age groups we divided it into roughly a 5 year bucket for ages between 0 and 85. For over 85, we aggregated data into a single group for all ages. For further information regarding these estimates, please feel free to reach out to us via email at research@neilsberg.com.Dataset funded byNeilsberg ResearchDescriptionAbout this dataset
Context
The dataset tabulates the Meta population distribution across 18 age groups. It lists the population in each age group along with the percentage population relative of the total population for Meta. The dataset can be utilized to understand the population distribution of Meta by age. For example, using this dataset, we can identify the largest age group in Meta.
Key observations
The largest age group in Meta, MO was for the group of age 55-59 years with a population of 20 (13.25%), according to the 2021 American Community Survey. At the same time, the smallest age group in Meta, MO was the 20-24 years with a population of 0 (0.00%). Source: U.S. Census Bureau American Community Survey (ACS) 2017-2021 5-Year Estimates.
Content
When available, the data consists of estimates from the U.S. Census Bureau American Community Survey (ACS) 2017-2021 5-Year Estimates.
Age groups:
- Under 5 years
- 5 to 9 years
- 10 to 14 years
- 15 to 19 years
- 20 to 24 years
- 25 to 29 years
- 30 to 34 years
- 35 to 39 years
- 40 to 44 years
- 45 to 49 years
- 50 to 54 years
- 55 to 59 years
- 60 to 64 years
- 65 to 69 years
- 70 to 74 years
- 75 to 79 years
- 80 to 84 years
- 85 years and over
Variables / Data Columns
- Age Group: This column displays the age group in consideration
- Population: The population for the specific age group in the Meta is shown in this column.
- % of Total Population: This column displays the population of each age group as a proportion of Meta total population. Please note that the sum of all percentages may not equal one due to rounding of values.
Good to know
Margin of Error
Data in the dataset are based on the estimates and are subject to sampling variability and thus a margin of error. Neilsberg Research recommends using caution when presening these estimates in your research.
Custom data
If you do need custom data for any of your research project, report or presentation, you can contact our research staff at research@neilsberg.com for a feasibility of a custom tabulation on a fee-for-service basis.
Inspiration
Neilsberg Research Team curates, analyze and publishes demographics and economic data from a variety of public and proprietary sources, each of which often includes multiple surveys and programs. The large majority of Neilsberg Research aggregated datasets and insights is made available for free download at https://www.neilsberg.com/research/.
Recommended for further research
This dataset is a part of the main dataset for Meta Population by Age. You can refer the same here
Coastal final ecosystem goods and services (FEGS) and habitats meta-analysis...
- catalog.data.gov
- datasets.ai
Updated Nov 12, 2020ShareFacebookTwitterEmailClick to copy linkLink copiedCiteU.S. EPA Office of Research and Development (ORD) (2020). Coastal final ecosystem goods and services (FEGS) and habitats meta-analysis data file [Dataset]. https://catalog.data.gov/dataset/coastal-final-ecosystem-goods-and-services-fegs-and-habitats-meta-analysis-data-fileDataset updatedNov 12, 2020DescriptionCoastal ecosystem goods and services (EGS) have steadily gained traction in the scientific literature over the last few decades, providing a wealth of information about underlying coastal habitat dependencies. This meta-analysis summarizes relationships between coastal habitats and final ecosystem goods and services (FEGS) users. Through a “weight of evidence” approach synthesizing information from published literature, we assessed habitat classes most relevant to coastal users. Approximately 2800 coastal EGS journal articles were identified by online search engines, of which 16% addressed linkages between specific coastal habitats and FEGS users, and were retained for subsequent analysis. Recreational (83%) and industrial (35%) users were most cited in literature, with experiential-users/hikers and commercial fishermen most prominent in each category, respectively. Recreational users were linked to the widest diversity of coastal habitat subclasses (i.e., 22 of 26). Whereas, mangroves and emergent wetlands were most relevant for property owners. We urge EGS studies to continue surveying local users and identifying habitat dependencies, as these steps are important precursors for developing appropriate coastal FEGS metrics and facilitating local valuation. In addition, understanding how habitats contribute to human well-being may assist communities in prioritizing restoration and evaluating development scenarios in the context of future ecosystem service delivery. This dataset is associated with the following publication: Littles, C., C. Jackson, T. DeWitt, and M. Harwell. Linking People to Coastal Habitats: A meta-analysis of final ecosystem goods and services (FEGS) on the coast. Ocean & Coastal Management. Elsevier, Shannon, IRELAND, 165: 356-369, (2018).
- f
Major themes covered by meta-research.
- datasetcatalog.nlm.nih.gov
- plos.figshare.com
- +1more
Updated Oct 2, 2015ShareFacebookTwitterEmailClick to copy linkLink copiedCiteFanelli, Daniele; Goodman, Steven N.; Ioannidis, John P. A.; Dunne, Debbie Drake (2015). Major themes covered by meta-research. [Dataset]. https://datasetcatalog.nlm.nih.gov/dataset?q=0001924138Dataset updatedOct 2, 2015AuthorsFanelli, Daniele; Goodman, Steven N.; Ioannidis, John P. A.; Dunne, Debbie DrakeDescriptionMajor themes covered by meta-research.
- N
Meta, MO Population Breakdown By Race (Excluding Ethnicity) Dataset:...
- neilsberg.com
csv, jsonUpdated Feb 21, 2025+ more versionsShareFacebookTwitterEmailClick to copy linkLink copiedCiteNeilsberg Research (2025). Meta, MO Population Breakdown By Race (Excluding Ethnicity) Dataset: Population Counts and Percentages for 7 Racial Categories as Identified by the US Census Bureau // 2025 Edition [Dataset]. https://www.neilsberg.com/research/datasets/75862a2c-ef82-11ef-9e71-3860777c1fe6/csv, jsonAvailable download formatsDataset updatedFeb 21, 2025Dataset authored and provided byNeilsberg ResearchLicenseAttribution 4.0 (CC BY 4.0)https://creativecommons.org/licenses/by/4.0/
License information was derived automaticallyArea coveredMetaVariables measuredAsian Population, Black Population, White Population, Some other race Population, Two or more races Population, American Indian and Alaska Native Population, Asian Population as Percent of Total Population, Black Population as Percent of Total Population, White Population as Percent of Total Population, Native Hawaiian and Other Pacific Islander Population, and 4 moreMeasurement techniqueThe data presented in this dataset is derived from the latest U.S. Census Bureau American Community Survey (ACS) 2019-2023 5-Year Estimates. To measure the two variables, namely (a) population and (b) population as a percentage of the total population, we initially analyzed and categorized the data for each of the racial categories idetified by the US Census Bureau. It is ensured that the population estimates used in this dataset pertain exclusively to the identified racial categories, and do not rely on any ethnicity classification. For further information regarding these estimates, please feel free to reach out to us via email at research@neilsberg.com.Dataset funded byNeilsberg ResearchDescriptionAbout this dataset
Context
The dataset tabulates the population of Meta by race. It includes the population of Meta across racial categories (excluding ethnicity) as identified by the Census Bureau. The dataset can be utilized to understand the population distribution of Meta across relevant racial categories.
Key observations
The percent distribution of Meta population by race (across all racial categories recognized by the U.S. Census Bureau): 90.63% are white and 9.38% are multiracial.
Content
When available, the data consists of estimates from the U.S. Census Bureau American Community Survey (ACS) 2019-2023 5-Year Estimates.
Racial categories include:
- White
- Black or African American
- American Indian and Alaska Native
- Asian
- Native Hawaiian and Other Pacific Islander
- Some other race
- Two or more races (multiracial)
Variables / Data Columns
- Race: This column displays the racial categories (excluding ethnicity) for the Meta
- Population: The population of the racial category (excluding ethnicity) in the Meta is shown in this column.
- % of Total Population: This column displays the percentage distribution of each race as a proportion of Meta total population. Please note that the sum of all percentages may not equal one due to rounding of values.
Good to know
Margin of Error
Data in the dataset are based on the estimates and are subject to sampling variability and thus a margin of error. Neilsberg Research recommends using caution when presening these estimates in your research.
Custom data
If you do need custom data for any of your research project, report or presentation, you can contact our research staff at research@neilsberg.com for a feasibility of a custom tabulation on a fee-for-service basis.
Inspiration
Neilsberg Research Team curates, analyze and publishes demographics and economic data from a variety of public and proprietary sources, each of which often includes multiple surveys and programs. The large majority of Neilsberg Research aggregated datasets and insights is made available for free download at https://www.neilsberg.com/research/.
Recommended for further research
This dataset is a part of the main dataset for Meta Population by Race & Ethnicity. You can refer the same here
- e
Biochar Meta-analysis Database
- catalogue.ejpsoil.eu
- repository.soilwise-he.eu
- +1more
Updated Jan 1, 2012ShareFacebookTwitterEmailClick to copy linkLink copiedCite(2012). Biochar Meta-analysis Database [Dataset]. https://catalogue.ejpsoil.eu/collections/metadata:main/items/biochar-meta-analysis-databaseDataset updatedJan 1, 2012DescriptionData (2011) associated to the publication "A quantitative review of the effects of biochar application to soils on crop productivity using meta-analysis. Agriculture, Ecosystems and Environment. Volume 144, Issue 1, November 2011, Pages 175-187"
Largest Meta advertisers in the U.S. 2018-2022
- statista.com
Updated May 15, 2024ShareFacebookTwitterEmailClick to copy linkLink copiedCiteStatista (2024). Largest Meta advertisers in the U.S. 2018-2022 [Dataset]. https://www.statista.com/statistics/1250606/facebook-advertisers/Dataset updatedMay 15, 2024Time period coveredNov 29, 2018 - Apr 24, 2022Area coveredUnited StatesDescriptionBetween November 2018 and April 2022, Mike Bloomberg 2020, Inc. was the largest Meta advertiser in the United States, with a spending of ***** million U.S. dollars. Trump Make America Great Again Committee ranked second, with an expenditure of ***** million.
- N
Median Household Income by Racial Categories in Meta, MO (, in 2023...
- neilsberg.com
csv, jsonUpdated Mar 1, 2025+ more versionsShareFacebookTwitterEmailClick to copy linkLink copiedCiteNeilsberg Research (2025). Median Household Income by Racial Categories in Meta, MO (, in 2023 inflation-adjusted dollars) [Dataset]. https://www.neilsberg.com/insights/meta-mo-median-household-income-by-race/json, csvAvailable download formatsDataset updatedMar 1, 2025Dataset authored and provided byNeilsberg ResearchLicenseAttribution 4.0 (CC BY 4.0)https://creativecommons.org/licenses/by/4.0/
License information was derived automaticallyArea coveredMeta, MissouriVariables measuredMedian Household Income for Asian Population, Median Household Income for Black Population, Median Household Income for White Population, Median Household Income for Some other race Population, Median Household Income for Two or more races Population, Median Household Income for American Indian and Alaska Native Population, Median Household Income for Native Hawaiian and Other Pacific Islander PopulationMeasurement techniqueThe data presented in this dataset is derived from the latest U.S. Census Bureau American Community Survey (ACS) 2019-2023 5-Year Estimates. To portray the median household income within each racial category idetified by the US Census Bureau, we conducted an initial analysis and categorization of the data. Subsequently, we adjusted these figures for inflation using the Consumer Price Index retroactive series via current methods (R-CPI-U-RS). It is important to note that the median household income estimates exclusively represent the identified racial categories and do not incorporate any ethnicity classifications. Households are categorized, and median incomes are reported based on the self-identified race of the head of the household. For additional information about these estimations, please contact us via email at research@neilsberg.comDataset funded byNeilsberg ResearchDescriptionAbout this dataset
Context
The dataset presents the median household income across different racial categories in Meta. It portrays the median household income of the head of household across racial categories (excluding ethnicity) as identified by the Census Bureau. The dataset can be utilized to gain insights into economic disparities and trends and explore the variations in median houshold income for diverse racial categories.
Key observations
Based on our analysis of the distribution of Meta population by race & ethnicity, the population is predominantly White. This particular racial category constitutes the majority, accounting for 90.63% of the total residents in Meta. Notably, the median household income for White households is $45,500. Interestingly, White is both the largest group and the one with the highest median household income, which stands at $45,500.
Content
When available, the data consists of estimates from the U.S. Census Bureau American Community Survey (ACS) 2019-2023 5-Year Estimates.
Racial categories include:
- White
- Black or African American
- American Indian and Alaska Native
- Asian
- Native Hawaiian and Other Pacific Islander
- Some other race
- Two or more races (multiracial)
Variables / Data Columns
- Race of the head of household: This column presents the self-identified race of the household head, encompassing all relevant racial categories (excluding ethnicity) applicable in Meta.
- Median household income: Median household income, adjusting for inflation, presented in 2023-inflation-adjusted dollars
Good to know
Margin of Error
Data in the dataset are based on the estimates and are subject to sampling variability and thus a margin of error. Neilsberg Research recommends using caution when presening these estimates in your research.
Custom data
If you do need custom data for any of your research project, report or presentation, you can contact our research staff at research@neilsberg.com for a feasibility of a custom tabulation on a fee-for-service basis.
Inspiration
Neilsberg Research Team curates, analyze and publishes demographics and economic data from a variety of public and proprietary sources, each of which often includes multiple surveys and programs. The large majority of Neilsberg Research aggregated datasets and insights is made available for free download at https://www.neilsberg.com/research/.
Recommended for further research
This dataset is a part of the main dataset for Meta median household income by race. You can refer the same here
- R
META OLED Panel Market Research Report 2033
- researchintelo.com
csv, pdf, pptxUpdated Sep 30, 2025ShareFacebookTwitterEmailClick to copy linkLink copiedCiteResearch Intelo (2025). META OLED Panel Market Research Report 2033 [Dataset]. https://researchintelo.com/report/meta-oled-panel-marketpptx, pdf, csvAvailable download formatsDataset updatedSep 30, 2025Dataset authored and provided byResearch InteloLicensehttps://researchintelo.com/privacy-and-policyhttps://researchintelo.com/privacy-and-policy
Time period covered2024 - 2033Area coveredGlobalDescriptionMETA OLED Panel Market Outlook
According to our latest research, the Global META OLED Panel market size was valued at $12.8 billion in 2024 and is projected to reach $48.3 billion by 2033, expanding at an impressive CAGR of 16.2% during the forecast period of 2025–2033. A major factor fueling the robust growth of this market globally is the rapid adoption of advanced display technologies across consumer electronics, automotive, and industrial sectors. META OLED panels, with their superior brightness, energy efficiency, and form factor flexibility, are increasingly being integrated into next-generation devices, driving demand and fostering innovation throughout the value chain.Regional Outlook
North America currently holds the largest share of the META OLED Panel market, accounting for approximately 36% of global revenue in 2024. This dominance is primarily attributed to the region’s mature consumer electronics industry, high disposable incomes, and a robust ecosystem of technology innovators and early adopters. The presence of leading OEMs and display panel manufacturers, coupled with aggressive investments in research and development, has positioned North America at the forefront of META OLED panel adoption. Additionally, favorable regulatory policies supporting energy-efficient and sustainable display technologies have further accelerated the integration of META OLED panels in applications ranging from smartphones and televisions to automotive displays and healthcare devices.
The Asia Pacific region is emerging as the fastest-growing market for META OLED panels, projected to register a remarkable CAGR of 18.7% from 2025 to 2033. This growth trajectory is driven by the region’s expanding manufacturing base, especially in countries like China, South Korea, and Japan, which are home to some of the world’s largest display panel producers. The surge in consumer demand for premium electronic devices, coupled with significant investments in display technology infrastructure and government incentives for high-tech manufacturing, is propelling adoption across both consumer and industrial segments. The proliferation of 5G-enabled smartphones, smart wearables, and automotive infotainment systems is further catalyzing market expansion in Asia Pacific.
In contrast, emerging economies in Latin America, the Middle East, and Africa are experiencing a gradual uptake of META OLED panels, primarily due to localized demand patterns and infrastructural challenges. While these regions offer substantial growth potential, factors such as limited access to advanced manufacturing technologies, import dependency, and fluctuating regulatory environments pose adoption challenges. However, increasing urbanization, rising middle-class populations, and government initiatives to promote digitalization are expected to gradually stimulate demand for META OLED panels in these markets over the forecast period.Report Scope
Attributes Details Report Title META OLED Panel Market Research Report 2033 By Product Type Flexible OLED Panels, Rigid OLED Panels, Transparent OLED Panels, Others By Application Smartphones, Televisions, Wearable Devices, Automotive Displays, Tablets & Laptops, Others By Technology AMOLED, PMOLED, Others By End-User Consumer Electronics, Automotive, Healthcare, Industrial, Others Regions Covered North America, Europe, Asia Pacific, Latin America and Middle East & Africa Countries Covered North America (U.S., Canada), Europe (Germany, France, Italy, U.K., Spain, Russia, Rest of Europe), Asia Pacific&l 人格和信息共享编码Data.xlsx
- figshare.com
xlsxUpdated May 14, 2024ShareFacebookTwitterEmailClick to copy linkLink copiedCiteWenjie Zhou (2024). 人格和信息共享编码Data.xlsx [Dataset]. http://doi.org/10.6084/m9.figshare.25814725.v1xlsxAvailable download formatsUnique identifierhttps://doi.org/10.6084/m9.figshare.25814725.v1Dataset updatedMay 14, 2024AuthorsWenjie ZhouLicenseAttribution 4.0 (CC BY 4.0)https://creativecommons.org/licenses/by/4.0/
License information was derived automaticallyDescriptionA meta-analysis on the relationship between the Big Five personality traits and online information sharing
- N
Meta-Analysis of 89 Structural MRI Studies in Posttraumatic Stress Disorder...
- neurovault.org
niftiUpdated Jul 20, 2018+ more versionsShareFacebookTwitterEmailClick to copy linkLink copiedCite(2018). Meta-Analysis of 89 Structural MRI Studies in Posttraumatic Stress Disorder and Comparison With Major Depressive Disorder: Meta-analysis result from 13 VBM studies: Thresholded Z map to match figure 2. Postive values are reduction in gray matter volume [Dataset]. http://identifiers.org/neurovault.image:65629niftiAvailable download formatsUnique identifierhttps://identifiers.org/neurovault.image:65629Dataset updatedJul 20, 2018LicenseCC0 1.0 Universal Public Domain Dedicationhttps://creativecommons.org/publicdomain/zero/1.0/
License information was derived automaticallyDescriptionThe following inclusion criteria were applied to the database of 113 studies: 1) gray matter VBM study comparing adult patients with PTSD to either non-traumatised-controls or traumatised-controls; 2) results presented in Talairach or MNI coordinates; 3) studies were only included if a whole brain analysis was performed rather than a small volume correction to ensure no bias in the regions reported. Thirteen studies met inclusion criteria and are listed in Table S1. We emailed all study authors who used SPM (Statistical Parametric Mapping) to process their data for a ‘T-map’ image comparing PTSD gray matter volume to the control group. ‘T-maps’ are three dimensional maps comprising statistical data of volume differences in thousands of voxels in the brain and provide far more detailed information than significant coordinates reported in studies. However, SDM allows both T-maps and coordinates to be combined in a single meta-analysis and the methodology reported in detail by Radua et al.8 We received 6 T-maps from 6 independent studies and these were included in the meta-analyses. In addition to the main meta-analysis comparing PTSD to all controls, three additional VBM analyses were conducted: 1) comparing the PTSD group with non-traumatised-controls only 2) comparing the PTSD group with traumatised-controls only, 3) comparing PTSD group with all controls and widening the criteria to include paediatric studies. T-maps and coordinates signifying gray matter volume changes from where we were unable to obtain T-maps were extracted from relevant studies and analysed using Seed-based d Mapping (SDM version 5.14, http://www.sdmproject.com). For studies where coordinate data was used, these were convolved with a Gaussian kernel (FWHM=20mm) in order to optimally compensate the sensitivity and specificity of the analysis. As is standard in SDM analyses, the number of randomizations were set to 100 and a threshold was set at p<0.005 as well as a cluster-level threshold of 10 voxels in order to increase sensitivity and correctly control false-positive rate.8 A jackknife sensitivity analysis was performed in order to assess the robustness of the results which was achieved by excluding one study in each of the analyses.
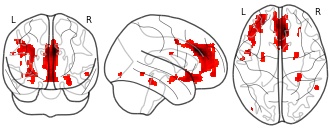
Collection description
OBJECTIVE:
The authors conducted a comprehensive meta-analysis of MRI region-of-interest and voxel-based morphometry (VBM) studies in posttraumatic stress disorder (PTSD). Because patients have high rates of comorbid depression, an additional objective was to compare the findings to a meta-analysis of MRI studies in depression.METHOD:
The MEDLINE database was searched for studies from 1985 through 2016. A total of 113 studies met inclusion criteria and were included in an online database. Of these, 66 were selected for the region-of-interest meta-analysis and 13 for the VBM meta-analysis. The region-of-interest meta-analysis was conducted and compared with a meta-analysis of major depressive disorder. Within the region-of-interest meta-analysis, three subanalyses were conducted that included control groups with and without trauma.RESULTS:
In the region-of-interest meta-analysis, patients with PTSD compared with all control subjects were found to have reduced brain volume, intracranial volume, and volumes of the hippocampus, insula, and anterior cingulate. PTSD patients compared with nontraumatized or traumatized control subjects showed similar changes. Traumatized compared with nontraumatized control subjects showed smaller volumes of the hippocampus bilaterally. For all regions, pooled effect sizes (Hedges' g) varied from -0.84 to 0.43, and number of studies from three to 41. The VBM meta-analysis revealed prominent volumetric reductions in the medial prefrontal cortex, including the anterior cingulate. Compared with region-of-interest data from patients with major depressive disorder, those with PTSD had reduced total brain volume, and both disorders were associated with reduced hippocampal volume.CONCLUSIONS:
The meta-analyses revealed structural brain abnormalities associated with PTSD and trauma and suggest that global brain volume reductions distinguish PTSD from major depression.Subject species
homo sapiens
Modality
Structural MRI
Analysis level
meta-analysis
Cognitive paradigm (task)
2nd-order rule acquisition
Map type
R
FacebookTwitterCountries with the most Facebook users 2025
As of October 2025, India had the largest Facebook audience worldwide, with over 403 million users. To put this figure into perspective, if India’s Facebook user base were a country, it would rank as the third most populous nation globally. Besides India, three other markets had more than 100 million Facebook users each: the United States, Indonesia and Brazil. Facebook – the most used social media Meta, the company that was previously called Facebook, owns four of the most popular social media platforms worldwide, WhatsApp, Facebook Messenger, Facebook, and Instagram. As of the third quarter of 2021, there were around 3.5 billion cumulative monthly users of the company’s products worldwide. With around 2.9 billion monthly active users, Facebook is the most popular social media worldwide. With an audience of this scale, it is no surprise that the vast majority of Facebook’s revenue is generated through advertising. Facebook usage by device As of July 2021, it was found that 98.5 percent of active users accessed their Facebook account from mobile devices. In fact, almost 81.8 percent of Facebook audiences worldwide access the platform only via mobile phone. Facebook is not only available through mobile browser as the company has published several mobile apps for users to access their products and services. As of the third quarter 2021, the four core Meta products were leading the ranking of most downloaded mobile apps worldwide, with WhatsApp amassing approximately six billion downloads.