The equal-time correlation between an IMF of the full time series and that...
- plos.figshare.com
xlsUpdated Jun 9, 2023 Share
Share Facebook
 Twitter
 EmailClick to copy linkLink copiedCiteFang-Yan Ouyang; Bo Zheng; Xiong-Fei Jiang (2023). The equal-time correlation between an IMF of the full time series and that of the new time series. [Dataset]. http://doi.org/10.1371/journal.pone.0139420.t001xlsAvailable download formatsUnique identifierhttps://doi.org/10.1371/journal.pone.0139420.t001Dataset updatedJun 9, 2023AuthorsFang-Yan Ouyang; Bo Zheng; Xiong-Fei JiangLicense
Attribution 4.0 (CC BY 4.0)https://creativecommons.org/licenses/by/4.0/
License information was derived automaticallyDescriptionThe new time series are generated by removing the large volatilities, i.e., ∣r∣ > 8σ for the SHCI and SZCI indices, and ∣r∣ > 2σ for the S&P 500, DAX, HSI and TWII indices.
- d
Mode - Contracts + Projects + Functions
- dune.com
Updated Sep 2, 2024ShareFacebookTwitterEmailClick to copy linkLink copiedCitemacieku (2024). Mode - Contracts + Projects + Functions [Dataset]. https://dune.com/discover/content/relevant?q=author:macieku&resource-type=queriesDataset updatedSep 2, 2024AuthorsmaciekuLicenseAttribution 4.0 (CC BY 4.0)https://creativecommons.org/licenses/by/4.0/
License information was derived automaticallyDescriptionBlockchain data query: Mode - Contracts + Projects + Functions
Identification of Under-Detected Periodicity in Time-Series Microarray Data...
- plos.figshare.com
tiffUpdated Jun 1, 2023ShareFacebookTwitterEmailClick to copy linkLink copiedCiteChaang-Ray Chen; Wun-Yi Shu; Cheng-Wei Chang; Ian C. Hsu (2023). Identification of Under-Detected Periodicity in Time-Series Microarray Data by Using Empirical Mode Decomposition [Dataset]. http://doi.org/10.1371/journal.pone.0111719tiffAvailable download formatsUnique identifierhttps://doi.org/10.1371/journal.pone.0111719Dataset updatedJun 1, 2023AuthorsChaang-Ray Chen; Wun-Yi Shu; Cheng-Wei Chang; Ian C. HsuLicenseAttribution 4.0 (CC BY 4.0)https://creativecommons.org/licenses/by/4.0/
License information was derived automaticallyDescriptionDetecting periodicity signals from time-series microarray data is commonly used to facilitate the understanding of the critical roles and underlying mechanisms of regulatory transcriptomes. However, time-series microarray data are noisy. How the temporal data structure affects the performance of periodicity detection has remained elusive. We present a novel method based on empirical mode decomposition (EMD) to examine this effect. We applied EMD to a yeast microarray dataset and extracted a series of intrinsic mode function (IMF) oscillations from the time-series data. Our analysis indicated that many periodically expressed genes might have been under-detected in the original analysis because of interference between decomposed IMF oscillations. By validating a protein complex coexpression analysis, we revealed that 56 genes were newly determined as periodic. We demonstrated that EMD can be used incorporating with existing periodicity detection methods to improve their performance. This approach can be applied to other time-series microarray studies.
- f
Data_Sheet_1_Intrinsic Frequencies of the Resting-State fMRI Signal: The...
- figshare.com
- frontiersin.figshare.com
docxUpdated Sep 4, 2019ShareFacebookTwitterEmailClick to copy linkLink copiedCiteNicole H. Yuen; Nathaniel Osachoff; J. Jean Chen (2019). Data_Sheet_1_Intrinsic Frequencies of the Resting-State fMRI Signal: The Frequency Dependence of Functional Connectivity and the Effect of Mode Mixing.docx [Dataset]. http://doi.org/10.3389/fnins.2019.00900.s001docxAvailable download formatsUnique identifierhttps://doi.org/10.3389/fnins.2019.00900.s001Dataset updatedSep 4, 2019Dataset provided byFrontiersAuthorsNicole H. Yuen; Nathaniel Osachoff; J. Jean ChenLicenseAttribution 4.0 (CC BY 4.0)https://creativecommons.org/licenses/by/4.0/
License information was derived automaticallyDescriptionThe frequency characteristics of the resting-state BOLD fMRI (rs-fMRI) signal are of increasing scientific interest, as we discover more frequency-specific biological interpretations. In this work, we use variational mode decomposition (VMD) to precisely decompose the rs-fMRI time series into its intrinsic mode functions (IMFs) in a data-driven manner. The accuracy of the VMD decomposition of constituent IMFs is verified through simulations, with higher reconstruction accuracy and much-reduced mode mixing relative to previous methods. Furthermore, we examine the relative contribution of the VMD-derived modes (frequencies) to the rs-fMRI signal as well as functional connectivity measurements. Our primary findings are: (1) The rs-fMRI signal within the 0.01–0.25 Hz range can be consistently characterized by four intrinsic frequency clusters, centered at 0.028 Hz (IMF4), 0.080 Hz (IMF3), 0.15 Hz (IMF2) and 0.22 Hz (IMF1); (2) these frequency clusters were highly reproducible, and independent of rs-fMRI data sampling rate; (3) not all frequencies were associated with equivalent network topology, in contrast to previous findings. In fact, while IMF4 is most likely associated with physiological fluctuations due to respiration and pulse, IMF3 is most likely associated with metabolic processes, and IMF2 with vasomotor activity. Both IMF3 and IMF4 could produce the brain-network topology typically observed in fMRI, whereas IMF1 and IMF2 could not. These findings provide initial evidence of feasibility in decomposing the rs-fMRI signal into its intrinsic oscillatory frequencies in a reproducible manner.
- s
Citation Trends for "The intensity of a single-mode gas laser as a function...
- shibatadb.com
Updated Aug 15, 2025ShareFacebookTwitterEmailClick to copy linkLink copiedCiteYubetsu (2025). Citation Trends for "The intensity of a single-mode gas laser as a function of cavity Q" [Dataset]. https://www.shibatadb.com/article/pN3gxm6RDataset updatedAug 15, 2025Dataset authored and provided byYubetsuLicensehttps://www.shibatadb.com/license/data/proprietary/v1.0/license.txthttps://www.shibatadb.com/license/data/proprietary/v1.0/license.txt
Time period covered1969 - 2008Variables measuredNew Citations per YearDescriptionYearly citation counts for the publication titled "The intensity of a single-mode gas laser as a function of cavity Q".
Mode of travel
- gov.uk
Updated Aug 27, 2025+ more versionsShareFacebookTwitterEmailClick to copy linkLink copiedCiteDepartment for Transport (2025). Mode of travel [Dataset]. https://www.gov.uk/government/statistical-data-sets/nts03-modal-comparisonsDataset updatedAug 27, 2025AuthorsDepartment for TransportDescriptionAccessible Tables and Improved Quality
As part of the Analysis Function Reproducible Analytical Pipeline Strategy, processes to create all National Travel Survey (NTS) statistics tables have been improved to follow the principles of Reproducible Analytical Pipelines (RAP). This has resulted in improved efficiency and quality of NTS tables and therefore some historical estimates have seen very minor change, at least the fifth decimal place.
All NTS tables have also been redesigned in an accessible format where they can be used by as many people as possible, including people with an impaired vision, motor difficulties, cognitive impairments or learning disabilities and deafness or impaired hearing.
If you wish to provide feedback on these changes then please email national.travelsurvey@dft.gov.uk.
Trips, stages, distance and time spent travelling
NTS0303: https://assets.publishing.service.gov.uk/media/68a4344332d2c63f869343cb/nts0303.ods">Average number of trips, stages, miles and time spent travelling by mode: England, 2002 onwards (ODS, 56 KB)
NTS0308: https://assets.publishing.service.gov.uk/media/68a43443cd7b7dcfaf2b5e7e/nts0308.ods">Average number of trips and distance travelled by trip length and main mode; England, 2002 onwards (ODS, 200 KB)
NTS0312: https://assets.publishing.service.gov.uk/media/68a43443246cc964c53d298d/nts0312.ods">Walks of 20 minutes or more by age and frequency: England, 2002 onwards (ODS, 36.2 KB)
NTS0313: https://assets.publishing.service.gov.uk/media/68a43443f49bec79d23d298e/nts0313.ods">Frequency of use of different transport modes: England, 2003 onwards (ODS, 28.2 KB)
NTS0412: https://assets.publishing.service.gov.uk/media/68a43443cd7b7dcfaf2b5e81/nts0412.ods">Commuter trips and distance by employment status and main mode: England, 2002 onwards (ODS, 55.9 KB)
NTS0504: https://assets.publishing.service.gov.uk/media/68a4344350939bdf2c2b5e7a/nts0504.ods">Average number of trips by day of the week or month and purpose or main mode: England, 2002 onwards (ODS, 148 KB)
Mode by purpose
NTS0409: https://assets.publishing.service.gov.uk/media/68a43443a66f515db69343d8/nts0409.ods">Average number of trips and distance travelled by purpose and main mode: England, 2002 onwards (ODS, 112 KB)
Mode by age and sex
NTS0601: https://assets.publishing.service.gov.uk/media/68a4344450939bdf2c2b5e7b/nts0601.ods">Averag
- N
The Default Mode of Human Brain Function Primes the Intentional Stance: Math...
- neurovault.org
niftiUpdated Jun 30, 2018+ more versionsShareFacebookTwitterEmailClick to copy linkLink copiedCite(2018). The Default Mode of Human Brain Function Primes the Intentional Stance: Math - PretrialxRT [Dataset]. http://identifiers.org/neurovault.image:3086niftiAvailable download formatsUnique identifierhttps://identifiers.org/neurovault.image:3086Dataset updatedJun 30, 2018LicenseCC0 1.0 Universal Public Domain Dedicationhttps://creativecommons.org/publicdomain/zero/1.0/
License information was derived automaticallyDescriptionResponse to fixation period preceding correct Math judgments parametrically modulated by response time (RT) to those judgments. Masked by the thresholded conjunction of Mind > Body & Baseline > Math (see paper for details).
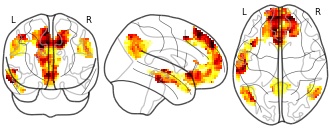
Collection description
Humans readily adopt an intentional stance to other people, comprehending their behavior as guided by unobservable mental states such as belief, desire, and intention. We used fMRI in healthy adults to test the hypothesis that this stance is primed by the default mode of human brain function present when the mind is at rest. We report three findings that support this hypothesis. First, brain regions activated by actively adopting an intentional rather than nonintentional stance to another person were anatomically similar to those demonstrating default responses to a fixation baseline condition. Second, moment-to-moment variation in default activity in the dorsomedial pFC was related to the ease with which participants applied an intentional-but not nonintentional-stance to a social stimulus presented moments later. Finally, individuals who showed stronger dorsomedial pFC activity at baseline in a separate task were generally more efficient when adopting the intentional stance and reported having greater social skills. These results identify a biological basis for the human tendency to adopt the intentional stance. More broadly, they suggest that the brain's default response may have evolved, in part, as a response to life in a social world.
Subject species
homo sapiens
Modality
fMRI-BOLD
Cognitive paradigm (task)
mental arithmetic task
Map type
T
- d
Data from: Modeling of failure mode in knee ligaments depending on the...
- catalog.data.gov
- odgavaprod.ogopendata.com
- +2more
Updated Sep 6, 2025ShareFacebookTwitterEmailClick to copy linkLink copiedCiteNational Institutes of Health (2025). Modeling of failure mode in knee ligaments depending on the strain rate [Dataset]. https://catalog.data.gov/dataset/modeling-of-failure-mode-in-knee-ligaments-depending-on-the-strain-rateDataset updatedSep 6, 2025Dataset provided byNational Institutes of HealthDescriptionBackground The failure mechanism of the knee ligament (bone-ligament-bone complex) at different strain rates is an important subject in the biomechanics of the knee. This study reviews and summarizes the literature describing ligament injury as a function of stain rate, which has been published during the last 30 years. Methods Three modes of injury are presented as a function of strain rate, and they are used to analyze the published cases. The number of avulsions is larger than that of ligament tearing in mode I. There is no significant difference between the number of avulsions and ligament tearing in mode II. Ligament tearing happens more frequently than avulsion in mode III. Results When the strain rate increases, the order of mode is mode I, II, III, I, and II. Analytical models of ligament behavior as a function of strain rate are also presented and used to provide an integrated framework for describing all of the failure regimes. In addition, this study showed the failure mechanisms with different specimens, ages, and strain rates. Conclusion There have been several a numbers of studies of ligament failure under various conditions including widely varying strain rates. One issue in these studies is whether ligament failure occurs mid-ligament or at the bone attachment point, with assertions that this is a function of the strain rate. However, over the range of strain rates and other conditions reported, there has appeared to be discrepancies in the conclusions on the effect of strain rate. The analysis and model presented here provides a unifying assessment of the previous disparities, emphasizing the differential effect of strain rate on the relative strengths of the ligament and the attachment.
Chladni Pattern Images with Frequencies
- kaggle.com
zipUpdated May 15, 2025ShareFacebookTwitterEmailClick to copy linkLink copiedCiteHarith Sami (2025). Chladni Pattern Images with Frequencies [Dataset]. https://www.kaggle.com/datasets/harithsami/chladni-pattern-images-with-frequencieszip(4452953264 bytes)Available download formatsDataset updatedMay 15, 2025AuthorsHarith SamiLicenseApache License, v2.0https://www.apache.org/licenses/LICENSE-2.0
License information was derived automaticallyDescriptionAbout this Dataset
This dataset contains 80,000 synthetic Chladni pattern images generated using a physics-based equation describing vibrating plates. The images are split into two folders:
chladni_patterns_coloured: 40,000 images rendered using the Turbo color map, showcasing vibrant and visually distinct patterns.chladni_patterns_greyscale: 40,000 corresponding images rendered in greyscale, highlighting intensity variations without color.https://www.googleapis.com/download/storage/v1/b/kaggle-user-content/o/inbox%2F20208442%2Fa91b0382015c029f537d15973400d0aa%2FScreenshot%202025-05-15%20223559.png?generation=1747344983751106&alt=media" alt="">
Each folder has an accompanying CSV file with detailed parameters for every image:
chladni_parameters_coloured.csvchladni_parameters_greyscale.csv
These CSV files contain the following columns for each image:
Column Description nameFilename of the corresponding image MMode number along the X axis NMode number along the Y axis AlphaInteraction coefficient controlling pattern mixing shift_xHorizontal translation applied to the pattern shift_yVertical translation applied to the pattern zoomZoom factor scaling the pattern size Pattern Generation
The 40,000 images were synthetically generated using a simplified Chladni pattern equation derived from the physics of vibrating plates. The core intensity function $Z$ at coordinates $(X, Y)$ is calculated as:
\[ Z(X, Y) = \sin(\pi M X) \sin(\pi N Y) + \alpha \sin(\pi N X) \sin(\pi M Y) \]
where:
- M and N are mode numbers that define the number of nodal lines in each direction.
- Alpha controls the interaction between modes.
- X and Y are normalized spatial coordinates.
- This simplified model (with radial factor beta = 0) allows visualization of a wide variety of Chladni patterns representing different vibrational modes and their interactions.
- d
Patent AT-E400965-T1: [Translated] MOBILE DEVICE AND METHOD OF OPERATION...
- catalog.data.gov
- data.virginia.gov
Updated Sep 8, 2025+ more versionsShareFacebookTwitterEmailClick to copy linkLink copiedCiteNational Center for Biotechnology Information (NCBI) (2025). Patent AT-E400965-T1: [Translated] MOBILE DEVICE AND METHOD OF OPERATION USING CONTEXT-SENSITIVE MENU KEYS IN A KEYBOARD LOCKING MODE [Dataset]. https://catalog.data.gov/dataset/patent-at-e400965-t1-translated-mobile-device-and-method-of-operation-using-context-sensitDataset updatedSep 8, 2025Dataset provided byNational Center for Biotechnology Information (NCBI)DescriptionThe present invention is a method and mobile terminal which permits at least one mobile terminal function to be activated and selected using at least one soft key during an inactive and locked mode of a mobile terminal keypad. A mobile terminal in accordance with the invention includes a controller (18); a keypad (2) comprising a plurality of keys (7, 8a, 8b, 10), including at least one soft key coupled to the controller, the keypad being under control of the controller and having an active mode during which key inputs from the keys activate mobile terminal functions and the inactive mode during which a first type of key input from the at least one soft key to the controller does not activate the mobile terminal functions; and wherein during the inactive mode, the controller is responsive to a second type of key input from at least one soft key which activates at least one mobile terminal function without return to the active mode.
- D
Shadow Mode Evaluation Of ADAS Functions Market Research Report 2033
- dataintelo.com
csv, pdf, pptxUpdated Oct 1, 2025+ more versionsShareFacebookTwitterEmailClick to copy linkLink copiedCiteDataintelo (2025). Shadow Mode Evaluation Of ADAS Functions Market Research Report 2033 [Dataset]. https://dataintelo.com/report/shadow-mode-evaluation-of-adas-functions-marketpptx, csv, pdfAvailable download formatsDataset updatedOct 1, 2025Dataset authored and provided byDatainteloLicensehttps://dataintelo.com/privacy-and-policyhttps://dataintelo.com/privacy-and-policy
Time period covered2024 - 2032Area coveredGlobalDescriptionShadow Mode Evaluation of ADAS Functions Market Outlook
According to our latest research, the global Shadow Mode Evaluation of ADAS Functions market size in 2024 stands at USD 2.14 billion, driven by the rapid advancements in autonomous vehicle technologies and the increasing regulatory emphasis on vehicle safety. The market is projected to grow at a robust CAGR of 17.8% from 2025 to 2033, reaching a forecasted market size of USD 10.67 billion by 2033. This accelerated growth is primarily fueled by the automotive sector’s commitment to reducing road accidents and enhancing driver assistance through comprehensive validation of Advanced Driver Assistance Systems (ADAS) in real-world and simulated environments.
The surge in demand for Shadow Mode Evaluation of ADAS Functions is underpinned by the automotive industry's focus on achieving higher levels of vehicle autonomy without compromising safety. As ADAS functionalities like adaptive cruise control, lane keeping assist, and automatic emergency braking become standard features in modern vehicles, manufacturers are compelled to rigorously test these systems under diverse driving conditions. Shadow mode evaluation enables the parallel testing of ADAS software in real-world scenarios, where the system operates in the background and its decisions are compared to those of the human driver. This method not only accelerates the validation process but also uncovers edge cases that may not be encountered in traditional testing environments, thus ensuring robust system performance and compliance with increasingly stringent safety regulations globally.
Another significant growth driver for the Shadow Mode Evaluation of ADAS Functions market is the proliferation of sensor technologies such as cameras, radar, LiDAR, and ultrasonic sensors. These technologies are integral to the functioning of ADAS and require extensive validation to ensure their reliability in complex and dynamic environments. Shadow mode evaluation leverages the data collected from these sensors to simulate a wide array of driving scenarios, enabling manufacturers and suppliers to refine their algorithms and minimize false positives or negatives. The integration of artificial intelligence and machine learning further enhances the capability of shadow mode evaluation platforms to process vast amounts of data, identify anomalies, and continuously improve ADAS functions throughout the vehicle lifecycle.
Collaboration among OEMs, Tier 1 suppliers, and testing organizations is also catalyzing the growth of the shadow mode evaluation market. As regulatory bodies in regions like Europe and North America mandate rigorous testing and validation of ADAS features before market deployment, stakeholders are investing heavily in advanced simulation and validation tools. This collaborative approach not only accelerates time to market but also ensures that ADAS-equipped vehicles meet the highest safety standards. The growing trend of over-the-air software updates further necessitates continuous shadow mode evaluation, as new features and improvements must be validated in real-time post-deployment, thereby sustaining market growth over the forecast period.
From a regional perspective, Asia Pacific is emerging as the fastest-growing market for shadow mode evaluation of ADAS functions, driven by the rapid adoption of advanced automotive technologies in countries like China, Japan, and South Korea. North America and Europe, with their established automotive industries and stringent regulatory frameworks, continue to dominate the market in terms of revenue share. Latin America and the Middle East & Africa are also witnessing gradual adoption, supported by increasing investments in automotive infrastructure and a growing focus on road safety. The regional dynamics are shaped by factors such as consumer awareness, regulatory mandates, and the pace of technological innovation, making the global market landscape highly competitive and dynamic.Function Type Analysis
The Function Type segment of the Shadow Mode Evaluation of ADAS Functions market encompasses a diverse array of critical ADAS features, including Adaptive Cruise Control (ACC), Lane Keeping Assist (LKA), Automatic Emergency Braking (AEB), Blind Spot Detection (BSD), and other emerging functionalities. Adaptive Cruise Control has witnessed significant adoption due to its ability to enhance driver comfort and safety by automatically adjusting vehicle speed - m
CREAM cognitive function failure mode probability estimation data
- data.mendeley.com
Updated Jan 25, 2024+ more versionsShareFacebookTwitterEmailClick to copy linkLink copiedCiteshuo yang (2024). CREAM cognitive function failure mode probability estimation data [Dataset]. http://doi.org/10.17632/rnbvzsy6x9.2Unique identifierhttps://doi.org/10.17632/rnbvzsy6x9.2Dataset updatedJan 25, 2024Authorsshuo yangLicenseAttribution 4.0 (CC BY 4.0)https://creativecommons.org/licenses/by/4.0/
License information was derived automaticallyDescriptionIn this dataset, survey data from 5 experts to assign the weight for the levels of nine CPCs based on CREAM is included. The Dempster–Shafer theory (DST)(Shafer, 1976; Dempster, 2008), also called a “theory of evidence," is employed to fuse the experts' opinions on the CPCs. As a generalization of both probability and possibility theories (Ayyub & Klir, 2006), DST has the capacity to reduce uncertainty in evidence from different sources effectively and validly (Kavya et al., 2023). It is widely used in the process of combining evidence (Sezer et al., 2022; Bani-Mustafa et al., 2020).
Consider a frame of discernment (FOD), Θ={H_1,〖 H〗_2…H_n }, containing finite and mutual exclusive hypotheses on the status of a parameter. In this case, one FOD for each CPC was considered, and the set contained the possible levels that the CPC can undergo. Through its strength to a power set, all the possible combinations of the levels are represented and called propositions:
2^Θ={∅,{H_1 },{H_2 },…{H_n },{H_1∪H_2 },… ,{H_1∪H_2∪…H_i },…{H_1∪H_2∪…H_n }}
Each expert can assign a value (weight) to each combination of levels between [0,1] based on belief in the proposition. This can be expressed as a basic probability assignment (BPA), also referred to as the mass function m: 2^Θ→[0,1]. Based on the combined weights collected from the experts, the level of each CPC could be selected, and the corresponding multiplier for each cognitive function could be assigned. The other related work will be find on Journal Safety Science.
- d
CLICCS-MODES - Modal wave filtering of ERA5 reanalyses with MODES (Version...
- demo-b2find.dkrz.de
Updated Sep 20, 2025+ more versionsShareFacebookTwitterEmailClick to copy linkLink copiedCite(2025). CLICCS-MODES - Modal wave filtering of ERA5 reanalyses with MODES (Version 2.0) - Dataset - B2FIND [Dataset]. http://demo-b2find.dkrz.de/dataset/38296fe2-edcb-51d7-af64-3c48e3784d54Dataset updatedSep 20, 2025LicenseAttribution 4.0 (CC BY 4.0)https://creativecommons.org/licenses/by/4.0/
License information was derived automaticallyDescriptionMODES applies three-dimensional linear wave theory for the decomposition of global circulation in terms of normal-mode functions (NMFs). NMFs used by MODES are eigensolutions of the linearized primitive equations in the terrain-following sigma coordinates and were derived by Kasahara and Puri (1981, Mon. Wea. Rev). The available data are three data sets (40 years), calculated from ERA5 reanalyses by modal filtering of certain wave components, here Kelvin waves (KW), Mixed Rossby-gravity waves (MRG) and Rossby wave n=1 (Rosn1). Near-realtime modal decompositions of ECMWF deterministic forecasts, using the same tool (MODES) as has been used for the generation of the dataset are under this URL: https://modes.cen.uni-hamburg.de/
- H
Replication Data for: Normal Mode Copulas for Nonmonotonic Dependence
- dataverse.harvard.edu
- search.dataone.org
Updated Dec 20, 2023ShareFacebookTwitterEmailClick to copy linkLink copiedCiteKentaro Fukumoto (2023). Replication Data for: Normal Mode Copulas for Nonmonotonic Dependence [Dataset]. http://doi.org/10.7910/DVN/X94ITACroissantCroissant is a format for machine-learning datasets. Learn more about this at mlcommons.org/croissant.Unique identifierhttps://doi.org/10.7910/DVN/X94ITADataset updatedDec 20, 2023Dataset provided byHarvard DataverseAuthorsKentaro FukumotoLicenseAttribution-NonCommercial 4.0 (CC BY-NC 4.0)https://creativecommons.org/licenses/by-nc/4.0/
License information was derived automaticallyDescriptionCopulas are helpful in studying joint distributions of two variables, in particular, when confounders are unobserved. However, most conventional copulas cannot model joint distributions where one variable does not increase or decrease in the other in a monotonic manner. For instance, suppose that two variables are linearly positively correlated for one type of unit and negatively for another type of unit. If the type is unobserved, we can observe only a mixture of both types. Seemingly, one variable tends to take either a high or low value (or a middle value) when the other variable is small (large), or vice versa. To address this issue, I consider an overlooked copula with trigonometric functions Chesneau (2021) that I name the "normal mode copula." I apply the copula to a dataset about government formation and duration to demonstrate that the normal mode copula has better performance than other conventional copulas.
- h
hermes-function-calling-v1
- huggingface.co
Updated Apr 13, 2025+ more versionsShareFacebookTwitterEmailClick to copy linkLink copiedCiteGiovanni Oliveira (2025). hermes-function-calling-v1 [Dataset]. https://huggingface.co/datasets/giovannioliveira/hermes-function-calling-v1Dataset updatedApr 13, 2025AuthorsGiovanni OliveiraLicenseApache License, v2.0https://www.apache.org/licenses/LICENSE-2.0
License information was derived automaticallyDescriptionHermes Function-Calling V1
This dataset is the compilation of structured output and function calling data used in the Hermes 2 Pro series of models. This repository contains a structured output dataset with function-calling conversations, json-mode, agentic json-mode and structured extraction samples, designed to train LLM models in performing function calls and returning structured output based on natural language instructions. The dataset features various conversational scenarios… See the full description on the dataset page: https://huggingface.co/datasets/giovannioliveira/hermes-function-calling-v1.
- c
Dataset for "The origin and influence of non-cavity modes in a micropillar...
- research-data.cardiff.ac.uk
csvUpdated Sep 30, 2025ShareFacebookTwitterEmailClick to copy linkLink copiedCiteAnthony Bennett; Matthew Jordan; Wolfgang Langbein (2025). Dataset for "The origin and influence of non-cavity modes in a micropillar Bragg microcavity" [Dataset]. http://doi.org/10.17035/cardiff.30238336.v1csvAvailable download formatsUnique identifierhttps://doi.org/10.17035/cardiff.30238336.v1Dataset updatedSep 30, 2025Dataset provided byCardiff UniversityAuthorsAnthony Bennett; Matthew Jordan; Wolfgang LangbeinLicenseAttribution 4.0 (CC BY 4.0)https://creativecommons.org/licenses/by/4.0/
License information was derived automaticallyDescriptionFig. 1b : Simulated normalised far-field intensity,angular emission profile above a 2.00 µm diameter micropillar with 7 (26) upper (lower) DBR pairs. ASCII file in table format.Fig. 1c,d : Simulated emission power spectrum in the upward direction and summed over all directions. ASCII file with 3 columns for [Wavelength, Upward emission, All emission].Fig. 1ef: Purcell factor, cavity mode emission, and non-cavity mode emission and spontaneous emission (SE) coupling factor as a function of pillar diameter. ASCII file of columns with [Diameter, Purcell Factor, G_c, G_l, Beta].Fig. 2a/b/c/d : Purcell factor for a source in the centre of the spacer layer, in a Bragg cavity (a,b) or uniform (c,d) pillar as a function of pillar diameter. In (a,c) only the emission through the top and bottom monitors T_(+z) and T_(-z) are considered while in (b,d) emission through all sides is considered. ASCII files in table format with wavelength along first column and diameter in first row.Fig. 3a/b/c/d : Purcell factor for a source in a Bragg cavity (a,b) or uniform (c,d) pillar for a constant pillar diameter of 1.85 µm , as function of the source height. In (a,c) only the emission through the top and bottom monitors T_(+z) and T_(-z) are considered while in (b,d) emission through all sides is considered. ASCII files in table format with wavelength along first column and source height in first row.Fig. 4a/b/c/d : Purcell factor for a source in the centre of the spacer layer, in a Bragg cavity (a,b) or uniform (c,d) pillar for a constant pillar diameter of 1.85 µm , as function of an additional GaAs layer added to the top of the pillar. In (a,c) only the emission through the top and bottom monitors T_(+z) and T_(-z) are considered while in (b,d) emission through all sides is considered. ASCII files in table format with wavelength along first column and GaAs thickness in first row.Fig. 5a/b/c/d/e/f : Absolute electric field |E| cross-sectional profiles for 1.85 µm micropillars (grey outline) at the HE11 mode wavelength for a cavity pillar excited by a dipole at the cavity mode anti-node (z = 0 µm) in the centre of the spacer layer, in (a) on the y = 0 plane (x-z), parallel to the dipole and in (b) on the x = 0 plane (y-z), perpendicular to it. (c, d) as (a, b), but for a dipole at the lower cavity mode node (z = -0.067 µm). (e,f) as (a, b), but for a uniform micropillar. ASCII files in table format with x-coordinate along first column and y-coordinate in first row.
- H
Replication Data for: Not Monotonically Correlated, But Dependent: A Family...
- dataverse.harvard.edu
Updated Feb 2, 2025ShareFacebookTwitterEmailClick to copy linkLink copiedCiteKentaro Fukumoto (2025). Replication Data for: Not Monotonically Correlated, But Dependent: A Family of Normal Mode Copulas [Dataset]. http://doi.org/10.7910/DVN/MJ0F0CCroissantCroissant is a format for machine-learning datasets. Learn more about this at mlcommons.org/croissant.Unique identifierhttps://doi.org/10.7910/DVN/MJ0F0CDataset updatedFeb 2, 2025Dataset provided byHarvard DataverseAuthorsKentaro FukumotoLicenseAttribution-NonCommercial 4.0 (CC BY-NC 4.0)https://creativecommons.org/licenses/by-nc/4.0/
License information was derived automaticallyDescriptionWhen scholars study joint distributions of multiple variables, copulas are useful. However, if the variables are not monotonically correlated with each other yet are still not independent, most of the conventional copulas are not up to the task. Examples include (inversed) U-shaped relationships and heteroskedasticity. To fill this gap, this article sheds new light on a little-known copula, which I call the "normal mode copula." I characterize the copula's properties and show that the copula is asymmetric and nonmonotonic under certain conditions. I also apply the copula to a dataset about U.S. House vote share and campaign expenditure to demonstrate that the normal mode copula has better performance than other conventional copulas.
- d
Data from: Gene function rather than reproductive mode drives the evolution...
- datadryad.org
- data-staging.niaid.nih.gov
- +2more
zipUpdated Apr 17, 2020ShareFacebookTwitterEmailClick to copy linkLink copiedCiteAnja Schmidt; Markus Kiefer; Berit H. Nauerth; Christopher Volkert; David Ibberson; Anna Loreth (2020). Gene function rather than reproductive mode drives the evolution of RNA helicases in sexual and apomictic Boechera [Dataset]. http://doi.org/10.5061/dryad.xksn02vc6zipAvailable download formatsUnique identifierhttps://doi.org/10.5061/dryad.xksn02vc6Dataset updatedApr 17, 2020Dataset provided byDryadAuthorsAnja Schmidt; Markus Kiefer; Berit H. Nauerth; Christopher Volkert; David Ibberson; Anna LorethTime period coveredApr 17, 2020Description120 bp probes (myBaits custom desing by MYcroarray (Ann Arbor, MI, USA) were designed and used for target pulldown of 58 RNA helicases and the CENTROMERIC HISTONE H3 from 24 Boechera accessions representing 12 species, 3 ploidy levels and sexual and apomictic modes of reproduction. Libraries were sequenced on the Illumina HighSeq 2500 plattform using 125 bp paired end sequencing. After quality control and trimming reads were mapped to the Boechera stricta reference genome (Lee et al., 2017), freebayes v.1.1.0-50 was used for variant calling (Garrison 2012).
Sequences were sorted by genomic loci before alignment with MAFFT v7.271 (Katoh and Standley, 2013). On this database 3 types of alignments are provided:
Alignments of genomic regions of the Boechera variants including upstream regulatory regions, depending on data availabilty. Alignments comprise allelic variants of analysed accessions and the Boechera stricta coding sequence downloaded from Phytozome (phytozome.or...
- r
Data from: A Branch-and-Price Algorithm for Multi-Mode Resource Leveling
- resodate.org
Updated Dec 17, 2021ShareFacebookTwitterEmailClick to copy linkLink copiedCiteEamonn T. Coughlan; Marco E. Lübbecke; Jens Schulz (2021). A Branch-and-Price Algorithm for Multi-Mode Resource Leveling [Dataset]. http://doi.org/10.14279/depositonce-14473Unique identifierhttps://doi.org/10.14279/depositonce-14473Dataset updatedDec 17, 2021Dataset provided byDepositOnce
Technische Universität BerlinAuthorsEamonn T. Coughlan; Marco E. Lübbecke; Jens SchulzDescriptionResource leveling is a variant of resource-constrained project scheduling in which a non-regular objective function, the resource availability cost, is to be minimized.
- u
Code and Data: On the path integral electronic normal modes of the MMST...
- rdr.ucl.ac.uk
zipUpdated Nov 27, 2025ShareFacebookTwitterEmailClick to copy linkLink copiedCiteLauren E. Cook; Timothy J. H. Hele (2025). Code and Data: On the path integral electronic normal modes of the MMST representation of nonadiabatic dynamics [Dataset]. http://doi.org/10.5522/04/29959373.v1zipAvailable download formatsUnique identifierhttps://doi.org/10.5522/04/29959373.v1Dataset updatedNov 27, 2025Dataset provided byUniversity College LondonAuthorsLauren E. Cook; Timothy J. H. HeleLicenseAttribution 4.0 (CC BY 4.0)https://creativecommons.org/licenses/by/4.0/
License information was derived automaticallyDescriptionData and code for the paper: On the electronic normal modes of the Meyer-Miller-Stock-Thoss representation of nonadiabatic dynamicsIncludes data for 4 bead and 8 bead results for a symmetrical and asymmetrical potential matrix for:- C_11 correlation function- Boltzmann conservation C_I1 correlation function- Single trajectory results- Histogram for nuclear ring-polymer variable normal modes and normal modes of electronic position- Histograms for electronic total population, electronic state 1 population, radius of electronic state 1 population and normal modes of these- Histogram of total electronic population and state 1 population calculated from normal modes of MMST variablesCodes:- Code for correlation functions (ensemble and single trajectory) and input file- Code for nuclear histogram data creation- Code for electronic histogram data creation- Code for plotting correlation functions- Code for plotting histogramsPlots:-Includes plots from the paper and additional results in folder systemREADME - please read for further details
FacebookTwitterThe equal-time correlation between an IMF of the full time series and that of the new time series.
Attribution 4.0 (CC BY 4.0)https://creativecommons.org/licenses/by/4.0/
License information was derived automatically
The new time series are generated by removing the large volatilities, i.e., ∣r∣ > 8σ for the SHCI and SZCI indices, and ∣r∣ > 2σ for the S&P 500, DAX, HSI and TWII indices.