- d
A moving window analysis for exploring landscape and geologic controls on...
- search.dataone.org
- data.niaid.nih.gov
- +1more
Updated Mar 1, 2024 Share
Share Facebook
 Twitter
 EmailClick to copy linkLink copiedCiteKevin Jackson; Martin Briggs; Ashley Helton (2024). A moving window analysis for exploring landscape and geologic controls on spatial patterning of streambank groundwater discharge [Dataset]. http://doi.org/10.5061/dryad.xsj3tx9mnUnique identifierhttps://doi.org/10.5061/dryad.xsj3tx9mnDataset updatedMar 1, 2024Dataset provided byDryad Digital RepositoryAuthorsKevin Jackson; Martin Briggs; Ashley HeltonTime period coveredJan 1, 2023Description
Preferential groundwater discharge to streams and rivers is important for a range of hydrologic and ecological functions, from providing baseflow and thermal refuge to delivering excess nutrients and other contaminants. Improving our understanding of the spatial distribution and longitudinal extent of these groundwater expressions necessitates updated mapping and modeling techniques. Here we provide the dataset and code that enables the research community to replicate our moving window analysis which was used to analyze riverscape and landscape attributes along 5th order study river sections of the Farmington and Housatonic Rivers (a 26km river section near Tariffville, CT; and a 12km river section near Ashley Falls, MA, USA, respectively)., The dataset and detailed description of collection and analysis is available publically at doi: 10.5066/P9FTZ0DK and doi: 10.5066/P915E8JY. The provided zip file contains the data, R code, python code, and outputs associated with our moving windows analysis reported in the associated paper (Article DOI: 10.1002/hyp.15112)., This analysis was run using ArcMAP (v.10.8.1; ESRI) using external python scripts ran on Python 2.7.18 Shell. Additional preprocessing was run using R version 4.0.3 (2020-10-10). Download the zip file containing the proper file structure and run the pre-analysis and analysis scripts in their correctly numbered order to recreate the moving window analysis. Make sure that the correct file paths are being used when running the scripts., This zip directory contains the data, R code, python code, and outputs associated with our moving windows analysis reported in the associated paper (Article DOI: 10.1002/hyp.15112).
Contact: Ashley Helton (ashley.helthon@uconn.edu) or Kevin Jackson (kevin.jackson@umces.edu).
This dataset enables the replication of a moving window analysis used to calculate riverscape and landscape geomorphometrics, land use land cover characteristics, and subsurface characteristics for two river study sections along the Farmington and Housatonic Rivers. This README file was generated on 2024-02-22 by Kevin Jackson.
#########################################################################
GENERAL INFORMATION
Title of Dataset: A Moving Window Analysis for Exploring Landscape and Geologic Controls on Spatial Patterning of Streambank Groundwater Discharge
Author Information A. Principal Investigator Contact Information Name: Kevin J...
Fouha Bay Moving Window Analysis, Benthic Quadrat Surveys at Guam in 2014
- catalog.data.gov
- data.wu.ac.at
Updated Mar 22, 2025ShareFacebookTwitterEmailClick to copy linkLink copiedCiteGuam Field Office, Pacific Islands Regional Office (PIRO), National Marine Fisheries Service (NMFS), National Oceanic and Atmospheric Administration (NOAA) (Point of Contact) (2025). Fouha Bay Moving Window Analysis, Benthic Quadrat Surveys at Guam in 2014 [Dataset]. https://catalog.data.gov/dataset/fouha-bay-moving-window-analysis-benthic-quadrat-surveys-at-guam-in-20145Dataset updatedMar 22, 2025Area coveredGuamDescriptionPIRO Fishery Biologist gathered benthic cover data using a 1m2 quadrat with 25 intersecting points every five meters along a transect running from the inner bay to the outer bay. Biotic cover classes were identified to lowest possible taxon. Data is supported by photos from the sites and GPS waypoints for most quadrats.
- d
Core mapper moving window averages (primary model) - A landscape...
- catalog.data.gov
Updated Feb 21, 2025ShareFacebookTwitterEmailClick to copy linkLink copiedCiteU.S. Fish and Wildlife Service (2025). Core mapper moving window averages (primary model) - A landscape connectivity analysis for the coastal marten (Martes caurina humboldtensis) [Dataset]. https://catalog.data.gov/dataset/core-mapper-moving-window-averages-primary-model-a-landscape-connectivity-analysis-for-theDataset updatedFeb 21, 2025Dataset provided byU.S. Fish and Wildlife ServiceDescriptionThis raster dataset of Core Mapper Moving Window Averages is an intermediary modeling product that was produced by the Core Mapper tool (Shirk and McRae 2013) in the process of developing habitat cores for use in our coastal marten connectivity model. It is derived from another dataset (HabitatSurface), and was produced using the Core Mapper parameters defined in the Lineage section of the accompanying geospatial metadata record. More specifically, it is a calculated dataset in which a 977m moving window was used on the habitat surface to calculate the average habitat value within a 977m radius around each pixel (this moving window size was derived from the estimated average size of a female marten's home range of 300 hectares). Of note, the set of habitat cores that came from this Core Mapper tool received additional modifications; see the report or the metadata record for PrimaryModel_HabitatCores for details. Refer to the HabitatSurface and PrimaryModel_HabitatCores metadata records for additional context. We derived the habitat cores using a tool within Gnarly Landscape Utilities called Core Mapper (Shirk and McRae 2015). To develop a Habitat Surface for input into Core Mapper, we started by assigning each 30m pixel on the modeled landscape a habitat value equal to its GNN OGSI value (range = 0-100). In areas with serpentine soils that support habitat potentially suitable for coastal marten, we assigned a minimum habitat value of 31, which is equivalent to the 33rd percentile of OGSI 80 pixels in the marten’s historical range marten (for general details on our incorporation of serpentine soils, see the report section titled "Data Layers - Serpentine Soils"; for specific details on the development of this serpentine dataset, see the metadata record for the ResistancePostProcessing_Serpentine data layer, which was used to make these modifications to the habitat surface). Pixels with an OGSI value >31.0 retained their normal habitat value. Our intention was to allow the modified serpentine pixels to be more easily incorporated into habitat cores if there were higher value OGSI pixels in the vicinity, but not to have them form the entire basis of a core. As a parameter of the Core Mapper tool, we also excluded pixels with a habitat value <1.0 from inclusion in habitat cores. We then used Core Mapper to define a moving window and calculate the average habitat value within a 977m radius around each pixel (derived from the estimated average size of a female marten’s home range of 300 ha). Pixels with an average habitat value ≥36.0 were then incorporated into habitat cores. This is an abbreviated and incomplete description of the dataset. Please refer to the spatial metadata for a more thorough description of the methods used to produce this dataset, and a discussion of any assumptions or caveats that should be taken into consideration. Additional data for this project (including the Habitat Surface referenced above and the Habitat Cores used in our connectivity model) can be found at: https://www.fws.gov/arcata/shc/marten
Terrestrial Development Index for the Western United States: 20-kilometer...
- datasets.ai
- data.usgs.gov
- +2more
55Updated Sep 8, 2024+ more versionsShareFacebookTwitterEmailClick to copy linkLink copiedCiteDepartment of the Interior (2024). Terrestrial Development Index for the Western United States: 20-kilometer Moving Window [Dataset]. https://datasets.ai/datasets/terrestrial-development-index-for-the-western-united-states-20-kilometer-moving-window55Available download formatsDataset updatedSep 8, 2024AuthorsDepartment of the InteriorArea coveredWestern United States, United StatesDescriptionThe terrestrial development index (TDI) quantifies levels of development (urban, agriculture, energy and mineral extraction and transmission, and transportation). TDI scores represent the total percentage of the development footprint within a 20-kilometer radius circular moving window. The Surface Disturbance Footprint from Development for the Western United States is used in the moving window analysis. The TDI scores range from 0-100%.
- a
Sliding Window
- hub.arcgis.com
- pa-geo-data-pennmap.hub.arcgis.com
Updated Feb 13, 2025ShareFacebookTwitterEmailClick to copy linkLink copiedCitePennShare (2025). Sliding Window [Dataset]. https://hub.arcgis.com/datasets/197894a74b324500b814da8cb3a564e8Dataset updatedFeb 13, 2025Dataset authored and provided byPennShareArea coveredDescriptionNotes from the PennDOT HSNS Video https://www.youtube.com/watch?v=liXTnqxZjCgNetwork screening analysis can be used for safety analysis and decision making to decrease frequency and severity of crashes in Pennsylvania.Network screening is a method from the Highway Safety Manual (HSM) that compares expected crash frequencies and crash severities to historical crash data based on Part C of HSM. It helps evaluate facilities and identify and prioritize locations that are likely to respond to safety improvement investments. FHWA states that employing traditional networking screening with systemic safety analysis can be an agency’s first step toward a comprehensive safety management program. The network screening is the first step in the Roadway Safety Management Process (Part B of the HSM) and it considers crash history, roadway factors and traffic characteristics.Roadway Safety Management Process (Part B of the HSM) Steps Network Screening Diagnosis Select Countermeasures Economic Appraisal Prioritize Projects Safety effectiveness evaluationRoadway safety management process parallels the method by which PennDOT selects and evaluates projects for Federal Highway Safety Improvement Program.SPF: safety performance functionPositive/high excess cost locations are good candidates for safety improvements.Urban: sites within urban boundaries (Census) where population is more than 5,000 people.Rural: sites outside of urban boundaries (Census) where population is less than 5,000 people.Crashes within 250 feet of an intersection are assigned to the intersection for analysis.
- N
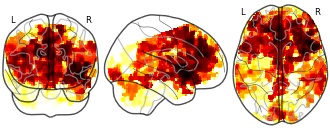
Sliding-window analysis tracks fluctuations in amygdala functional...
- neurovault.org
niftiUpdated Jun 30, 2018+ more versionsShareFacebookTwitterEmailClick to copy linkLink copiedCite(2018). Sliding-window analysis tracks fluctuations in amygdala functional connectivity associated with physiological arousal and vigilance during fear conditioning: windowed right amygdala tstat [Dataset]. http://identifiers.org/neurovault.image:43172niftiAvailable download formatsUnique identifierhttps://identifiers.org/neurovault.image:43172Dataset updatedJun 30, 2018LicenseCC0 1.0 Universal Public Domain Dedicationhttps://creativecommons.org/publicdomain/zero/1.0/
License information was derived automaticallyDescriptionFSL5.0

Collection description
We evaluated whether sliding-window analysis can reveal functionally relevant brain network dynamics during a well-established fear conditioning paradigm. To this end, we tested if fMRI fluctuations in amygdala functional connectivity (FC) can be related to task-induced changes in physiological arousal and vigilance, as reflected in the skin conductance level (SCL). Thirty-two healthy individuals participated in the study. For the sliding-window analysis we used windows that were shifted by one volume at a time. Amygdala FC was calculated for each of these windows. Simultaneously acquired SCL time series were averaged over time frames that corresponded to the sliding-window FC analysis, which were subsequently associated with the whole-brain seed-based amygdala sliding-window FC using the GLM. Surrogate time series were generated to test whether connectivity dynamics could have occurred by chance. In addition, results were contrasted against static amygdala FC and sliding-window FC of the primary visual cortex, which was chosen as a control seed, while a physio-physiological interaction (PPI) was performed as cross-validation. During periods of increased SCL, the left amygdala became more strongly coupled with the bilateral insula and medial prefrontal cortex, core areas of the salience network. The sliding-window analysis yielded a connectivity pattern that was unlikely to have occurred by chance, was spatially distinct from static amygdala FC and from sliding-window FC of the primary visual cortex, but was highly comparable to that of the PPI analysis. We conclude that sliding-window analysis can reveal functionally relevant fluctuations in connectivity in the context of an externally cued task.
Subject species
homo sapiens
Modality
fMRI-BOLD
Analysis level
group
Cognitive paradigm (task)
pavlovian conditioning task
Map type
T
- f
Results of monte carlo simulations for rolling window analysis and test...
- figshare.com
xlsxUpdated Jun 2, 2024ShareFacebookTwitterEmailClick to copy linkLink copiedCiteViktor Hřebačka (2024). Results of monte carlo simulations for rolling window analysis and test description [Dataset]. http://doi.org/10.6084/m9.figshare.25447081.v2xlsxAvailable download formatsUnique identifierhttps://doi.org/10.6084/m9.figshare.25447081.v2Dataset updatedJun 2, 2024Dataset provided byfigshareAuthorsViktor HřebačkaLicenseAttribution 4.0 (CC BY 4.0)https://creativecommons.org/licenses/by/4.0/
License information was derived automaticallyDescriptionThe results of Monte Carlo simulations done in the paper On the Testing of Adaptive Markets Hypothesis Using Rolling Windows.
- f
Output of combos item from an absolute sliding window analysis.
- plos.figshare.com
- figshare.com
xlsUpdated Jun 1, 2023ShareFacebookTwitterEmailClick to copy linkLink copiedCiteLiam D. Bailey; Martijn van de Pol (2023). Output of combos item from an absolute sliding window analysis. [Dataset]. http://doi.org/10.1371/journal.pone.0167980.t002xlsAvailable download formatsUnique identifierhttps://doi.org/10.1371/journal.pone.0167980.t002Dataset updatedJun 1, 2023Dataset provided byPLOS ONEAuthorsLiam D. Bailey; Martijn van de PolLicenseAttribution 4.0 (CC BY 4.0)https://creativecommons.org/licenses/by/4.0/
License information was derived automaticallyDescriptionOutput of combos item from an absolute sliding window analysis.
- d
Percent Area of Sagebrush Habitat Within an 50-km Radius.
- datadiscoverystudio.org
- dataone.org
- +1more
zipUpdated May 21, 2018+ more versionsShareFacebookTwitterEmailClick to copy linkLink copiedCite(2018). Percent Area of Sagebrush Habitat Within an 50-km Radius. [Dataset]. http://datadiscoverystudio.org/geoportal/rest/metadata/item/cb56be16f4204aafbe57db212e1407d6/htmlzipAvailable download formatsDataset updatedMay 21, 2018Descriptiondescription: This map was developed to examine multi-scale spatial relationships between percentage of sagebrush and other response variables of interest. A map of sagebrush in the western United States was used as a base layer for a moving window analysis to calculate the percentage of the area classified as sagebrush within the given search radius.; abstract: This map was developed to examine multi-scale spatial relationships between percentage of sagebrush and other response variables of interest. A map of sagebrush in the western United States was used as a base layer for a moving window analysis to calculate the percentage of the area classified as sagebrush within the given search radius.
- H
Heavy Sliding Window Report
- marketreportanalytics.com
doc, pdf, pptUpdated Mar 27, 2025+ more versionsShareFacebookTwitterEmailClick to copy linkLink copiedCiteMarket Report Analytics (2025). Heavy Sliding Window Report [Dataset]. https://www.marketreportanalytics.com/reports/heavy-sliding-window-36468doc, pdf, pptAvailable download formatsDataset updatedMar 27, 2025Dataset authored and provided byMarket Report AnalyticsLicensehttps://www.marketreportanalytics.com/privacy-policyhttps://www.marketreportanalytics.com/privacy-policy
Time period covered2025 - 2033Area coveredGlobalVariables measuredMarket SizeDescriptionThe global heavy sliding window market is experiencing robust growth, driven by increasing demand for energy-efficient and aesthetically pleasing windows in both residential and commercial constructions. The market's expansion is fueled by several key factors. Firstly, rising concerns about energy conservation and reducing carbon footprints are leading to increased adoption of energy-efficient windows, including heavy sliding models, which offer superior insulation compared to traditional windows. Secondly, the growing trend of open-plan living spaces, particularly in modern residential designs, necessitates larger window systems, boosting the demand for heavy sliding windows. Thirdly, advancements in window technology, such as improved glazing materials and enhanced hardware, are contributing to better performance and durability, further enhancing market appeal. The market is segmented by application (residential and commercial) and type (single and double glazing), with double-glazed windows dominating due to superior energy efficiency. Key players such as Pella Corporation, Andersen Windows & Doors, and Milgard Windows & Doors are driving innovation and expanding their product portfolios to cater to diverse market needs. The North American market currently holds a significant share, driven by robust construction activity and a high adoption rate of energy-efficient building materials. However, significant growth opportunities exist in Asia-Pacific regions like China and India, fueled by rapid urbanization and infrastructure development. Competition is intense, with established players and regional manufacturers vying for market share through product differentiation, technological advancements, and strategic partnerships. While the provided CAGR is missing, a reasonable estimation considering general construction market growth and the factors mentioned above, would place the CAGR for the heavy sliding window market between 5% and 7% annually over the forecast period (2025-2033). This moderate but consistent growth reflects both the established nature of the window market and the continued uptake of high-performance, energy-efficient options. Restraints on market growth include fluctuating raw material prices (especially aluminum and glass), economic downturns affecting construction activity, and potential supply chain disruptions. Despite these challenges, the long-term outlook for the heavy sliding window market remains positive, driven by consistent demand and ongoing technological improvements. The market is poised to witness a substantial increase in value over the next decade, propelled by the aforementioned drivers and strategic adaptations by key players.
- N
Sliding-window analysis tracks fluctuations in amygdala functional...
- neurovault.org
niftiUpdated Jun 30, 2018+ more versionsShareFacebookTwitterEmailClick to copy linkLink copiedCite(2018). Sliding-window analysis tracks fluctuations in amygdala functional connectivity associated with physiological arousal and vigilance during fear conditioning: PPI tfce corrp [Dataset]. http://identifiers.org/neurovault.image:43175niftiAvailable download formatsUnique identifierhttps://identifiers.org/neurovault.image:43175Dataset updatedJun 30, 2018LicenseCC0 1.0 Universal Public Domain Dedicationhttps://creativecommons.org/publicdomain/zero/1.0/
License information was derived automaticallyDescriptionThis is an unthresholded TFCE map that was corrected for multiple comparisons (corrp). To visualize the results reported in the manuscript, threshold the map at 0.95, which corresponds to a corrected p value at 0.05.
Collection description
We evaluated whether sliding-window analysis can reveal functionally relevant brain network dynamics during a well-established fear conditioning paradigm. To this end, we tested if fMRI fluctuations in amygdala functional connectivity (FC) can be related to task-induced changes in physiological arousal and vigilance, as reflected in the skin conductance level (SCL). Thirty-two healthy individuals participated in the study. For the sliding-window analysis we used windows that were shifted by one volume at a time. Amygdala FC was calculated for each of these windows. Simultaneously acquired SCL time series were averaged over time frames that corresponded to the sliding-window FC analysis, which were subsequently associated with the whole-brain seed-based amygdala sliding-window FC using the GLM. Surrogate time series were generated to test whether connectivity dynamics could have occurred by chance. In addition, results were contrasted against static amygdala FC and sliding-window FC of the primary visual cortex, which was chosen as a control seed, while a physio-physiological interaction (PPI) was performed as cross-validation. During periods of increased SCL, the left amygdala became more strongly coupled with the bilateral insula and medial prefrontal cortex, core areas of the salience network. The sliding-window analysis yielded a connectivity pattern that was unlikely to have occurred by chance, was spatially distinct from static amygdala FC and from sliding-window FC of the primary visual cortex, but was highly comparable to that of the PPI analysis. We conclude that sliding-window analysis can reveal functionally relevant fluctuations in connectivity in the context of an externally cued task.
Subject species
homo sapiens
Modality
fMRI-BOLD
Analysis level
group
Cognitive paradigm (task)
pavlovian conditioning task
Map type
P
- D
Sliding Window Sales Market Report | Global Forecast From 2025 To 2033
- dataintelo.com
csv, pdf, pptxUpdated Jan 7, 2025ShareFacebookTwitterEmailClick to copy linkLink copiedCiteDataintelo (2025). Sliding Window Sales Market Report | Global Forecast From 2025 To 2033 [Dataset]. https://dataintelo.com/report/global-sliding-window-sales-marketpptx, csv, pdfAvailable download formatsDataset updatedJan 7, 2025AuthorsDatainteloLicensehttps://dataintelo.com/privacy-and-policyhttps://dataintelo.com/privacy-and-policy
Time period covered2024 - 2032Area coveredGlobalDescriptionSliding Window Market Outlook
The sliding window market is witnessing robust growth, with a global market size valued at USD 15 billion in 2023 and projected to reach USD 24 billion by 2032, growing at a CAGR of 5.5% during this period. This growth is largely driven by the increasing demand for energy-efficient and aesthetically appealing architectural solutions. The rising urbanization rates and the burgeoning construction activities worldwide, particularly in emerging economies, form the backbone of this market's expansion. Furthermore, advancements in materials and design technology have enhanced the functionality and appeal of sliding windows, propelling their adoption across various sectors.
One of the primary growth factors in the sliding window market is the escalating preference for modern architectural aesthetics that sliding windows offer. In many urban settings, space optimization is critical, and sliding windows provide an ideal solution by not encroaching on interior spaces when opened. Their sleek, minimalist design not only complements contemporary architectural styles but also maximizes the influx of natural light, thereby reducing reliance on artificial lighting and contributing to energy savings. This characteristic is particularly appealing in residential and commercial applications, where design and efficiency go hand in hand.
The growing awareness and regulatory push towards energy efficiency and sustainable building practices are also significantly influencing the sliding window market. Governments and environmental agencies worldwide are increasingly mandating energy-efficient construction materials, and sliding windows made from advanced materials like uPVC and thermally broken aluminum meet these criteria effectively. These materials not only provide excellent thermal and acoustic insulation but also improve the overall energy efficiency of buildings. As property developers and consumers become more eco-conscious, the demand for such energy-efficient sliding windows is expected to rise substantially.
Technological advancements in materials and production processes are further catalyzing market growth. Innovations such as double-glazing, low-emissivity coatings, and improved locking mechanisms have enhanced the functionality and security features of sliding windows. These advancements not only improve the thermal and acoustic insulation properties of windows but also extend their lifespan and reduce maintenance requirements. Manufacturers are continuously investing in R&D to develop new products that offer superior performance, which in turn attracts a larger consumer base seeking high-performance and durable solutions.
In addition to sliding windows, Double Hung Windows are gaining popularity due to their versatility and classic appeal. These windows, which feature two operable sashes that move vertically, offer excellent ventilation options and are easy to maintain. Double Hung Windows are particularly favored in traditional and colonial-style homes where maintaining architectural integrity is important. Their design allows for both the top and bottom sashes to open, providing improved air circulation compared to single-hung windows. This feature is especially beneficial in regions with varying weather conditions, as it allows homeowners to control airflow and temperature within their homes effectively.
Regionally, the Asia Pacific is poised to dominate the sliding window market due to rapid urbanization and industrialization in countries like China and India. These countries are experiencing a construction boom, driven by both new construction projects and renovation activities, which significantly boosts the demand for sliding windows. Moreover, the rising disposable incomes and changing lifestyle preferences in this region are leading to an increased adoption of aesthetically pleasing and technologically advanced building materials, including sliding windows. North America and Europe also represent significant market segments, driven by stringent energy efficiency regulations and a strong focus on sustainable building practices.
Material Type Analysis
The material type segment of the sliding window market is crucial, encompassing uPVC, aluminum, wood, and other materials. Each material presents unique attributes that cater to different market needs and consumer preferences. uPVC, or unplasticized polyvinyl chloride, has gained popularity for its cost-effectiveness, durability, and superior thermal insulation p
- a
WSRRISpatialPrioritiesGreaterSageGrouse
- wsrri-wdfw.hub.arcgis.com
Updated Mar 1, 2024ShareFacebookTwitterEmailClick to copy linkLink copiedCiteWA Dept of Fish and Wildlife (2024). WSRRISpatialPrioritiesGreaterSageGrouse [Dataset]. https://wsrri-wdfw.hub.arcgis.com/datasets/wsrrispatialprioritiesgreatersagegrouseDataset updatedMar 1, 2024Dataset authored and provided byWA Dept of Fish and WildlifeArea coveredDescriptionSUMMARYIn WSRRI’s spatial priority setting, this data represents the Greater Sage-grouse target. This target is included in WSRRI because it is a threatened species of high conservation concern and the ecosystem-based models do not fully capture this species’ unique life-history and habitat associations. Greater Sage-grouse core areas are not necessarily occupied now, but they contain abundant habitat and correspond well to the recent range of this species in the region. Sage-grouse GOAs have less habitat and/or lower quality habitat and are therefore less likely to be occupied. However, many have seen occasional use and with additional restoration may help expand the occupied range. Through a co-development process centered around three working groups comprised of Tribal, agency, and non-profit scientists and practitioners, we mapped Core Areas, Growth Opportunity Areas, Corridors, and Other Habitat: Core areas (Cores) - Core areas are those with the highest quality habitat across the shrubsteppe landscape. Actions targeted in core areas should focus on protecting existing habitat (as protecting intact high-quality habitat is more efficient than restoring it after disturbance or degradation), as well as threat prevention and abatement to avoid degradation. Where disturbances occur in core areas despite protection measures, restoration or enhancements should be high priorities to quickly recover habitat quality. Growth Opportunity Areas (GOAs) - GOAs are areas with significant amounts of habitat, though it is more degraded than habitat in core areas. Through restoration, habitat quality could increase, thus growing the core. Restored areas within GOAs should then be protected from further threats to protect our investments over time. Corridors - Corridors provide paths for wildlife that are relatively free of movement barriers; these paths connect the network of cores and GOAs across the landscape. Further barrier development (e.g., road construction, significant habitat conversion, and development) should be avoided in corridors to maintain their ability to connect high-quality habitat. Other Habitat - These areas include remaining habitat, but that habitat is too highly degraded, due to patch size or isolation, to be included in core areas, GOAs, or corridors. For long-term conservation of shrubsteppe habitats and species, however, these areas are still important to maintain as habitat and, if and where resources allow, their condition improved over time.Please note that we have masked the data across Tribal lands. DETAILSThe Greater Sage-grouse habitat spatial priorities were created using a layer of habitat quality then applying moving window and local neighborhood analysis techniques on the habitat suitability data as described below. To map the spatial priorities of the Greater sage-grouse, we trained a habitat suitability using the MAXENT algorithm (Phillips et al., 2010) empirically in a use-availability study design using habitat predictors and 93,474 observations of grouse in this landscape going back to the 1980s. The habitat predictors included climate variables (mean annual temperature, mean annual precipitation, climatic moisture deficit, growing degree days, etc.), fractional vegetation cover data (perennial grass, sagebrush cover, annual grass cover), landcover data (xeric/mesic grass/shrub, developed, agricultural classes, etc.), topography data (slope, topographic wetness index, heat load index, etc.) and the human footprint (powerlines, roads, railroads, wind turbines, urbanization, etc.). The model exhibited a strong relationship to greater sage-grouse occurrence (area under the receiver-operator curve = 0.90), with high accuracy (0.83), sensitivity (0.83), and specificity (0.82). For all targets (Xeric, Mesic and Sage grouse) we modeled Core Areas the same way, using an approach developed for the Washington Connected Landscapes project and implemented in the Gnarly Landscape Utilities ArcGIS toolbox (Shirk et al., 2010). First, a moving window average was applied to the habitat model and thresholded to identify local areas that have high average local habitat quality. The radius of the moving window and the thresholds varied by target and are listed in the table below and here: https://terradapt.gitbook.io/wsrri-spatial-priorities-documentation/methods/core-habitat). For each target, two different moving window thresholds were used to create a set of higher quality areas (the Core class in our spatial priorities hierarchy) and lower quality areas (Growth Opportunity Areas). In this way, Core Areas are nested within GOAs. Within each Core Area or GOA, all pixels with a resistance greater than 5 and all pixels with a habitat quality less than the threshold were removed. Next, we used the target’s resistance model to calculate the cost-weighted distance to the nearest valid pixel in the Core Areas and GOAs, and then applied a threshold to that cost distance at a distance approximating a home-range type movement (which varied by target, see table below). This links nearby patches together unless they're sufficiently far apart in cost-distance. Finally, all Cores and GOAs that were below the minimum size threshold were removed. Because we used moving windows and local movement neighborhoods to define Cores and GOAs, it is possible they contain pixels that are not currently classified as habitat for the target. This is intentional, as animals within Cores and GOAs are likely to move through these areas within their home ranges. These non-native habitats within Cores and GOAS are critical locations to restore or manage in a way that promotes or increases habitat quality within that area. The parameters used to map Cores and GOAs for each target are shown in the table below. Finalizing the spatial priorities: The above processes to map habitat, resistance, Cores, GOAs, and corridors were conducted for each year from 2018-2022 (5 years) for the xeric ecosystem and greater sage-grouse, and from 2013-2022 (10 years) for the mesic ecosystem, using input data matched to the year of mapping. For each year and for each target, these maps with potentially overlapping classes of Core, GOA, and CORRIDOR were combined into a single prioritization, using a hierarchy where pixels labeled as Core were included first, then GOA, then corridor, and finally ‘other habitat’. A final spatial priorities map was then calculated per target as the most common class (Core, GOA, corridor, or ‘other habitat’ across the range of years). This was done to reduce year-to-year variability in spatial priorities due to data inaccuracies and other sources of variation. Parameter Greater Sage-grouse Core habitat threshold 0.8 GOA habitat threshold 0.33 Moving window radius (km) 0.5 Home range movement distance (km) 2.5 Minimum size requirement (km2) 10 See here for more details: https://terradapt.gitbook.io/wsrri-spatial-priorities-documentation/methods/spatial-priorities
- d
Sliding Window Geospatial Tool
- search.dataone.org
- hydroshare.org
Updated Dec 5, 2021ShareFacebookTwitterEmailClick to copy linkLink copiedCiteTao Wen (2021). Sliding Window Geospatial Tool [Dataset]. https://search.dataone.org/view/sha256%3A7df8d8b2ab95406ae1fe6878a195fcf48b066b2902afb1de25c4df4a6acf4374Dataset updatedDec 5, 2021Dataset provided byHydroshareAuthorsTao WenArea coveredDescriptionThis resource collects teaching materials that are originally created for the in-person course 'GEOSC/GEOG 497 – Data Mining in Environmental Sciences' at Penn State University (co-taught by Tao Wen, Susan Brantley, and Alan Taylor) and then refined/revised by Tao Wen to be used in the online teaching module 'Data Science in Earth and Environmental Sciences' hosted on the NSF-sponsored HydroLearn platform.
This resource includes both R Notebooks and Python Jupyter Notebooks to teach the basics of R and Python coding, data analysis and data visualization, as well as building machine learning models in both programming languages by using authentic research data and questions. All of these R/Python scripts can be executed either on the CUAHSI JupyterHub or on your local machine.
This resource is shared under the CC-BY license. Please contact the creator Tao Wen at Syracuse University (twen08@syr.edu) for any questions you have about this resource. If you identify any errors in the files, please contact the creator.
- m
Sliding Window Market Size, Share & Industry Analysis 2033
- marketresearchintellect.com
Updated Jul 3, 2025ShareFacebookTwitterEmailClick to copy linkLink copiedCiteMarket Research Intellect (2025). Sliding Window Market Size, Share & Industry Analysis 2033 [Dataset]. https://www.marketresearchintellect.com/product/sliding-window-market/Dataset updatedJul 3, 2025Dataset authored and provided byMarket Research IntellectLicensehttps://www.marketresearchintellect.com/privacy-policyhttps://www.marketresearchintellect.com/privacy-policy
Area coveredGlobalDescriptionDiscover the latest insights from Market Research Intellect's Sliding Window Market Report, valued at USD 3.5 billion in 2024, with significant growth projected to USD 5.8 billion by 2033 at a CAGR of 7.5% (2026-2033).
- S
Sliding Window Report
- archivemarketresearch.com
doc, pdf, pptUpdated Apr 30, 2025ShareFacebookTwitterEmailClick to copy linkLink copiedCiteArchive Market Research (2025). Sliding Window Report [Dataset]. https://www.archivemarketresearch.com/reports/sliding-window-535310ppt, pdf, docAvailable download formatsDataset updatedApr 30, 2025Dataset authored and provided byArchive Market ResearchLicensehttps://www.archivemarketresearch.com/privacy-policyhttps://www.archivemarketresearch.com/privacy-policy
Time period covered2025 - 2033Area coveredGlobalVariables measuredMarket SizeDescriptionThe global sliding window market is experiencing robust growth, driven by increasing urbanization, rising construction activities, and a growing preference for energy-efficient and aesthetically pleasing window solutions. The market, currently valued at approximately $15 billion (estimated based on common market sizes for similar window segments and provided context) in 2025, is projected to exhibit a Compound Annual Growth Rate (CAGR) of 5% from 2025 to 2033. This growth is fueled by several key factors including the rising adoption of energy-efficient materials like vinyl and aluminum, increasing demand for improved home security features integrated into window systems, and a shift towards larger window designs maximizing natural light and outdoor views in both residential and commercial buildings. The residential sector currently dominates the market share, however, the commercial segment is expected to see significant growth, driven by large-scale construction projects across various sectors, particularly in developing economies. Further market segmentation highlights the popularity of vinyl sliding windows due to their affordability and low maintenance, while aluminum and fiberglass windows are gaining traction in commercial applications due to their durability and strength. The market is geographically diverse, with North America and Europe currently representing significant market shares. However, rapid urbanization and infrastructure development in Asia-Pacific regions, particularly China and India, are creating promising growth opportunities in the coming years. Despite these positive trends, factors such as fluctuating raw material prices and increasing labor costs pose challenges to market growth. The competitive landscape is highly fragmented, featuring a mix of large multinational corporations and regional players, leading to intense competition based on product innovation, pricing strategies, and brand reputation.
- a
Heavy Sliding Window Report
- archivemarketresearch.com
pdfUpdated Jul 26, 2025ShareFacebookTwitterEmailClick to copy linkLink copiedCiteThe citation is currently not available for this dataset.pdfAvailable download formatsDataset updatedJul 26, 2025Dataset authored and provided byArchive Market ResearchLicensehttps://www.archivemarketresearch.com/privacy-policyhttps://www.archivemarketresearch.com/privacy-policy
Time period covered2025 - 2033Area coveredGlobalVariables measuredMarket SizeDescriptionThe global heavy sliding window market is experiencing robust growth, driven by increasing demand for energy-efficient and aesthetically pleasing architectural solutions in both residential and commercial sectors. The market, currently estimated at $5 billion in 2025, is projected to exhibit a Compound Annual Growth Rate (CAGR) of 6% from 2025 to 2033. This growth is fueled by several key factors. Firstly, rising construction activity globally, particularly in developing economies, is creating significant opportunities for window manufacturers. Secondly, a growing emphasis on energy efficiency and sustainability is leading to increased adoption of heavy sliding windows, which offer superior insulation compared to traditional window types. Furthermore, advancements in materials technology are resulting in lighter, stronger, and more durable windows with improved aesthetics. Leading players like Pella, Andersen, and Milgard are leveraging these trends through product innovation and strategic partnerships to maintain a strong market presence. However, the market faces certain challenges. Fluctuations in raw material prices, particularly aluminum and glass, can impact profitability. Furthermore, increasing competition from local manufacturers, especially in emerging markets, and the potential for economic downturns can influence market growth. Despite these constraints, the long-term outlook for the heavy sliding window market remains positive, driven by the ongoing demand for premium, energy-efficient windows that enhance both comfort and property value. The market segmentation reveals a significant share held by the residential sector, with commercial applications also witnessing substantial growth, particularly in high-rise buildings and modern architectural designs.
- f
Table2_Research on temporal and spatial evolution of land use and landscape...
- frontiersin.figshare.com
xlsUpdated Jun 16, 2023+ more versionsShareFacebookTwitterEmailClick to copy linkLink copiedCiteYanhua Fu; Yalin Zhang (2023). Table2_Research on temporal and spatial evolution of land use and landscape pattern in Anshan City based on GEE.xls [Dataset]. http://doi.org/10.3389/fenvs.2022.988346.s002xlsAvailable download formatsUnique identifierhttps://doi.org/10.3389/fenvs.2022.988346.s002Dataset updatedJun 16, 2023Dataset provided byFrontiersAuthorsYanhua Fu; Yalin ZhangLicenseAttribution 4.0 (CC BY 4.0)https://creativecommons.org/licenses/by/4.0/
License information was derived automaticallyArea coveredAnshanDescriptionFrequent mining activities can bring about problems such as soil erosion and environmental pollution, which are detrimental to the efficient use of land and the sustainable development of cities. Existing studies have paid little attention to mining areas and lack comparative analysis of landscape changes in multiple mining pits. In this paper, the main urban area of Anshan City, where the mining areas are concentrated, was used as the research area, and the Landsat TM/OLI surface reflectance (SR) data of the Google Earth Engine (GEE) platform and the random forest algorithm were used to map the land use in 2008, 2014, and 2020. On this basis, land use dynamics and landscape pattern indices were used to analyze the changes in land use and landscape patterns in the Anshan City area. In addition, a moving window method was combined to further analyze and compare the landscape changes between different pits. The results show that:1. From 2008 to 2020, the construction land in Anshan urban area continued to decline, the forest land continued to expand, and the construction land was shifted to the forest land and cultivated land. Mining land increased before 2014 and remained almost unchanged after 2014, which is in line with the actual situation. 2. During the study period, the landscape fragmentation degree and landscape heterogeneity in the urban area of Anshan kept increasing. The high value areas of landscape fragmentation were the urban-rural combination areas and the mining areas. Among them, the reclamation of Dagushan and Donganshan is better, while the reclamation of Anqian, Yanqianshan and Xiaolingzi mines needs to be strengthened. 3. The random forest algorithm based on GEE shows a high degree of accuracy for land use classification. The overall classification accuracy in 3 years exceeds 90% and the kappa coefficient exceeds 0.85. The study results can be used as an essential reference for optimizing the urban ecological environment and provide technical backing for the urbanization construction and rational use of land in Anshan City.
- d
Electric Sliding Window Report
- datainsightsmarket.com
doc, pdf, pptUpdated Apr 13, 2025ShareFacebookTwitterEmailClick to copy linkLink copiedCiteData Insights Market (2025). Electric Sliding Window Report [Dataset]. https://www.datainsightsmarket.com/reports/electric-sliding-window-1081413ppt, pdf, docAvailable download formatsDataset updatedApr 13, 2025Dataset authored and provided byData Insights MarketLicensehttps://www.datainsightsmarket.com/privacy-policyhttps://www.datainsightsmarket.com/privacy-policy
Time period covered2025 - 2033Variables measuredMarket SizeDescriptionThe global electric sliding window market is experiencing robust growth, driven by increasing demand for energy-efficient building solutions and smart home technologies. The market's expansion is fueled by several factors, including rising construction activities across residential, commercial, and public sectors globally. The preference for automated window systems, particularly in high-rise buildings and areas prone to extreme weather, is further stimulating market growth. Technological advancements leading to improved energy efficiency, enhanced security features, and user-friendly controls are also playing a crucial role. Horizontal sliding windows currently dominate the market due to their widespread use in residential settings and ease of integration with smart home systems. However, the vertical sliding window segment is expected to witness significant growth, driven by its increasing adoption in commercial and public buildings, where space optimization is a key concern. Competition within the market is intense, with established players like VELFAC, Schüco, and others vying for market share through innovation, strategic partnerships, and expansion into new geographical regions. While rising raw material costs and complex installation processes pose some challenges, the overall market outlook remains positive, with projections indicating a sustained CAGR throughout the forecast period. The Asia-Pacific region, particularly China and India, is anticipated to showcase substantial growth due to rapid urbanization and increasing infrastructure development. North America and Europe also remain significant markets, with a focus on eco-friendly building regulations and rising consumer awareness of sustainable living. The market is witnessing a shift towards customizable and integrated solutions, with windows offering features such as integrated sensors, remote control capabilities, and enhanced security features. Manufacturers are investing heavily in research and development to enhance the energy efficiency of their products, leading to the creation of windows with improved insulation and self-cleaning properties. This trend towards innovation and diversification is expected to shape the competitive landscape in the years to come, with a continued focus on delivering high-performance, aesthetically pleasing, and sustainable electric sliding window solutions.
- D
Double Glazed Heavy Duty Sliding Windows Report
- datainsightsmarket.com
doc, pdf, pptUpdated Jul 6, 2025ShareFacebookTwitterEmailClick to copy linkLink copiedCiteData Insights Market (2025). Double Glazed Heavy Duty Sliding Windows Report [Dataset]. https://www.datainsightsmarket.com/reports/double-glazed-heavy-duty-sliding-windows-422363ppt, doc, pdfAvailable download formatsDataset updatedJul 6, 2025Dataset authored and provided byData Insights MarketLicensehttps://www.datainsightsmarket.com/privacy-policyhttps://www.datainsightsmarket.com/privacy-policy
Time period covered2025 - 2033Area coveredGlobalVariables measuredMarket SizeDescriptionThe global market for double glazed heavy-duty sliding windows is experiencing robust growth, driven by increasing demand for energy-efficient building solutions and enhanced security features. The market's expansion is fueled by several key factors, including rising construction activities in both residential and commercial sectors, particularly in regions with extreme weather conditions. Furthermore, growing consumer awareness regarding energy conservation and the associated cost savings are significantly impacting purchasing decisions. Stringent building codes and regulations in various countries mandating higher energy efficiency standards further bolster market growth. Leading manufacturers such as Pella, Andersen, and Milgard are investing in innovative designs and materials to cater to the growing demand for durable and aesthetically pleasing heavy-duty sliding windows. Technological advancements in glass coatings and frame materials are also contributing to the development of superior products, offering improved insulation and soundproofing capabilities. While the market faces challenges such as fluctuating raw material prices and potential supply chain disruptions, the overall outlook remains positive with a projected steady Compound Annual Growth Rate (CAGR) over the forecast period. The competitive landscape is characterized by a mix of established players and emerging regional manufacturers. Established players are focusing on expanding their product portfolios, strengthening their distribution networks, and adopting innovative marketing strategies to maintain their market share. Regional players are capitalizing on localized demand and offering competitive pricing to gain traction. Future market growth will be largely influenced by technological innovations focusing on smart window technologies, improved energy efficiency metrics, and sustainable manufacturing processes. The integration of smart home technologies, such as automated opening and closing systems, is anticipated to drive further demand. Market segmentation analysis shows substantial growth potential in both residential and commercial applications across various geographical regions, influenced by factors such as climate conditions and building codes.
FacebookTwitterA moving window analysis for exploring landscape and geologic controls on spatial patterning of streambank groundwater discharge
Preferential groundwater discharge to streams and rivers is important for a range of hydrologic and ecological functions, from providing baseflow and thermal refuge to delivering excess nutrients and other contaminants. Improving our understanding of the spatial distribution and longitudinal extent of these groundwater expressions necessitates updated mapping and modeling techniques. Here we provide the dataset and code that enables the research community to replicate our moving window analysis which was used to analyze riverscape and landscape attributes along 5th order study river sections of the Farmington and Housatonic Rivers (a 26km river section near Tariffville, CT; and a 12km river section near Ashley Falls, MA, USA, respectively)., The dataset and detailed description of collection and analysis is available publically at doi: 10.5066/P9FTZ0DK and doi: 10.5066/P915E8JY. The provided zip file contains the data, R code, python code, and outputs associated with our moving windows analysis reported in the associated paper (Article DOI: 10.1002/hyp.15112)., This analysis was run using ArcMAP (v.10.8.1; ESRI) using external python scripts ran on Python 2.7.18 Shell. Additional preprocessing was run using R version 4.0.3 (2020-10-10). Download the zip file containing the proper file structure and run the pre-analysis and analysis scripts in their correctly numbered order to recreate the moving window analysis. Make sure that the correct file paths are being used when running the scripts., This zip directory contains the data, R code, python code, and outputs associated with our moving windows analysis reported in the associated paper (Article DOI: 10.1002/hyp.15112).
Contact: Ashley Helton (ashley.helthon@uconn.edu) or Kevin Jackson (kevin.jackson@umces.edu).
This dataset enables the replication of a moving window analysis used to calculate riverscape and landscape geomorphometrics, land use land cover characteristics, and subsurface characteristics for two river study sections along the Farmington and Housatonic Rivers. This README file was generated on 2024-02-22 by Kevin Jackson.
#########################################################################
GENERAL INFORMATION
Title of Dataset: A Moving Window Analysis for Exploring Landscape and Geologic Controls on Spatial Patterning of Streambank Groundwater Discharge
Author Information A. Principal Investigator Contact Information Name: Kevin J...