- t
MS-ASL - Dataset - LDM
- service.tib.eu
Updated Jan 3, 2025 Share
Share Facebook
 Twitter
 EmailClick to copy linkLink copiedCite(2025). MS-ASL - Dataset - LDM [Dataset]. https://service.tib.eu/ldmservice/dataset/ms-aslDataset updatedJan 3, 2025Description
The MS-ASL dataset is a large-scale isolated American Sign Language dataset containing 25,000 samples from 1000 different signs performed by 200 different signers.
- O
MS-ASL
- opendatalab.com
zipUpdated Jun 15, 2018ShareFacebookTwitterEmailClick to copy linkLink copiedCiteMicrosoft (2018). MS-ASL [Dataset]. https://opendatalab.com/OpenDataLab/MS-ASLzip(10227577 bytes)Available download formatsDataset updatedJun 15, 2018Dataset provided byMicrosoftDescriptionSign language recognition is a challenging and often underestimated problem comprising multi-modal articulators (handshape, orientation, movement, upper body and face) that integrate asynchronously on multiple streams. Learning powerful statistical models in such a scenario requires much data, particularly to apply recent advances of the field. However, labeled data is a scarce resource for sign language due to the enormous cost of transcribing these unwritten languages. We propose the first real-life large-scale sign language data set comprising over 25,000 annotated videos, which we thoroughly evaluate with state-of-the-art methods from sign and related action recognition. Unlike the current state-of-the-art, the data set allows to investigate the generalization to unseen individuals (signer-independent test) in a realistic setting with over 200 signers. Previous work mostly deals with limited vocabulary tasks, while here, we cover a large class count of 1000 signs in challenging and unconstrained real-life recording conditions. We further propose I3D, known from video classifications, as a powerful and suitable architecture for sign language recognition, outperforming the current state-of-the-art by a large margin. The data set is publicly available to the community.
- N
ASL:MS-NC
- neurovault.org
zipUpdated Sep 29, 2017+ more versionsShareFacebookTwitterEmailClick to copy linkLink copiedCite(2017). ASL:MS-NC [Dataset]. http://identifiers.org/neurovault.collection:3018zipAvailable download formatsUnique identifierhttps://identifiers.org/neurovault.collection:3018Dataset updatedSep 29, 2017LicenseCC0 1.0 Universal Public Domain Dedicationhttps://creativecommons.org/publicdomain/zero/1.0/
License information was derived automaticallyArea coveredNorth CarolinaDescriptionA collection of 1 brain maps. Each brain map is a 3D array of values representing properties of the brain at different locations.
Collection description
- N
ASL:MS-NC: ASL:MS-NC
- neurovault.org
niftiUpdated Sep 29, 2017+ more versionsShareFacebookTwitterEmailClick to copy linkLink copiedCite(2017). ASL:MS-NC: ASL:MS-NC [Dataset]. http://identifiers.org/neurovault.image:54633niftiAvailable download formatsUnique identifierhttps://identifiers.org/neurovault.image:54633Dataset updatedSep 29, 2017LicenseCC0 1.0 Universal Public Domain Dedicationhttps://creativecommons.org/publicdomain/zero/1.0/
License information was derived automaticallyArea coveredNorth CarolinaDescription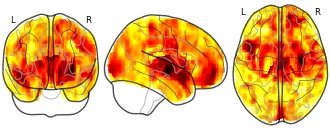
Collection description
Subject species
homo sapiens
Modality
Structural MRI
Cognitive paradigm (task)
2nd-order rule acquisition
Map type
T
- S
Figure 3. ALIX regulates MS orientation in DrosophilaNBs and asymmetrically
...- search.sourcedata.io
zipUpdated Jun 1, 2018ShareFacebookTwitterEmailClick to copy linkLink copiedCiteLene Malerød; Roland Le Borgne; Anette Lie-Jensen; Åsmund, H. Eikenes; Andreas Brech; Knut Liestøl; Harald Stenmark; Kaisa Haglund; Malerød L; Le Borgne R; Lie-Jensen A; Eikenes; Brech A; Liestøl K; Stenmark H; Haglund K (2018). : Figure 3-D [Dataset]. https://search.sourcedata.io/panel/cache/60419zipAvailable download formatsDataset updatedJun 1, 2018AuthorsLene Malerød; Roland Le Borgne; Anette Lie-Jensen; Åsmund, H. Eikenes; Andreas Brech; Knut Liestøl; Harald Stenmark; Kaisa Haglund; Malerød L; Le Borgne R; Lie-Jensen A; Eikenes; Brech A; Liestøl K; Stenmark H; Haglund KLicenseAttribution 2.0 (CC BY 2.0)https://creativecommons.org/licenses/by/2.0/
License information was derived automaticallyVariables measuredAsl, SOPs, α-tubulinDescription(D) Time-lapse imaging of Asl-YFP, α-tubulin-GFP in control (left panel) and alix3 (right panel) mutant SOPs of the pupal notum. SOPs were identified by the apical meshwork of MTs (not shown). Time is indicated in min:sec. Mitotic cells are indicated with arrows. Scale bar represents 5 μm. List of tagged entities: asl (uniprot:Q9VNE4), α-tubulin, SOPs, ALiX (ncbigene:43330), imaging method (bao:BAO_0000452)
ds000254_R1.0.0
- openneuro.org
Updated Jul 17, 2018ShareFacebookTwitterEmailClick to copy linkLink copiedCiteAlexander D. Cohen; Andrew S. Nencka; Yang Wang (2018). ds000254_R1.0.0 [Dataset]. https://openneuro.org/datasets/ds000254/versions/00001Dataset updatedJul 17, 2018AuthorsAlexander D. Cohen; Andrew S. Nencka; Yang WangLicenseCC0 1.0 Universal Public Domain Dedicationhttps://creativecommons.org/publicdomain/zero/1.0/
License information was derived automaticallyDescriptionThis dataset contains resting state data collected using a multiband, multiecho simultaneous pseudocontinous ASL (pCASL) and BOLD acquisition. Additional information regarding the sequence is as follows:
The sequence consists of an unbalanced pseudo-continuous ASL (pCASL) tagging module, followed by a post labeling delay period (PLD). Following the PLD, a multiband excitation and multi-echo, gradient-echo EPI readout was implemented. Blipped-CAIPI was also applied to reduce g-factor noise amplification caused by the slice-unaliasing in MB imaging. Each echo in the multi-echo acquisition was obtained consecutively as part of one shot. The last repetition is the M0 image collected for quantification of CBF. Each subject underwent one bilateral finger tapping task MBME ASL/BOLD scan, which utilized an unbalanced pCASL labeling scheme with labeling time=1.5 s and PLD=1.5 s. A partial k-space acquisition was employed with 20 overscan lines. To keep the later TEs within reasonable ranges and reduce total readout time, in-plane acceleration was employed with R=2. Additional parameters for the MBME ASL/BOLD run were as follows: number of echoes=4, TE=9.1, 25, 39.6, 54.3 ms, TR=3.5 s, MB-factor=4, number of excitations=11 (total slices=11×4=44), FOV=240 mm, resolution=3×3×3 mm, FA=90°, RF pulse width=6400 ms. Scans lasted 356s, which included 64s of calibration reps at the beginning of the scan. In total 73 repetitions were acquired.
Comments added by Openfmri Curators
===========================================
General Comments
T2 data wasn’t used for any of the analysis in the paper though they were acquired as per the paper.
Defacing
Pydeface was used on all anatomical images to ensure de-identification of subjects. The code can be found at https://github.com/poldracklab/pydeface
Quality Control
MRIQC was run on the dataset. Results are located in derivatives/mriqc. Learn more about it here: https://mriqc.readthedocs.io/en/stable/
Where to discuss the dataset
1) www.openfmri.org/dataset/ds******/ See the comments section at the bottom of the dataset page. 2) www.neurostars.org Please tag any discussion topics with the tags openfmri and dsXXXXXX. 3) Send an email to submissions@openfmri.org. Please include the accession number in your email.
Known Issues
- f
Summary of mean ± standard deviations in WM and GM of FA, AD (μm2/ms), MD...
- figshare.com
xlsUpdated Jun 1, 2023ShareFacebookTwitterEmailClick to copy linkLink copiedCiteStéphanie Giezendanner; Melanie Sarah Fisler; Leila Maria Soravia; Jennifer Andreotti; Sebastian Walther; Roland Wiest; Thomas Dierks; Andrea Federspiel (2023). Summary of mean ± standard deviations in WM and GM of FA, AD (μm2/ms), MD (μm2/ms), RD (μm2/ms), CBF, SNR and ASL signal (%) across subjects (n = 43). [Dataset]. http://doi.org/10.1371/journal.pone.0150657.t001xlsAvailable download formatsUnique identifierhttps://doi.org/10.1371/journal.pone.0150657.t001Dataset updatedJun 1, 2023Dataset provided byPLOS ONEAuthorsStéphanie Giezendanner; Melanie Sarah Fisler; Leila Maria Soravia; Jennifer Andreotti; Sebastian Walther; Roland Wiest; Thomas Dierks; Andrea FederspielLicenseAttribution 4.0 (CC BY 4.0)https://creativecommons.org/licenses/by/4.0/
License information was derived automaticallyDescriptionSummary of mean ± standard deviations in WM and GM of FA, AD (μm2/ms), MD (μm2/ms), RD (μm2/ms), CBF, SNR and ASL signal (%) across subjects (n = 43).
Example FAIR ASL Acquisition on a Philips Scanner
- zenodo.org
application/gzip +1Updated Mar 14, 2025ShareFacebookTwitterEmailClick to copy linkLink copiedCiteAlexander Daniel; Alexander Daniel (2025). Example FAIR ASL Acquisition on a Philips Scanner [Dataset]. http://doi.org/10.5281/zenodo.15025420application/gzip, jsonAvailable download formatsUnique identifierhttps://doi.org/10.5281/zenodo.15025420Dataset updatedMar 14, 2025AuthorsAlexander Daniel; Alexander DanielLicenseAttribution 4.0 (CC BY 4.0)https://creativecommons.org/licenses/by/4.0/
License information was derived automaticallyDescriptionExample FAIR ASL Acquisition on a Philips Scanner. Post label delay of 1500 ms.
- u
Non-invasive MRI of Blood-Cerebospinal Fluid Barrier Function; Combined...
- rdr.ucl.ac.uk
binUpdated Apr 3, 2020ShareFacebookTwitterEmailClick to copy linkLink copiedCiteJack Wells (2020). Non-invasive MRI of Blood-Cerebospinal Fluid Barrier Function; Combined Diffusion/ ASL sequence (Figure 1 E) [Dataset]. http://doi.org/10.5522/04/12063558.v1binAvailable download formatsUnique identifierhttps://doi.org/10.5522/04/12063558.v1Dataset updatedApr 3, 2020Dataset provided byUniversity College LondonAuthorsJack WellsLicenseAttribution 4.0 (CC BY 4.0)https://creativecommons.org/licenses/by/4.0/
License information was derived automaticallyDescriptionThis is the combined diffusion-weighed / arterial spin labelling data set from the work 'Non-invasive MRI of Blood-Cerebrospinal Fluid Barrier Function' (Evans et al., 2020, Figure 1E].
The experiments were designed to ensure there was negligible intra-vascular signal contributions from the BCSFB-ASL signal.
The data is in Matlab format. The BCSFB-ASL data is in a 4D array where the first two array elements are the 2D MRI images, the 3rd element is the interleaved tagged and control images (inner most loop) together with the B0 and diffusion weighted images (b=200 s/mm2) together with the number of repetitions (outer most loop, 20 repetitions) and the 4th element is the number of inflow times (750, 2750 and 6500 ms).The traditional ASL data is in the same format but there is only 1 inflow time (750ms) and 5 rather then 20 repetitions.
Resting State Perfusion in Healthy Aging
- openneuro.org
Updated Jul 28, 2021ShareFacebookTwitterEmailClick to copy linkLink copiedCiteAlvaro Galiano; Reyes Garcia de Eulate; Marta Vidorreta; Miriam Recio; Mario Riverol; José L. Zubieta; Maria A. Fernandez-Seara PhD (2021). Resting State Perfusion in Healthy Aging [Dataset]. http://doi.org/10.18112/openneuro.ds000240.v1.0.0Unique identifierhttps://doi.org/10.18112/openneuro.ds000240.v1.0.0Dataset updatedJul 28, 2021AuthorsAlvaro Galiano; Reyes Garcia de Eulate; Marta Vidorreta; Miriam Recio; Mario Riverol; José L. Zubieta; Maria A. Fernandez-Seara PhDLicenseCC0 1.0 Universal Public Domain Dedicationhttps://creativecommons.org/publicdomain/zero/1.0/
License information was derived automaticallyDescriptionAll subjects underwent an MRI resting-state scan. Subjects were instructed to lie still with their eyes open, without falling asleep. Immediately after this scan, they were asked whether they fell asleep, and none of them reported they did. The MRI examination was carried out on a 3T whole-body MRI scanner (Trio TIM), using the body coil as transmitter and a 32-channel phased-array head coil as receiver. The imaging protocol included a 3D high-resolution anatomical T1-weighted MPRAGE sequence (with inversion time (TI) = 950 ms, repetition time (TR) = 1760 ms, echo-time (TE) = 3.1 ms, resolution = 1 mm isotropic, scan time = 5:08 min). This sequence was followed by an ASL sequence that combined pseudo-continuous labeling (PCASL) with a background-suppressed 3D GRASE single-shot readout. The labeling parameters were as follows: Hanning-shaped RF pulses, B1average = 1.8 microT, RFduration = 500 micro.sec, spacing = 500 micro.sec, Gaverage = 1mT/m, Gmaximum/Gaverage = 8, labeling duration = 1600 ms, post-labeling delay = 1500 ms. The imaging parameters were as follows: TR = 3.5 sec, TE = 29 msec, resolution = 4x4x7 mm3, FOV = 250x188x112 mm3 , 16 nominal partitions with 12.5% oversampling, 5/8 slice partial Fourier, matrix size = 64x49x11, BW = 2790Hz/pixel, gradient-echo spacing = 0.4 msec (with ramp sampling), spin-echo spacing = 29 msec, read-out time = 270 msec. Details of the background suppression scheme can be found in [1]. 50 pairs of label and control images were acquired in 6 minutes. A short scan of 5 label/control pairs was performed using the same sequence without background suppression to acquire control images needed for calculation of CBF, this 10 images are allocated at the beginning of each ASL sequence, so each subject ASL sequence has 110 images.
References: 1. Vidorreta M, Wang Z, Rodriguez I, Pastor MA, Detre JA, et al. (2013) Comparison of 2D and 3D single-shot ASL perfusion fMRI sequences. Neuroimage 66: 662-671.
- f
Detection of crossed cerebellar diaschisis in hyperacute ischemic stroke...
- plos.figshare.com
docxUpdated Jun 1, 2023ShareFacebookTwitterEmailClick to copy linkLink copiedCiteKoung Mi Kang; Chul-Ho Sohn; Seung Hong Choi; Keun-Hwa Jung; Roh-Eul Yoo; Tae Jin Yun; Ji-hoon Kim; Sun-Won Park (2023). Detection of crossed cerebellar diaschisis in hyperacute ischemic stroke using arterial spin-labeled MR imaging [Dataset]. http://doi.org/10.1371/journal.pone.0173971docxAvailable download formatsUnique identifierhttps://doi.org/10.1371/journal.pone.0173971Dataset updatedJun 1, 2023Dataset provided byPLOS ONEAuthorsKoung Mi Kang; Chul-Ho Sohn; Seung Hong Choi; Keun-Hwa Jung; Roh-Eul Yoo; Tae Jin Yun; Ji-hoon Kim; Sun-Won ParkLicenseAttribution 4.0 (CC BY 4.0)https://creativecommons.org/licenses/by/4.0/
License information was derived automaticallyDescriptionBackground and purposeArterial spin-labeling (ASL) was recently introduced as a noninvasive method to evaluate cerebral hemodynamics. The purposes of this study were to assess the ability of ASL imaging to detect crossed cerebellar diaschisis (CCD) in patients with their first unilateral supratentorial hyperacute stroke and to identify imaging or clinical factors significantly associated with CCD.Materials and methodsWe reviewed 204 consecutive patients who underwent MRI less than 8 hours after the onset of stroke symptoms. The inclusion criteria were supratentorial abnormality in diffusion-weighted images in the absence of a cerebellar or brain stem lesion, bilateral supratentorial infarction, subacute or chronic infarction, and MR angiography showing vertebrobasilar system disease. For qualitative analysis, asymmetric cerebellar hypoperfusion in ASL images was categorized into 3 grades. Quantitative analysis was performed to calculate the asymmetric index (AI). The patients’ demographic and clinical features and outcomes were recorded. Univariate and multivariate analyses were also performed.ResultsA total of 32 patients met the inclusion criteria, and 24 (75%) presented CCD. Univariate analyses revealed more frequent arterial occlusions, higher diffusion-weighted imaging (DWI) lesion volumes and higher initial NIHSS and mRS scores in the CCD-positive group compared with the CCD-negative group (all p < .05). The presence of arterial occlusion and the initial mRS scores were related with the AI (all p < .05). Multivariate analyses revealed that arterial occlusion and the initial mRS scores were significantly associated with CCD and AI.ConclusionASL imaging could detect CCD in 75% of patients with hyperacute infarction. We found that CCD was more prevalent in patients with arterial occlusion, larger ischemic brain volumes, and higher initial NIHSS and mRS scores. In particular, vessel occlusion and initial mRS score appeared to be significantly related with CCD pathophysiology in the hyperacute stage.
- f
Data_Sheet_1_Decreased Cerebral Blood Flow and Delayed Arterial Transit Are...
- frontiersin.figshare.com
docxUpdated Jun 10, 2023ShareFacebookTwitterEmailClick to copy linkLink copiedCiteRuiting Zhang; Peiyu Huang; Shuyue Wang; Yeerfan Jiaerken; Hui Hong; Yao Zhang; Xinfeng Yu; Min Lou; Minming Zhang (2023). Data_Sheet_1_Decreased Cerebral Blood Flow and Delayed Arterial Transit Are Independently Associated With White Matter Hyperintensity.docx [Dataset]. http://doi.org/10.3389/fnagi.2022.762745.s001docxAvailable download formatsUnique identifierhttps://doi.org/10.3389/fnagi.2022.762745.s001Dataset updatedJun 10, 2023Dataset provided byFrontiersAuthorsRuiting Zhang; Peiyu Huang; Shuyue Wang; Yeerfan Jiaerken; Hui Hong; Yao Zhang; Xinfeng Yu; Min Lou; Minming ZhangLicenseAttribution 4.0 (CC BY 4.0)https://creativecommons.org/licenses/by/4.0/
License information was derived automaticallyDescriptionAimWhite matter hyperintensities (WMH) and lacunes were important features of cerebral small vessel disease (CSVD), which contributes to 25% of ischemic strokes and 45% of dementias. Currently, the underlying mechanisms of WMH and lacunes are not clear, and the role of hemodynamic changes is not fully investigated. In this study, we aimed to measure the cerebral blood flow (CBF) and arterial transit in CSVD patients and to investigate their association with WMH and lacunes.MethodsWe retrospectively analyzed the prospectively collected database of CSVD patients. Ninety-two CSVD patients with complete imaging data were included. We used arterial spin labeling (ASL) with post-labeling delay time (PLD) of 1,525 ms and 2,025 ms to measure CBF respectively, and the difference between CBFPLD1.5 and CBFPLD2.0 was recorded as δCBF. We performed regression analysis to understand the contribution of CBF, δCBF to CSVD imaging markers.ResultsWe found that CBF derived from both PLDs was associated with WMH volume and the presence of lacune. CBFPLD1.5 was significantly lower than CBFPLD2.0 in CSVD patients, and δCBF was correlated with WMH volume but not the presence of lacune. Furthermore, CBFPLD2.0 and δCBF were both associated with WMH in multiple regression analyses, suggesting an independent effect of delayed arterial transit. On an exploratory basis, we also investigated the relationship between venous disruption on δCBF, and we found that δCBF correlated with deep medullary veins score.ConclusionBoth CBF and arterial transit were associated with WMH. ASL with multiple PLDs could provide additional hemodynamic information to CSVD-related studies.

Not seeing a result you expected?
Learn how you can add new datasets to our index.
FacebookTwitterThe MS-ASL dataset is a large-scale isolated American Sign Language dataset containing 25,000 samples from 1000 different signs performed by 200 different signers.