Obesity prevalence among U.S. adults aged 18 and over 2011-2023
- statista.com
Updated Oct 16, 2024 Share
Share Facebook
 Twitter
 EmailClick to copy linkLink copiedCiteStatista (2024). Obesity prevalence among U.S. adults aged 18 and over 2011-2023 [Dataset]. https://www.statista.com/statistics/244620/us-obesity-prevalence-among-adults-aged-20-and-over/Dataset updatedOct 16, 2024Area coveredUnited StatesDescription
The prevalence of obesity in the United States has risen gradually over the past decade. As of 2023, around 33 percent of the population aged 18 years and older was obese. Obesity is a growing problem in many parts of the world, but is particularly troubling in the United States. Obesity in the United States The states with the highest prevalence of obesity are West Virginia, Mississippi, and Arkansas. As of 2023, a shocking 41 percent of the population in West Virginia were obese. The percentage of adults aged 65 years and older who are obese has grown in recent years, compounding health issues that develop with age. Health impacts of obesity Obesity is linked to several negative health impacts including cardiovascular disease, diabetes, and certain types of cancer. Unsurprisingly, the prevalence of diagnosed diabetes has increased in the United States over the years. As of 2022, around 8.4 percent of the population had been diagnosed with diabetes. Some of the most common types of cancers caused by obesity include breast cancer in postmenopausal women, colon and rectum cancer, and corpus and uterus cancer.
Percentage of obese U.S. adults by state 2023
- statista.com
Updated Oct 28, 2024ShareFacebookTwitterEmailClick to copy linkLink copiedCiteStatista (2024). Percentage of obese U.S. adults by state 2023 [Dataset]. https://www.statista.com/statistics/378988/us-obesity-rate-by-state/Dataset updatedOct 28, 2024Time period covered2023Area coveredUnited StatesDescriptionWest Virginia, Mississippi, and Arkansas are the U.S. states with the highest percentage of their population who are obese. The states with the lowest percentage of their population who are obese include Colorado, Hawaii, and Massachusetts. Obesity in the United States Obesity is a growing problem in many countries around the world, but the United States has the highest rate of obesity among all OECD countries. The prevalence of obesity in the United States has risen steadily over the previous two decades, with no signs of declining. Obesity in the U.S. is more common among women than men, and overweight and obesity rates are higher among African Americans than any other race or ethnicity. Causes and health impacts Obesity is most commonly the result of a combination of poor diet, overeating, physical inactivity, and a genetic susceptibility. Obesity is associated with various negative health impacts, including an increased risk of cardiovascular diseases, certain types of cancer, and diabetes type 2. As of 2022, around 8.4 percent of the U.S. population had been diagnosed with diabetes. Diabetes is currently the eighth leading cause of death in the United States.
- a
Childhood Obese and Overweight Estimate, NM Counties, 2016
- hub.arcgis.com
Updated Jul 28, 2022+ more versionsShareFacebookTwitterEmailClick to copy linkLink copiedCiteNew Mexico Community Data Collaborative (2022). Childhood Obese and Overweight Estimate, NM Counties, 2016 [Dataset]. https://hub.arcgis.com/maps/NMCDC::childhood-obese-and-overweight-estimate-nm-counties-2016/aboutDataset updatedJul 28, 2022Dataset authored and provided byNew Mexico Community Data CollaborativeArea coveredDescriptionFor more recent aggregated data reports on childhood obesity in NM, visit NM Healthy Kids Healthy Communities Program, NMDOH: https://www.nmhealth.org/about/phd/pchb/hknm/TitleChildhood Obese and Overweight Estimates, NM Counties 2016 - NMCHILDOBESITY2017SummaryCounty level childhood overweight and obese estimates for 2016 in New Mexico. *Most recent data known to be available on childhood obesity*NotesThis map shows NM County estimated rates of childhood overweight and obesity. US data is available upon request. Published in May, 2022. Data is most recent known sub-national obesity data set. If you know of another resource or more recent, please reach out. emcrae@chi-phi.orgSourceData set produced from the American Journal of Epidemiology and with authors and contributors out of the University of South Carolina, using data from the National Survey of Children's Health. Journal SourceZgodic, A., Eberth, J. M., Breneman, C. B., Wende, M. E., Kaczynski, A. T., Liese, A. D., & McLain, A. C. (2021). Estimates of childhood overweight and obesity at the region, state, and county levels: A multilevel small-area estimation approach. American Journal of Epidemiology, 190(12), 2618–2629. https://doi.org/10.1093/aje/kwab176 Journal article uses data fromThe United States Census Bureau, Associate Director of Demographic Programs, National Survey of Children’s Health 2020 National Survey of Children's Health Frequently Asked Questions. October 2021. Available from:https://www.census.gov/programs-surveys/nsch/data/datasets.htmlGIS Data Layer prepared byEMcRae_NMCDCFeature Servicehttps://nmcdc.maps.arcgis.com/home/item.html?id=80da398a71c14539bfb7810b5d9d5a99AliasDefinitionregionRegion NationallystateState (data set is NM only but national data is available upon request)fips_numCounty FIPScountyCounty NamerateRate of Obesitylower_ciLower Confidence Intervalupper_ciUpper Confidence IntervalfipstxtCounty FIPS text
Nutrition, Physical Activity, and Obesity - American Community Survey
- catalog.data.gov
- data.virginia.gov
- +5more
Updated Feb 4, 2025+ more versionsShareFacebookTwitterEmailClick to copy linkLink copiedCiteCenters for Disease Control and Prevention (2025). Nutrition, Physical Activity, and Obesity - American Community Survey [Dataset]. https://catalog.data.gov/dataset/nutrition-physical-activity-and-obesity-american-community-surveyDataset updatedFeb 4, 2025DescriptionThis dataset includes select data from the U.S. Census Bureau's American Community Survey (ACS) on the percent of adults who bike or walk to work. This data is used for DNPAO's Data, Trends, and Maps database, which provides national and state specific data on obesity, nutrition, physical activity, and breastfeeding. For more information about ACS visit https://www.census.gov/programs-surveys/acs/.
Percentage of U.S. children and adolescents who were obese 1988-2018
- statista.com
Updated May 24, 2024ShareFacebookTwitterEmailClick to copy linkLink copiedCiteStatista (2024). Percentage of U.S. children and adolescents who were obese 1988-2018 [Dataset]. https://www.statista.com/statistics/285035/percentage-of-us-children-and-adolescents-who-were-obese/Dataset updatedMay 24, 2024Area coveredUnited StatesDescriptionBetween 2015 and 2018, obesity rates in U.S. children and adolescents stood at 19.3 and 20.9 percent, respectively. This is a noteworthy increase compared to the percentages seen between 1988 and 1994.
U.S. high school obesity rates
Roughly 18 percent of black, as well as Hispanic students in the United States, were obese between 2016 and 2017. Male obesity rates were noticeably higher than those of female students for each of the ethnicities during the measured period. For example, about 22 percent of male Hispanic high school students were obese, compared to 14 percent of female students. The American states with the highest number of obese high school students in 2019 included Mississippi, West Virginia, and Arkansas, respectively. Mississippi had a high school student obesity rate of over 23 percent that year.
Physically inactive Americans
Adults from Mississippi and Arkansas were also reported to be some of the least physically active people in the United States in 2018. When surveyed, over 30 percent of adults from Kentucky and Arkansas had not exercised within the preceding 30 days. The national physical inactivity average stood at approximately 26 percent that year.
- w
Community Health: Age-adjusted percentage of adults overweight or obese (BMI...
- data.wu.ac.at
Updated Aug 24, 2016+ more versionsShareFacebookTwitterEmailClick to copy linkLink copiedCiteOpen Data NY - DOH (2016). Community Health: Age-adjusted percentage of adults overweight or obese (BMI 25 or higher): 2008 - 2009 [Dataset]. https://data.wu.ac.at/schema/health_data_ny_gov/eG5jMy0yM3ZtDataset updatedAug 24, 2016Dataset provided byOpen Data NY - DOHDescriptionThis chart shows the age-adjusted percentage of adults overweight or obese (BMI 25 or higher) by county. New York State Community Health Indicator Reports (CHIRS) were developed in 2012, and annually updated to provide data for over 300 health indicators, organized by 15 health topic and data for all counties, regions and state. To show only certain counties in the chart, enter the names of the counties in the county filter under the Filter tab. For more information, check out: http://www.health.ny.gov/statistics/chac/indicators/. The "About" tab contains additional details concerning this dataset.
- A
Nutrition, Physical Activity, and Obesity - Policy and Environmental Data
- data.amerigeoss.org
- healthdata.gov
- +5more
csv, json, rdf, xmlUpdated Nov 16, 2018+ more versionsShareFacebookTwitterEmailClick to copy linkLink copiedCiteUnited States (2018). Nutrition, Physical Activity, and Obesity - Policy and Environmental Data [Dataset]. https://data.amerigeoss.org/ro/dataset/nutrition-physical-activity-and-obesity-policy-and-environmental-data-6cd87xml, csv, rdf, jsonAvailable download formatsDataset updatedNov 16, 2018Dataset provided byUnited StatesDescriptionThis dataset includes data on policy and environmental supports for physical activity, diet, and breastfeeding. This data is used for DNPAO's Data, Trends, and Maps database, which provides national and state specific data on obesity, nutrition, physical activity, and breastfeeding.
U.S. adult obesity prevalence in 2023, by annual income
- statista.com
Updated Nov 28, 2024ShareFacebookTwitterEmailClick to copy linkLink copiedCiteStatista (2024). U.S. adult obesity prevalence in 2023, by annual income [Dataset]. https://www.statista.com/statistics/237141/us-obesity-by-annual-income/Dataset updatedNov 28, 2024Time period covered2023Area coveredUnited StatesDescriptionIn 2023, it was estimated that around 37 percent of adults with an annual income of less than 15,000 U.S. dollars were obese, compared to 29 percent of those with an annual income of 75,000 dollars or more. This statistic shows the percentage of U.S. adults who were obese in 2023, by income.
- w
Community Health: Percentage of pregnant women in WIC who were pre-pregnancy...
- data.wu.ac.at
Updated Aug 24, 2016+ more versionsShareFacebookTwitterEmailClick to copy linkLink copiedCiteOpen Data NY - DOH (2016). Community Health: Percentage of pregnant women in WIC who were pre-pregnancy obese (BMI 30 or higher): 2010 - 2012 [Dataset]. https://data.wu.ac.at/odso/health_data_ny_gov/cXV0ci1rZ2Y5Dataset updatedAug 24, 2016Dataset provided byOpen Data NY - DOHDescriptionThis chart shows the percentage of pregnant women in WIC who were pre-pregnancy obese (BMI 30 or higher) by county. New York State Community Health Indicator Reports (CHIRS) were developed in 2012, and annually updated to provide data for over 300 health indicators, organized by 15 health topic and data for all counties, regions and state. To show only certain counties in the chart, enter the names of the counties in the county filter under the Filter tab. For more information, check out: http://www.health.ny.gov/statistics/chac/indicators/. The "About" tab contains additional details concerning this dataset.
- f
Data Sheet 1_Exploring avocado consumption and health: a scoping review and...
- frontiersin.figshare.com
- figshare.com
csvUpdated Feb 10, 2025+ more versionsShareFacebookTwitterEmailClick to copy linkLink copiedCiteStephen A. Fleming; Tristen L. Paul; Rachel A. F. Fleming; Alison K. Ventura; Megan A. McCrory; Corrie M. Whisner; Paul A. Spagnuolo; Louise Dye; Jana Kraft; Nikki A. Ford (2025). Data Sheet 1_Exploring avocado consumption and health: a scoping review and evidence map.csv [Dataset]. http://doi.org/10.3389/fnut.2025.1488907.s001csvAvailable download formatsUnique identifierhttps://doi.org/10.3389/fnut.2025.1488907.s001Dataset updatedFeb 10, 2025Dataset provided byFrontiersAuthorsStephen A. Fleming; Tristen L. Paul; Rachel A. F. Fleming; Alison K. Ventura; Megan A. McCrory; Corrie M. Whisner; Paul A. Spagnuolo; Louise Dye; Jana Kraft; Nikki A. FordLicenseAttribution 4.0 (CC BY 4.0)https://creativecommons.org/licenses/by/4.0/
License information was derived automaticallyDescriptionObjectiveThis scoping review evaluates the breadth of research on avocado intake and health, considering all populations and health outcomes (registered on Open Science Foundation at https://osf.io/nq5hk).DesignAny human intervention or observational study where effects could be isolated to consumption of avocado were included. A systematic literature search through April 2024 was conducted (PubMed, Web of Science, Scopus, and CENTRAL) and supplemented by backwards citation screening. Dual screening, data extraction, and conflict resolution were performed by three reviewers and an interactive evidence map was created.ResultsAfter deduplication, 8,823 unique records were retrieved; 58 articles met inclusion criteria, comprising 45 unique studies (28 interventions, 17 observational studies). Studies were largely conducted in the United States or Latin America and generally included adults, with overweight/obesity, frequently with elevated lipid concentrations. Interventions assessed the impact of diets enriched in monounsaturated fatty acids, diets higher/lower in carbohydrates, or in free-feeding conditions. Larger amounts of avocados were used in interventions than commonly consumed in observational studies (60–300 vs. 0–10 g/d, respectively). Blood lipids, nutrient bioavailability, cardiovascular risk, glycemia, and anthropometric variables were the most common outcomes reported across all studies.ConclusionFuture recommendations for novel research include the study of: European, Asian, adolescent or younger, and senior populations; dose–response designs and longer length interventions; dietary compensation; and the need for greater replication. The results have been made public and freely available, and a visual, interactive map was created to aid in science translation. This evidence map should enable future meta-analyses, enhance communication and transparency in avocado research, and serve as a resource for policy guidance.
- N
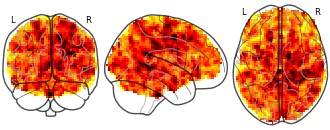
Effects of bariatric surgery on resting state functional connectivity of the...
- neurovault.org
niftiUpdated Mar 22, 2021+ more versionsShareFacebookTwitterEmailClick to copy linkLink copiedCite(2021). Effects of bariatric surgery on resting state functional connectivity of the NAcc (reward network) and PCC (default mode network): Effect of average BMI (negative) on PCC connectivity [Dataset]. http://identifiers.org/neurovault.image:441773niftiAvailable download formatsUnique identifierhttps://identifiers.org/neurovault.image:441773Dataset updatedMar 22, 2021LicenseCC0 1.0 Universal Public Domain Dedicationhttps://creativecommons.org/publicdomain/zero/1.0/
License information was derived automaticallyDescriptionModel EA3: FC ~ average BMI + change BMI + average logmFD + change logmFD + age + sex
Collection description
Obesity imposes serious health risks and involves alterations in resting-state functional connectivity of brain networks involved in eating behavior. Bariatric surgery is an effective treatment, but its effects on functional connectivity are still under debate. In this pre-registered study, we investigated the effects of bariatric surgery on major resting-state brain networks (reward and default mode network) in a longitudinal controlled design.
33 bariatric surgery patients and 15 obese waiting-list control patients (37 females; aged 44.15 ± 11.86 SD years (range 21-68)) underwent magnetic resonance imaging at baseline, after 6 and 12 months. We conducted a pre-registered whole-brain time-by-group interaction analysis, and a time-by-group interaction analysis on within-network connectivity (https://osf.io/f8tpn/, https://osf.io/59bh7/). In exploratory analyses, we investigated the effects of weight loss and head motion.
Bariatric surgery compared to waiting did not significantly affect functional connectivity (FWE-corrected p > .05), neither whole-brain nor within-network. In exploratory analyses, surgery-related BMI decrease (FWE-corrected p = .041) and higher average head motion (FWE-corrected p = .021) resulted in significantly stronger connectivity of the reward network with medial posterior frontal regions.
This pre-registered well-controlled study did not support a strong effect of bariatric surgery, compared to waiting, on major resting-state brain networks after 6 months. Exploratory analyses indicated that head motion might have confounded the effects. Data pooling and more rigorous control of within-scanner head motion during data acquisition are needed to substantiate effects of bariatric surgery on brain organization.Subject species
homo sapiens
Modality
fMRI-BOLD
Analysis level
group
Cognitive paradigm (task)
rest eyes closed
Map type
Z
- N
Effects of bariatric surgery on resting state functional connectivity of the...
- neurovault.org
niftiUpdated Mar 22, 2021+ more versionsShareFacebookTwitterEmailClick to copy linkLink copiedCite(2021). Effects of bariatric surgery on resting state functional connectivity of the NAcc (reward network) and PCC (default mode network): Main effect of group on PCC (DMN) connectivity [Dataset]. http://identifiers.org/neurovault.image:445810niftiAvailable download formatsUnique identifierhttps://identifiers.org/neurovault.image:445810Dataset updatedMar 22, 2021LicenseCC0 1.0 Universal Public Domain Dedicationhttps://creativecommons.org/publicdomain/zero/1.0/
License information was derived automaticallyDescriptionModel CA1, BARS larger than NBARS
Contrast: 1 | 1 | -1 | -1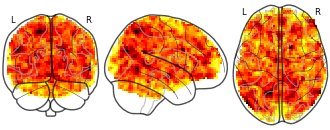
Collection description
Obesity imposes serious health risks and involves alterations in resting-state functional connectivity of brain networks involved in eating behavior. Bariatric surgery is an effective treatment, but its effects on functional connectivity are still under debate. In this pre-registered study, we investigated the effects of bariatric surgery on major resting-state brain networks (reward and default mode network) in a longitudinal controlled design.
33 bariatric surgery patients and 15 obese waiting-list control patients (37 females; aged 44.15 ± 11.86 SD years (range 21-68)) underwent magnetic resonance imaging at baseline, after 6 and 12 months. We conducted a pre-registered whole-brain time-by-group interaction analysis, and a time-by-group interaction analysis on within-network connectivity (https://osf.io/f8tpn/, https://osf.io/59bh7/). In exploratory analyses, we investigated the effects of weight loss and head motion.
Bariatric surgery compared to waiting did not significantly affect functional connectivity (FWE-corrected p > .05), neither whole-brain nor within-network. In exploratory analyses, surgery-related BMI decrease (FWE-corrected p = .041) and higher average head motion (FWE-corrected p = .021) resulted in significantly stronger connectivity of the reward network with medial posterior frontal regions.
This pre-registered well-controlled study did not support a strong effect of bariatric surgery, compared to waiting, on major resting-state brain networks after 6 months. Exploratory analyses indicated that head motion might have confounded the effects. Data pooling and more rigorous control of within-scanner head motion during data acquisition are needed to substantiate effects of bariatric surgery on brain organization.Subject species
homo sapiens
Modality
fMRI-BOLD
Analysis level
group
Cognitive paradigm (task)
rest eyes closed
Map type
Z
Wegovy sales of Novo Nordisk by quarter 2022-2024
- statista.com
Updated Feb 10, 2025ShareFacebookTwitterEmailClick to copy linkLink copiedCiteStatista (2025). Wegovy sales of Novo Nordisk by quarter 2022-2024 [Dataset]. https://www.statista.com/statistics/1416998/sales-wegovy-novo-nordisk-by-quarter/Dataset updatedFeb 10, 2025Area coveredWorldwideDescriptionQuarterly sales of weight loss and anti-obesity drug Wegovy increased more than eightfold within only one year. The drug is manufactured by Danish biopharma company Novo Nordisk, primarily known for its focus on diabetes treatments. The most recent quarterly sales figure (Q4 2024) set a record at around 20 billion Danish kronor. Why Wegovy has blockbuster potential Wegovy and Novo Nordisk have been very present in the media lately, since the drug is expected to have huge potential in markets with large populations affected by overweight and obesity. In its latest report, the World Obesity Federation estimated the global population that is obese or overweight will increase from 2.6 billion individuals in 2020 to over four billion by 2035. The United States, which is the largest pharmaceutical market globally, is also one of the most obese countries in the world. It is estimated that more than 36 percent of adult Americans are obese. Thus, the preconditions for a drug like Wegovy are more than just a given. This is also reflected in Novo Nordisk's increasing share prices and a currently record-high market capitalization. The risks of weight loss drugs Wegovy seems to cut the risks of certain conditions that usually come with overweight and obesity, like stroke and heart attack. But of course, there are also risks that must be considered. The most common side effects of the drugs are nausea, dizziness, diarrhea, and vomiting. Doctors also warn that weight loss drugs like Wegovy can lead to serious complications for patients who need anesthesia for surgery when the stomach must be completely empty. There is an increased risk of pulmonary aspiration since these drugs slow down digestion. Another problem weight loss drugs can cause is that people, instead of changing their lifestyle and mostly out of convenience, immediately turn to such drugs.

Not seeing a result you expected?
Learn how you can add new datasets to our index.
FacebookTwitterObesity prevalence among U.S. adults aged 18 and over 2011-2023
The prevalence of obesity in the United States has risen gradually over the past decade. As of 2023, around 33 percent of the population aged 18 years and older was obese. Obesity is a growing problem in many parts of the world, but is particularly troubling in the United States. Obesity in the United States The states with the highest prevalence of obesity are West Virginia, Mississippi, and Arkansas. As of 2023, a shocking 41 percent of the population in West Virginia were obese. The percentage of adults aged 65 years and older who are obese has grown in recent years, compounding health issues that develop with age. Health impacts of obesity Obesity is linked to several negative health impacts including cardiovascular disease, diabetes, and certain types of cancer. Unsurprisingly, the prevalence of diagnosed diabetes has increased in the United States over the years. As of 2022, around 8.4 percent of the population had been diagnosed with diabetes. Some of the most common types of cancers caused by obesity include breast cancer in postmenopausal women, colon and rectum cancer, and corpus and uterus cancer.