- d
Calumet & Arizona Co. Oliver Geologic Map Level 1450 Floor 11
- datadiscoverystudio.org
pdfUpdated May 7, 2014+ more versions Share
Share Facebook
 Twitter
 EmailClick to copy linkLink copiedCiteArizona Department of Mines and Mineral Resources (2014). Calumet & Arizona Co. Oliver Geologic Map Level 1450 Floor 11 [Dataset]. http://datadiscoverystudio.org/geoportal/rest/metadata/item/283ed71813ee43659344ff1164197d63/htmlpdfAvailable download formatsDataset updatedMay 7, 2014AuthorsArizona Department of Mines and Mineral ResourcesArea coveredDescription
ADMMR map collection: Calumet & Arizona Co. Oliver Geologic Map Level 1450 Floor 11; 1 in. to 50 feet; 48 x 34 in.
- w
Before Oliver Heat Map
- data.wu.ac.at
csv, json, xmlUpdated Jan 10, 2018+ more versionsShareFacebookTwitterEmailClick to copy linkLink copiedCiteBaltimore Police Department (2018). Before Oliver Heat Map [Dataset]. https://data.wu.ac.at/schema/data_baltimorecity_gov/c3R2Yi10YnF2csv, xml, jsonAvailable download formatsDataset updatedJan 10, 2018Dataset provided byBaltimore Police DepartmentLicenseAttribution 3.0 (CC BY 3.0)https://creativecommons.org/licenses/by/3.0/
License information was derived automaticallyDescriptionAll BPD data on Open Baltimore is preliminary data and subject to change. The information presented through Open Baltimore represents Part I victim based crime data. The data do not represent statistics submitted to the FBI's Uniform Crime Report (UCR); therefore any comparisons are strictly prohibited. For further clarification of UCR data, please visit http://www.fbi.gov/about-us/cjis/ucr/ucr. Please note that this data is preliminary and subject to change. Prior month data is likely to show changes when it is refreshed on a monthly basis. All data is geocoded to the approximate latitude/longitude location of the incident and excludes those records for which an address could not be geocoded. Any attempt to match the approximate location of the incident to an exact address is strictly prohibited.
- a
South Gillies & Oliver Lake, ON - Aug 31. 2024 - Survey Summary Map
- elsalvador-westernu.opendata.arcgis.com
- ntpopendata-westernu.opendata.arcgis.com
Updated Nov 6, 2024+ more versionsShareFacebookTwitterEmailClick to copy linkLink copiedCiteWestern University (2024). South Gillies & Oliver Lake, ON - Aug 31. 2024 - Survey Summary Map [Dataset]. https://elsalvador-westernu.opendata.arcgis.com/items/10ef8b6ebdb449e9ad92289da1ce2159Dataset updatedNov 6, 2024Dataset authored and provided byWestern UniversityLicenseAttribution-NonCommercial 4.0 (CC BY-NC 4.0)https://creativecommons.org/licenses/by-nc/4.0/
License information was derived automaticallyArea coveredGillies, South GilliesDescriptionSurvey summary map for the August 31, 2024 South Gillies and Oliver Lake, ON tornadoes. Ground survey conducted September 5-6, 2024. Map includes ground photos, drone photos, tornado centrelines, worst damage points, survey route and drone flight paths. All data are preliminary.
- d
USGS US Topo 7.5-minute map for Oliver Lake, IN 2010
- datadiscoverystudio.org
geopdfUpdated May 17, 2010ShareFacebookTwitterEmailClick to copy linkLink copiedCiteU.S. Geological Survey (2010). USGS US Topo 7.5-minute map for Oliver Lake, IN 2010 [Dataset]. http://datadiscoverystudio.org/geoportal/rest/metadata/item/dccd172f7eb34cd7864f1a20904faf01/htmlgeopdf(16.327671)Available download formatsDataset updatedMay 17, 2010Area coveredDescriptionLayered GeoPDF 7.5 Minute Quadrangle Map. Layers of geospatial data include orthoimagery, roads, grids, geographic names, elevation contours, hydrography, and other selected map features.
- E
UK ecological status map version 2
- catalogue.ceh.ac.uk
- cloud.csiss.gmu.edu
- +2more
zipUpdated May 23, 2016+ more versionsShareFacebookTwitterEmailClick to copy linkLink copiedCiteR. Dyer; T. Oliver (2016). UK ecological status map version 2 [Dataset]. http://doi.org/10.5285/58b248a8-6e34-4ffb-ae32-3744566399a2zipAvailable download formatsUnique identifierhttps://doi.org/10.5285/58b248a8-6e34-4ffb-ae32-3744566399a2Dataset updatedMay 23, 2016Dataset provided byNERC EDS Environmental Information Data CentreAuthorsR. Dyer; T. OliverTime period coveredJan 1, 1970 - Dec 31, 2013Area coveredDescriptionA spatial indicator of ecological status for valuation of biodiversity across the UK, based on species occurrence records for eleven taxonomic groups (Bees, Birds, Bryophytes, Butterflies, Carabidae, Hoverflies, Isopoda, Ladybirds, Moths, Orthoptera and Vascular plants) was developed. UK species occurrence data were collated from the Biological Records Centre (BRC). The mean ecological status was calculated across all taxonomic groups for the 2000 to 2013 time period, relative to the species richness maximums from the 1970-1990 time period. This version supersedes the dataset 'UK ecological status map'.
- N
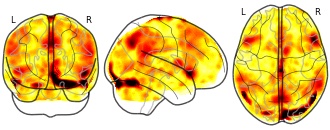
oliver.xie's temporary collection: pmap_L
- neurovault.org
niftiUpdated Aug 21, 2023+ more versionsShareFacebookTwitterEmailClick to copy linkLink copiedCite(2023). oliver.xie's temporary collection: pmap_L [Dataset]. http://identifiers.org/neurovault.image:802572niftiAvailable download formatsUnique identifierhttps://identifiers.org/neurovault.image:802572Dataset updatedAug 21, 2023LicenseCC0 1.0 Universal Public Domain Dedicationhttps://creativecommons.org/publicdomain/zero/1.0/
License information was derived automaticallyDescriptionCollection description
None
Subject species
homo sapiens
Modality
fMRI-BOLD
Cognitive paradigm (task)
rest eyes open
Map type
Z
- u
Oliver Lake, Alberta - Bathymetry (GIS data, line features)
- data.urbandatacentre.ca
- datasets.ai
- +3more
Updated Oct 1, 2024+ more versionsShareFacebookTwitterEmailClick to copy linkLink copiedCite(2024). Oliver Lake, Alberta - Bathymetry (GIS data, line features) [Dataset]. https://data.urbandatacentre.ca/dataset/gov-canada-2383cb23-6795-4f3f-a72e-659c25043319Dataset updatedOct 1, 2024Area coveredAlbertaDescriptionAll available bathymetry and related information for Oliver Lake were collected and hard copy maps digitized where necessary. The data were validated against more recent data (Shuttle Radar Topography Mission 'SRTM' imagery and Indian Remote Sensing 'IRS' imagery) and corrected where necessary. The published data set contains the lake bathymetry formatted as an Arc ascii grid. Bathymetric contours and the boundary polygon are available as shapefiles.
Oliver Trading Llc Company profile with phone,email, buyers, suppliers,...
- volza.com
csvUpdated Jun 27, 2025ShareFacebookTwitterEmailClick to copy linkLink copiedCiteVolza FZ LLC (2025). Oliver Trading Llc Company profile with phone,email, buyers, suppliers, price, export import shipments. [Dataset]. https://www.volza.com/company-profile/oliver-trading-llc-33387766/csvAvailable download formatsDataset updatedJun 27, 2025Dataset provided byVolzaAuthorsVolza FZ LLCLicenseAttribution 4.0 (CC BY 4.0)https://creativecommons.org/licenses/by/4.0/
License information was derived automaticallyTime period covered2014 - Sep 30, 2021Variables measuredCount of exporters, Count of importers, Sum of export value, Sum of import value, Count of export shipments, Count of import shipmentsDescriptionCredit report of Oliver Trading Llc contains unique and detailed export import market intelligence with it's phone, email, Linkedin and details of each import and export shipment like product, quantity, price, buyer, supplier names, country and date of shipment.
WGS mapping results.
- plos.figshare.com
xlsUpdated May 31, 2023ShareFacebookTwitterEmailClick to copy linkLink copiedCiteMaria Doitsidou; Richard J. Poole; Sumeet Sarin; Henry Bigelow; Oliver Hobert (2023). WGS mapping results. [Dataset]. http://doi.org/10.1371/journal.pone.0015435.t002xlsAvailable download formatsUnique identifierhttps://doi.org/10.1371/journal.pone.0015435.t002Dataset updatedMay 31, 2023AuthorsMaria Doitsidou; Richard J. Poole; Sumeet Sarin; Henry Bigelow; Oliver HobertLicenseAttribution 4.0 (CC BY 4.0)https://creativecommons.org/licenses/by/4.0/
License information was derived automaticallyDescriptionWGS mapping results.
Gary Oliver Import Shipments, Overseas Suppliers
- volza.com
csvUpdated May 31, 2025ShareFacebookTwitterEmailClick to copy linkLink copiedCiteVolza FZ LLC (2025). Gary Oliver Import Shipments, Overseas Suppliers [Dataset]. https://www.volza.com/us-importers/gary-oliver-1749254.aspxcsvAvailable download formatsDataset updatedMay 31, 2025Dataset provided byVolzaAuthorsVolza FZ LLCLicenseAttribution 4.0 (CC BY 4.0)https://creativecommons.org/licenses/by/4.0/
License information was derived automaticallyTime period covered2014 - Sep 30, 2021Variables measuredCount of exporters, Count of importers, Sum of export value, Count of import shipmentsDescriptionFind out import shipments and details about Gary Oliver Import Data report along with address, suppliers, products and import shipments.
- a
Oliver Lake, Alberta - Bathymetry, Digital Elevation Model (Arc ASCII grid...
- catalogue.arctic-sdi.org
- datasets.ai
- +4more
Updated Oct 30, 2008ShareFacebookTwitterEmailClick to copy linkLink copiedCite(2008). Oliver Lake, Alberta - Bathymetry, Digital Elevation Model (Arc ASCII grid format) [Dataset]. http://catalogue.arctic-sdi.org/geonetwork/srv/resources/datasets/6d136425-6f4d-4682-9b3b-01c386908583Dataset updatedOct 30, 2008DescriptionAll available bathymetry and related information for Oliver Lake were collected and hard copy maps digitized where necessary. The data were validated against more recent data (Shuttle Radar Topography Mission 'SRTM' imagery and Indian Remote Sensing 'IRS' imagery) and corrected where necessary. The published data set contains the lake bathymetry formatted as an Arc ascii grid. Bathymetric contours and the boundary polygon are available as shapefiles.
- N
zorro's temporary collection: Oliver
- neurovault.org
niftiUpdated Aug 15, 2017+ more versionsShareFacebookTwitterEmailClick to copy linkLink copiedCite(2017). zorro's temporary collection: Oliver [Dataset]. http://identifiers.org/neurovault.image:52647niftiAvailable download formatsUnique identifierhttps://identifiers.org/neurovault.image:52647Dataset updatedAug 15, 2017LicenseCC0 1.0 Universal Public Domain Dedicationhttps://creativecommons.org/publicdomain/zero/1.0/
License information was derived automaticallyDescriptionPositive emotions vs neutral emotions
Collection description
None
Subject species
homo sapiens
Modality
fMRI-BOLD
Cognitive paradigm (task)
Emotion Recognition Task
Map type
T
Data from: Stress Map of Great Britain and Ireland 2022
- dataservices.gfz-potsdam.de
Updated Feb 8, 2022ShareFacebookTwitterEmailClick to copy linkLink copiedCiteAndrew Kingdon; John Williams; Mark Fellgett; Naomi Rettelbach; Oliver Heidbach; Naomi Rettelbach (2022). Stress Map of Great Britain and Ireland 2022 [Dataset]. http://doi.org/10.5880/wsm.greatbritainireland2022Unique identifierhttps://doi.org/10.5880/wsm.greatbritainireland2022Dataset updatedFeb 8, 2022AuthorsAndrew Kingdon; John Williams; Mark Fellgett; Naomi Rettelbach; Oliver Heidbach; Naomi RettelbachLicenseAttribution 4.0 (CC BY 4.0)https://creativecommons.org/licenses/by/4.0/
License information was derived automaticallyArea coveredDescriptionStress maps show the orientation of the current maximum horizontal stress (SHmax) in the earth's crust. Assuming that the vertical stress (SV) is a principal stress, SHmax defines the orientation of the 3D stress tensor; the minimum horizontal stress Shmin is than perpendicular to SHmax. In stress maps SHmax orientations are represented as lines of different lengths. The length of the line is a measure of the quality of data and the symbol shows the stress indicator and the color the stress regime. The stress data are freely available and part of the World Stress Map (WSM) project. For more information about the data and criteria of data analysis and quality mapping are plotted along the WSM website at http://www.world-stress-map.org. The stress map of Great Britain and Ireland 2022 is based on the WSM database release 2016. All data records have been checked and we added a number of new data from earthquake focal mechanisms from the national earthquake catalog and borehole data. The number of data records has increased from n=377 in the WSM 2016 to n=474 in this map. Some locations and assigned quality of WSM 2016 data were corrected due to new information. The digital version of the map is a layered pdf generated with GMT (Wessel et al., 2019) using the topography of Tozer et al. (2019). We also provide on a regular 0.1° grid values of the mean SHmax orientation which have a standard deviation < 25°. The mean SHmax orientation is estimated using the tool stress2grid of Ziegler and Heidbach (2019). For this estimation we used only data records with A-C quality and applied weights according to data quality and distance to the grid points. The stress map is available at the landing page of the GFZ Data Services at http://doi.org/10.5880/WSM.GreatBritainIreland2022 where further information is provided.
ESA WorldCover 10 m 2020 v100
- zenodo.org
- data.niaid.nih.gov
application/gzipUpdated Oct 20, 2021+ more versionsShareFacebookTwitterEmailClick to copy linkLink copiedCiteDaniele Zanaga; Ruben Van De Kerchove; Wanda De Keersmaecker; Niels Souverijns; Carsten Brockmann; Ralf Quast; Jan Wevers; Alex Grosu; Audrey Paccini; Sylvain Vergnaud; Oliver Cartus; Maurizio Santoro; Steffen Fritz; Ivelina Georgieva; Myroslava Lesiv; Sarah Carter; Martin Herold; Linlin Li; Nandin-Erdene Tsendbazar; Fabrizio Ramoino; Olivier Arino; Daniele Zanaga; Ruben Van De Kerchove; Wanda De Keersmaecker; Niels Souverijns; Carsten Brockmann; Ralf Quast; Jan Wevers; Alex Grosu; Audrey Paccini; Sylvain Vergnaud; Oliver Cartus; Maurizio Santoro; Steffen Fritz; Ivelina Georgieva; Myroslava Lesiv; Sarah Carter; Martin Herold; Linlin Li; Nandin-Erdene Tsendbazar; Fabrizio Ramoino; Olivier Arino (2021). ESA WorldCover 10 m 2020 v100 [Dataset]. http://doi.org/10.5281/zenodo.5571936application/gzipAvailable download formatsUnique identifierhttps://doi.org/10.5281/zenodo.5571936Dataset updatedOct 20, 2021AuthorsDaniele Zanaga; Ruben Van De Kerchove; Wanda De Keersmaecker; Niels Souverijns; Carsten Brockmann; Ralf Quast; Jan Wevers; Alex Grosu; Audrey Paccini; Sylvain Vergnaud; Oliver Cartus; Maurizio Santoro; Steffen Fritz; Ivelina Georgieva; Myroslava Lesiv; Sarah Carter; Martin Herold; Linlin Li; Nandin-Erdene Tsendbazar; Fabrizio Ramoino; Olivier Arino; Daniele Zanaga; Ruben Van De Kerchove; Wanda De Keersmaecker; Niels Souverijns; Carsten Brockmann; Ralf Quast; Jan Wevers; Alex Grosu; Audrey Paccini; Sylvain Vergnaud; Oliver Cartus; Maurizio Santoro; Steffen Fritz; Ivelina Georgieva; Myroslava Lesiv; Sarah Carter; Martin Herold; Linlin Li; Nandin-Erdene Tsendbazar; Fabrizio Ramoino; Olivier ArinoLicenseAttribution 4.0 (CC BY 4.0)https://creativecommons.org/licenses/by/4.0/
License information was derived automaticallyDescriptionESA WorldCover 10 m 2020 v100
The European Space Agency (ESA) WorldCover 10 m 2020 product provides a global land cover map for 2020 at 10 m resolution based on Sentinel-1 and Sentinel-2 data. The WorldCover product comes with 11 land cover classes, aligned with UN-FAO's Land Cover Classification System, and has been generated in the framework of the ESA WorldCover project.
The WorldCover product is developed by a consortium lead by VITO Remote Sensing together with partners Brockmann Consult, CS SI, Gamma Remote Sensing AG, IIASA and Wageningen University
Oliver Charles Thomas export shipments to United States
- volza.com
csvUpdated May 30, 2025ShareFacebookTwitterEmailClick to copy linkLink copiedCiteVolza FZ LLC (2025). Oliver Charles Thomas export shipments to United States [Dataset]. https://www.volza.com/exporter-to-us/oliver-charles-thomas-4368524.aspxcsvAvailable download formatsDataset updatedMay 30, 2025Dataset provided byVolzaAuthorsVolza FZ LLCLicenseAttribution 4.0 (CC BY 4.0)https://creativecommons.org/licenses/by/4.0/
License information was derived automaticallyTime period covered2014 - Sep 30, 2021Area coveredUnited StatesVariables measuredCount of exporters, Count of importers, Sum of export value, Count of import shipmentsDescriptionFind out details of Oliver Charles Thomas exporting to United States.Shipments data from Global bill of Lading.
- u
Oliver Lake, Alberta - Boundary (GIS data, polygon features) - Catalogue -...
- data.urbandatacentre.ca
Updated Oct 1, 2024ShareFacebookTwitterEmailClick to copy linkLink copiedCite(2024). Oliver Lake, Alberta - Boundary (GIS data, polygon features) - Catalogue - Canadian Urban Data Catalogue (CUDC) [Dataset]. https://data.urbandatacentre.ca/dataset/ab-gda-dig_2008_0823Dataset updatedOct 1, 2024DescriptionAll available bathymetry and related information for Oliver Lake were collected and hard copy maps digitized where necessary. The data were validated against more recent data (Shuttle Radar Topography Mission 'SRTM' imagery and Indian Remote Sensing 'IRS' imagery) and corrected where necessary. The published data set contains the lake bathymetry formatted as an Arc ascii grid. Bathymetric contours and the boundary polygon are available as shapefiles.
Meier Jens Oliver Company profile with phone,email, buyers, suppliers,...
- volza.com
csvUpdated Jun 27, 2025ShareFacebookTwitterEmailClick to copy linkLink copiedCiteVolza FZ LLC (2025). Meier Jens Oliver Company profile with phone,email, buyers, suppliers, price, export import shipments. [Dataset]. https://www.volza.com/company-profile/meier-jens-oliver-25260678csvAvailable download formatsDataset updatedJun 27, 2025Dataset provided byVolzaAuthorsVolza FZ LLCLicenseAttribution 4.0 (CC BY 4.0)https://creativecommons.org/licenses/by/4.0/
License information was derived automaticallyTime period covered2014 - Sep 30, 2021Variables measuredCount of exporters, Count of importers, Sum of export value, Sum of import value, Count of export shipments, Count of import shipmentsDescriptionCredit report of Meier Jens Oliver contains unique and detailed export import market intelligence with it's phone, email, Linkedin and details of each import and export shipment like product, quantity, price, buyer, supplier names, country and date of shipment.
Oliver Petermann Company profile with phone,email, buyers, suppliers, price,...
- volza.com
csvUpdated May 29, 2025+ more versionsShareFacebookTwitterEmailClick to copy linkLink copiedCiteVolza FZ LLC (2025). Oliver Petermann Company profile with phone,email, buyers, suppliers, price, export import shipments. [Dataset]. https://www.volza.com/company-profile/oliver-petermann-19287078csvAvailable download formatsDataset updatedMay 29, 2025Dataset provided byVolzaAuthorsVolza FZ LLCLicenseAttribution 4.0 (CC BY 4.0)https://creativecommons.org/licenses/by/4.0/
License information was derived automaticallyTime period covered2014 - Sep 30, 2021Variables measuredCount of exporters, Count of importers, Sum of export value, Sum of import value, Count of export shipments, Count of import shipmentsDescriptionCredit report of Oliver Petermann contains unique and detailed export import market intelligence with it's phone, email, Linkedin and details of each import and export shipment like product, quantity, price, buyer, supplier names, country and date of shipment.
- b
Subdivision Ballarat East Oliver and Humffray Streets - Dataset - Ballarat...
- ballaratopendata.org.au
Updated Apr 4, 2022+ more versionsShareFacebookTwitterEmailClick to copy linkLink copiedCite(2022). Subdivision Ballarat East Oliver and Humffray Streets - Dataset - Ballarat Open Data [Dataset]. https://ballaratopendata.org.au/dataset/hul_subdivisionballarateastoliverandhumffraystreets_modifiedDataset updatedApr 4, 2022Area coveredBallarat, Ballarat EastDescription"The map of Allotment 9, Section XII, Oliver & Humffray Streets. This map is georeferenced by CeRDI using a projective transformation ( linear rotation and translation of coordinates: scale 1:25000). More Information: www.access.prov.vic.gov.au, www.landata.vic.gov.au Author: City of Ballarat Owner: Department of Environment, Land, Water & Planning"
- d
Acoustic detections from R/V Song of the Whale during the spring 2019 MAPS...
- seamap.env.duke.edu
- obis.org
- +2more
xmlUpdated Apr 7, 2020ShareFacebookTwitterEmailClick to copy linkLink copiedCiteOliver Boisseau; Oliver Boisseau (2020). Acoustic detections from R/V Song of the Whale during the spring 2019 MAPS survey (NMFS permit 14809) [Dataset]. http://doi.org/10.15468/dw6h7rxmlAvailable download formatsUnique identifierhttps://doi.org/10.15468/dw6h7rDataset updatedApr 7, 2020Dataset provided byOBIS-SEAMAPAuthorsOliver Boisseau; Oliver BoisseauLicenseAttribution-NonCommercial 4.0 (CC BY-NC 4.0)https://creativecommons.org/licenses/by-nc/4.0/
License information was derived automaticallyTime period coveredApr 8, 2019 - May 17, 2019Area coveredDescriptionOriginal provider: Marine Conservation Research
Dataset credits: Oliver Boisseau, Marine Conservation Research International
Abstract: The dataset contains sperm whale acoustic detections made during the MAPS spring cruise in Apr/May 2019 (NMFS permit 14809). Each datapoint represents an acoustic detection of an individual sperm whale.
FacebookTwitterADMMR map collection: Calumet & Arizona Co. Oliver Geologic Map Level 1450 Floor 11; 1 in. to 50 feet; 48 x 34 in.