PCA R code
- figshare.com
txtUpdated May 13, 2022 Share
Share Facebook
 Twitter
 EmailClick to copy linkLink copiedCitePedro López-Gómez (2022). PCA R code [Dataset]. http://doi.org/10.6084/m9.figshare.19761649.v1txtAvailable download formatsUnique identifierhttps://doi.org/10.6084/m9.figshare.19761649.v1Dataset updatedMay 13, 2022AuthorsPedro López-GómezLicense
Attribution 4.0 (CC BY 4.0)https://creativecommons.org/licenses/by/4.0/
License information was derived automaticallyDescriptionR code template utilised for the PCA analysis. It has no anotations. Article: Tryptophan Levels as a Marker of Auxins and Nitric Oxide signaling Authored by: Pedro López-Gómez; Edward Smith; Pedro Bota; Alfonso Cornejo; Marina Urra; Javier Buezo; Jose F. Moran
R Code for PCA Analysis
- figshare.com
txtUpdated Mar 18, 2022ShareFacebookTwitterEmailClick to copy linkLink copiedCiteChristian Eckert; Andrea Polle; Johannes Ballauff (2022). R Code for PCA Analysis [Dataset]. http://doi.org/10.6084/m9.figshare.17031884.v2txtAvailable download formatsUnique identifierhttps://doi.org/10.6084/m9.figshare.17031884.v2Dataset updatedMar 18, 2022AuthorsChristian Eckert; Andrea Polle; Johannes BallauffLicenseAttribution 4.0 (CC BY 4.0)https://creativecommons.org/licenses/by/4.0/
License information was derived automaticallyDescriptionR Code for PCA analysis
- b
Edmunds et al./FACS data for PCA/Exp_56 - Datasets - data.bris
- data.bris.ac.uk
Updated Apr 22, 2023+ more versions Data from: Detecting genomic signatures of natural selection with principal...
- zenodo.org
- explore.openaire.eu
- +1more
zipUpdated May 27, 2022ShareFacebookTwitterEmailClick to copy linkLink copiedCiteNicolas Duforet-Frebourg; Guillaume Laval; Eric Bazin; Michael G.B. Blum; Keurcien Luu; Nicolas Duforet-Frebourg; Guillaume Laval; Eric Bazin; Michael G.B. Blum; Keurcien Luu (2022). Data from: Detecting genomic signatures of natural selection with principal component analysis: application to the 1000 Genomes data [Dataset]. http://doi.org/10.5061/dryad.5s77qzipAvailable download formatsUnique identifierhttps://doi.org/10.5061/dryad.5s77qDataset updatedMay 27, 2022AuthorsNicolas Duforet-Frebourg; Guillaume Laval; Eric Bazin; Michael G.B. Blum; Keurcien Luu; Nicolas Duforet-Frebourg; Guillaume Laval; Eric Bazin; Michael G.B. Blum; Keurcien LuuLicenseCC0 1.0 Universal Public Domain Dedicationhttps://creativecommons.org/publicdomain/zero/1.0/
License information was derived automaticallyDescriptionTo characterize natural selection, various analytical methods for detecting candidate genomic regions have been developed. We propose to perform genome-wide scans of natural selection using principal component analysis (PCA). We show that the common FST index of genetic differentiation between populations can be viewed as the proportion of variance explained by the principal components. Considering the correlations between genetic variants and each principal component provides a conceptual framework to detect genetic variants involved in local adaptation without any prior definition of populations. To validate the PCA-based approach, we consider the 1000 Genomes data (phase 1) considering 850 individuals coming from Africa, Asia, and Europe. The number of genetic variants is of the order of 36 millions obtained with a low-coverage sequencing depth (3×). The correlations between genetic variation and each principal component provide well-known targets for positive selection (EDAR, SLC24A5, SLC45A2, DARC), and also new candidate genes (APPBPP2, TP1A1, RTTN, KCNMA, MYO5C) and noncoding RNAs. In addition to identifying genes involved in biological adaptation, we identify two biological pathways involved in polygenic adaptation that are related to the innate immune system (beta defensins) and to lipid metabolism (fatty acid omega oxidation). An additional analysis of European data shows that a genome scan based on PCA retrieves classical examples of local adaptation even when there are no well-defined populations. PCA-based statistics, implemented in the PCAdapt R package and the PCAdapt fast open-source software, retrieve well-known signals of human adaptation, which is encouraging for future whole-genome sequencing project, especially when defining populations is difficult.
Data from: Biological reserves of the US Federal Protection Network (IUCN...
- agdatacommons.nal.usda.gov
binUpdated Jan 22, 2025ShareFacebookTwitterEmailClick to copy linkLink copiedCiteEnric Batllori; Carol Miller; Marc-André Parisien; Sean A. Parks; Max A. Moritz (2025). Biological reserves of the US Federal Protection Network (IUCN categories I-IV) and PCA loadings used to characterize the climate space of the conterminous United States [Dataset]. http://doi.org/10.2737/RDS-2014-0016binAvailable download formatsUnique identifierhttps://doi.org/10.2737/RDS-2014-0016Dataset updatedJan 22, 2025AuthorsEnric Batllori; Carol Miller; Marc-André Parisien; Sean A. Parks; Max A. MoritzLicenseCC0 1.0 Universal Public Domain Dedicationhttps://creativecommons.org/publicdomain/zero/1.0/
License information was derived automaticallyArea coveredContiguous United States, United StatesDescriptionThis data publication contains a map of biological reserves, in the conterminous United States (US), larger than 500 hectares managed by four US federal agencies: Bureau of Land Management (BLM), Fishand Wildlife Service (FWS), Forest Service (FS), and National Parks Service (NPS). Within such US Federal Protection Network, only federal areas in conservation classifications corresponding to The World Conservation Union categories I to IV (IUCN 1994) are included. These categories include designated, candidate, and officially recommended wilderness areas; forest reserves; natural areas and landmarks; wildlife refuges; cooperative management and protection areas; and national parks, preserves, monuments, and conservation areas. This data publication also includes maps of the loadings of the first three axes of the Principal Component Analysis (PCA) used to characterize the climate space of the conterminous United States of America (CONUS). The PCA was performed using climate variables depicting annual and seasonal trends in temperature, precipitation, moisture index, relative humidity, as well as growing degree days and growing season length.These data were used within a quantitative classification that stratified the climatic variability of the conterminous United States to (a) evaluate the characteristics and rarity of the climate in federally managed areas, (b) determine cases where climate is not well represented by the network of protected federal land (i.e., a climate gap analysis).Original metadata date was 06/24/2014. Minor metadata updates were made on 12/13/2016 and 12/11/2024.
- q
Using PCA to study small mammal biomechanics
- qubeshub.org
Updated May 22, 2025ShareFacebookTwitterEmailClick to copy linkLink copiedCiteAbagael West; Stephanie Smith (2025). Using PCA to study small mammal biomechanics [Dataset]. http://doi.org/10.25334/6KCX-M612Unique identifierhttps://doi.org/10.25334/6KCX-M612Dataset updatedMay 22, 2025Dataset provided byQUBESAuthorsAbagael West; Stephanie SmithDescriptionIn this lesson, students interpret a scatter plot showing the results of a principal components analysis (PCA). They view an interview with Dr. Stephanie Smith, who explains how PCA calculations work, and why she chose to use this analysis to visualize her data. Dr. Smith also discusses her journey becoming a scientist and describes a typical day at work.
- m
Supplementary figures: slices, histograms & PCA
- data.mendeley.com
Updated Aug 12, 2019ShareFacebookTwitterEmailClick to copy linkLink copiedCiteThomas Vandorpe (2019). Supplementary figures: slices, histograms & PCA [Dataset]. http://doi.org/10.17632/3ppn393r6v.1Unique identifierhttps://doi.org/10.17632/3ppn393r6v.1Dataset updatedAug 12, 2019AuthorsThomas VandorpeLicenseAttribution 4.0 (CC BY 4.0)https://creativecommons.org/licenses/by/4.0/
License information was derived automaticallyDescriptionThis dataset comprises example slices, histograms and principal components analyses of all cores analyzed.
- f
pca interaction network (Mycobacterium tuberculosis (strain ATCC 25618 /...
- funcoup.org
Updated May 22, 2025ShareFacebookTwitterEmailClick to copy linkLink copiedCiteFunCoup (2025). pca interaction network (Mycobacterium tuberculosis (strain ATCC 25618 / H37Rv)) [Dataset]. https://funcoup.org/quickSearch/pca%2683332/Dataset updatedMay 22, 2025Dataset authored and provided byFunCoupLicenseAttribution 4.0 (CC BY 4.0)https://creativecommons.org/licenses/by/4.0/
License information was derived automaticallyDescriptionI6YEU0_MYCTU Pyruvate carboxylase
Figure 2. D
- figshare.com
txtUpdated Aug 8, 2020+ more versionsShareFacebookTwitterEmailClick to copy linkLink copiedCiteTakahiro Iwamiya; Bertrand-David Segard (2020). Figure 2. D [Dataset]. http://doi.org/10.6084/m9.figshare.12319316.v1txtAvailable download formatsUnique identifierhttps://doi.org/10.6084/m9.figshare.12319316.v1Dataset updatedAug 8, 2020AuthorsTakahiro Iwamiya; Bertrand-David SegardLicenseAttribution 4.0 (CC BY 4.0)https://creativecommons.org/licenses/by/4.0/
License information was derived automaticallyDescriptionPCA of genes differentially expressed in VCF and VNCF.
Nonrandom missing data can bias PCA inference of population genetic...
- zenodo.org
- datadryad.org
vcfUpdated Jun 3, 2022ShareFacebookTwitterEmailClick to copy linkLink copiedCiteXueling Yi; Xueling Yi; Emily Latch; Emily Latch (2022). Nonrandom missing data can bias PCA inference of population genetic structure [Dataset]. http://doi.org/10.5061/dryad.tqjq2bvwkvcfAvailable download formatsUnique identifierhttps://doi.org/10.5061/dryad.tqjq2bvwkDataset updatedJun 3, 2022AuthorsXueling Yi; Xueling Yi; Emily Latch; Emily LatchLicenseCC0 1.0 Universal Public Domain Dedicationhttps://creativecommons.org/publicdomain/zero/1.0/
License information was derived automaticallyDescriptionPopulation genetic studies in non-model systems increasingly use next-generation sequencing to obtain more loci, but such methods also generate more missing data that may affect downstream analyses. Here we focus on the Principal Component Analysis (PCA) which has been widely used to explore and visualize population structure with mean-imputed missing data. We simulated data of different population models with various total missingness (1%, 10%, 20%) introduced either randomly or biased among individuals or populations. We found that individuals biased with missing data would be dragged away from their real population clusters to the origin of PCA plots, making them indistinguishable from true admixed individuals and potentially leading to misinterpreted population structure. We also generated empirical data of the big brown bat (Eptesicus fuscus) using restriction site-associated DNA sequencing (RADseq). We filtered three data sets with 19.12%, 9.87%, and 1.35% total missingness, all showing nonrandom missing data with biased individuals dragged towards the PCA origin, consistent with results from simulations. We highlight the importance of considering missing data effects on PCA in non-model systems where nonrandom missing data are common due to varying sample quality. To help detect missing data effects, we suggest to 1) plot PCA with a color gradient showing per sample missingness, 2) interpret samples close to the PCA origin with extra caution, 3) explore filtering parameters with and without the missingness-biased samples, and 4) use complementary analyses (e.g., model-based methods) to cross-validate PCA results and help interpret population structure.
Code for PCA
- figshare.com
txtUpdated May 18, 2021ShareFacebookTwitterEmailClick to copy linkLink copiedCiteAndres Aguilar (2021). Code for PCA [Dataset]. http://doi.org/10.6084/m9.figshare.14502243.v1txtAvailable download formatsUnique identifierhttps://doi.org/10.6084/m9.figshare.14502243.v1Dataset updatedMay 18, 2021Dataset provided byfigshareAuthorsAndres AguilarLicenseAttribution 4.0 (CC BY 4.0)https://creativecommons.org/licenses/by/4.0/
License information was derived automaticallyDescriptionCode for PCA
- e
DIA analysis of EPS-urine from PCa and BPH patients
- ebi.ac.uk
- data.niaid.nih.gov
Updated Nov 3, 2023ShareFacebookTwitterEmailClick to copy linkLink copiedCiteLicia Elvira Prestagiacomo (2023). DIA analysis of EPS-urine from PCa and BPH patients [Dataset]. https://www.ebi.ac.uk/pride/archive/projects/PXD035942Dataset updatedNov 3, 2023AuthorsLicia Elvira PrestagiacomoVariables measuredProteomicsDescriptionThe objective of the experiment was to compare the proteome of EPS-urine from PCa and BPH patients.
- e
Pca transcription factor PcaQ
- ebi.ac.uk
Updated Dec 1, 2015+ more versionsShareFacebookTwitterEmailClick to copy linkLink copiedCite(2015). Pca transcription factor PcaQ [Dataset]. https://www.ebi.ac.uk/interpro/entry/IPR012787Dataset updatedDec 1, 2015LicenseAttribution 4.0 (CC BY 4.0)https://creativecommons.org/licenses/by/4.0/
License information was derived automaticallyDescriptionMembers of this family are LysR-family transcription factors associated with operons for catabolism of protocatechuate . Members occur only in proteobacteria.
PCA of Transcriptomic Profiles in Sweet Potato Leaves under Drought Stress
- zenodo.org
zipUpdated Jul 9, 2025ShareFacebookTwitterEmailClick to copy linkLink copiedCiteTao Yin; Tao Yin (2025). PCA of Transcriptomic Profiles in Sweet Potato Leaves under Drought Stress [Dataset]. http://doi.org/10.5281/zenodo.15848699zipAvailable download formatsUnique identifierhttps://doi.org/10.5281/zenodo.15848699Dataset updatedJul 9, 2025AuthorsTao Yin; Tao YinLicenseAttribution 4.0 (CC BY 4.0)https://creativecommons.org/licenses/by/4.0/
License information was derived automaticallyDescriptionSupporting dataset for Figure 1a: Principal Component Analysis (PCA) of transcriptomic profiles in sweet potato leaves under drought stress.
This dataset accompanies the article:
**“Unveiling Stage-Specific Flavonoid Dynamics Underlying Drought Tolerance in Sweet Potato (*Ipomoea batatas* L.) via Integrative Transcriptomic and Metabolomic Analyses”**
Figure 1a illustrates PCA results based on global gene expression patterns from sweet potato leaves sampled under control and drought stress at two developmental stages. The PCA highlights clear clustering between treatment groups, indicating distinct transcriptomic responses.
### This dataset includes:
- Gene expression matrix (Sheet 1 of `PCA_transcriptomics_data.xlsx`)
- Sample group metadata (Sheet 2 of the same file)
- R script used for PCA analysis and figure generation (`PCA_transcriptomics_plot.R`)
- Final PCA figure (`PCA_transcriptomics_plot.pdf`)
- Metadata (`README.md`) and license file (`LICENSE`)This resource enables full reproducibility of Figure 1a and facilitates open reuse in plant drought transcriptomics research.
PCA-Clustering
- kaggle.com
Updated Dec 23, 2024ShareFacebookTwitterEmailClick to copy linkLink copiedCiteMelville Pais (2024). PCA-Clustering [Dataset]. https://www.kaggle.com/datasets/melvillepais/pca-clustering/suggestionsCroissantCroissant is a format for machine-learning datasets. Learn more about this at mlcommons.org/croissant.Dataset updatedDec 23, 2024AuthorsMelville PaisLicensehttps://creativecommons.org/publicdomain/zero/1.0/https://creativecommons.org/publicdomain/zero/1.0/
DescriptionDataset
This dataset was created by Melville Pais
Released under CC0: Public Domain
Contents
- E
PCa mtDNA data
- ega-archive.org
ShareFacebookTwitterEmailClick to copy linkLink copiedCitePCa mtDNA data [Dataset]. https://ega-archive.org/datasets/EGAD00001005945Licensehttps://ega-archive.org/dacs/EGAC00001001463https://ega-archive.org/dacs/EGAC00001001463
Description50 paired benign/cancer samples from prostate tissue generated in 2 different runs - on 3 plates on the IonTorrent Proton. Total of 200 fastq.gz single end runs. Read length ~300 bp. %GC 44 Sequences per file approx 1 Mio.
- N
kittysaw1000's temporary collection: pca 3 again
- neurovault.org
niftiUpdated Apr 5, 2024+ more versionsShareFacebookTwitterEmailClick to copy linkLink copiedCite(2024). kittysaw1000's temporary collection: pca 3 again [Dataset]. http://identifiers.org/neurovault.image:859054niftiAvailable download formatsUnique identifierhttps://identifiers.org/neurovault.image:859054Dataset updatedApr 5, 2024LicenseCC0 1.0 Universal Public Domain Dedicationhttps://creativecommons.org/publicdomain/zero/1.0/
License information was derived automaticallyDescription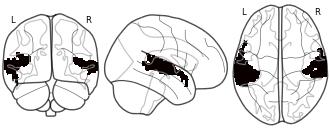
Collection description
None
Subject species
homo sapiens
Modality
fMRI-BOLD
Cognitive paradigm (task)
movie watching task
Map type
Z
- d
Data from: Individual life histories: Neither slow nor fast, just diverse
- search.dataone.org
- dataone.org
- +2more
Updated May 20, 2025ShareFacebookTwitterEmailClick to copy linkLink copiedCiteJoanie Van de Walle; Rémi Fay; Jean-Michel Gaillard; Fanie Pelletier; Sandra Hamel; Marlène Gamelon; Christophe Barbraud; F. Guillaume Blanchet; Daniel T. Blumstein; Anne Charmantier; Karine Delord; Benjamin Larue; Julien Martin; James A. Mills; Emmanuel Milot; Francine M. Mayer; Jay Rotella; Bernt-Erik Saether; Céline Teplitsky; Martijn van de Pol; Marcel E. Visser; Caitlin P. Wells; John Yarrall; Stéphanie Jenouvrier (2025). Individual life histories: Neither slow nor fast, just diverse [Dataset]. http://doi.org/10.5061/dryad.3bk3j9kpmUnique identifierhttps://doi.org/10.5061/dryad.3bk3j9kpmDataset updatedMay 20, 2025Dataset provided byDryad Digital RepositoryAuthorsJoanie Van de Walle; Rémi Fay; Jean-Michel Gaillard; Fanie Pelletier; Sandra Hamel; Marlène Gamelon; Christophe Barbraud; F. Guillaume Blanchet; Daniel T. Blumstein; Anne Charmantier; Karine Delord; Benjamin Larue; Julien Martin; James A. Mills; Emmanuel Milot; Francine M. Mayer; Jay Rotella; Bernt-Erik Saether; Céline Teplitsky; Martijn van de Pol; Marcel E. Visser; Caitlin P. Wells; John Yarrall; Stéphanie JenouvrierTime period coveredJan 1, 2023DescriptionThe slow-fast continuum is known to structure variation in life-history strategies across species. Within populations, it is also assumed to structure individual life histories, yet evidence of its existence remains unclear. We formally assessed the presence of a slow-fast continuum of life histories both within populations and across species using detailed individual-based data for 17 bird and mammal species with contrasting life histories. We estimated adult lifespan, age at first reproduction, breeding frequency and fecundity, and identified the main axes of variation using Principal Component Analyses. The slow-fast continuum was the main axis of life-history variation across species, but within populations individual variation did not follow the slow-fast continuum in any species. This suggests that individual life histories are neither slow nor fast, but rather follow an idiosyncratic pattern across species because of relative differences in the importance of processes such as sto...
Preprocessing-2 of Titanic Dataset
- kaggle.com
Updated Jul 25, 2017ShareFacebookTwitterEmailClick to copy linkLink copiedCiteDylan Amelot (2017). Preprocessing-2 of Titanic Dataset [Dataset]. https://www.kaggle.com/datasets/spektrum/preprocessing2-of-titanic-datasetCroissantCroissant is a format for machine-learning datasets. Learn more about this at mlcommons.org/croissant.Dataset updatedJul 25, 2017AuthorsDylan AmelotLicensehttp://opendatacommons.org/licenses/dbcl/1.0/http://opendatacommons.org/licenses/dbcl/1.0/
DescriptionContent
PCA was performed on Preprocessing-1 of Titanic Dataset and this Dataset correspond to the projection of 8 of the features.
Dataset corresponding Kernel : https://www.kaggle.com/spektrum/intro-pca-kmeans-and-t-sne-on-titanic-dataset
Principal components analyses (PCA) of invertebrate groups inhabiting a...
- doi.pangaea.de
- datadiscoverystudio.org
- +1more
html, tsvUpdated Jun 8, 2007ShareFacebookTwitterEmailClick to copy linkLink copiedCiteMario J Villegas; Jürgen Laudien; Walter Sielfeld; Wolf E Arntz (2007). Principal components analyses (PCA) of invertebrate groups inhabiting a Macrocystis integrifolia bed off Chipana (northern Chile) [Dataset]. http://doi.org/10.1594/PANGAEA.615388tsv, htmlAvailable download formatsUnique identifierhttps://doi.org/10.1594/PANGAEA.615388Dataset updatedJun 8, 2007Dataset provided byPANGAEAAuthorsMario J Villegas; Jürgen Laudien; Walter Sielfeld; Wolf E ArntzTime period coveredOct 15, 2005 - Aug 21, 2006Area coveredVariables measuredSpecies, Factor 1, Factor 2, Factor 3, Factor 4, Factor 5DescriptionThis dataset is about: Principal components analyses (PCA) of invertebrate groups inhabiting a Macrocystis integrifolia bed off Chipana (northern Chile). 180 quadrats
FacebookTwitterAttribution 4.0 (CC BY 4.0)https://creativecommons.org/licenses/by/4.0/
License information was derived automatically
R code template utilised for the PCA analysis. It has no anotations. Article: Tryptophan Levels as a Marker of Auxins and Nitric Oxide signaling Authored by: Pedro López-Gómez; Edward Smith; Pedro Bota; Alfonso Cornejo; Marina Urra; Javier Buezo; Jose F. Moran