- h
oldIT2modIT
- huggingface.co
Updated Jun 3, 2025 Share
Share Facebook
 Twitter
 EmailClick to copy linkLink copiedCiteMassimo Romano (2025). oldIT2modIT [Dataset]. https://huggingface.co/datasets/cybernetic-m/oldIT2modITDataset updatedJun 3, 2025AuthorsMassimo RomanoLicense
MIT Licensehttps://opensource.org/licenses/MIT
License information was derived automaticallyDescriptionDownload the dataset
At the moment to download the dataset you should use Pandas DataFrame: import pandas as pd df = pd.read_csv("https://huggingface.co/datasets/cybernetic-m/oldIT2modIT/resolve/main/oldIT2modIT_dataset.csv")
You can visualize the dataset with: df.head()
To convert into Huggingface dataset: from datasets import Dataset dataset = Dataset.from_pandas(df)
Dataset DescriptionThis is an italian dataset formed by 200 old (ancient) italian sentence and… See the full description on the dataset page: https://huggingface.co/datasets/cybernetic-m/oldIT2modIT.
Klib library python
- kaggle.com
Updated Jan 11, 2021ShareFacebookTwitterEmailClick to copy linkLink copiedCiteSripaad Srinivasan (2021). Klib library python [Dataset]. https://www.kaggle.com/sripaadsrinivasan/klib-library-python/discussionCroissantCroissant is a format for machine-learning datasets. Learn more about this at mlcommons.org/croissant.Dataset updatedJan 11, 2021AuthorsSripaad SrinivasanDescriptionklib library enables us to quickly visualize missing data, perform data cleaning, visualize data distribution plot, visualize correlation plot and visualize categorical column values. klib is a Python library for importing, cleaning, analyzing and preprocessing data. Explanations on key functionalities can be found on Medium / TowardsDataScience in the examples section or on YouTube (Data Professor).
Original Github repo
https://raw.githubusercontent.com/akanz1/klib/main/examples/images/header.png" alt="klib Header">
Usage
!pip install klibimport klib import pandas as pd df = pd.DataFrame(data) # klib.describe functions for visualizing datasets - klib.cat_plot(df) # returns a visualization of the number and frequency of categorical features - klib.corr_mat(df) # returns a color-encoded correlation matrix - klib.corr_plot(df) # returns a color-encoded heatmap, ideal for correlations - klib.dist_plot(df) # returns a distribution plot for every numeric feature - klib.missingval_plot(df) # returns a figure containing information about missing valuesExamples
Take a look at this starter notebook.
Further examples, as well as applications of the functions can be found here.
Contributing
Pull requests and ideas, especially for further functions are welcome. For major changes or feedback, please open an issue first to discuss what you would like to change. Take a look at this Github repo.
License
- N
PD MKDAChi2 Meta Analysis: included : 2024-07-06 21:37:52
- neurovault.org
zipUpdated Jul 6, 2024+ more versionsShareFacebookTwitterEmailClick to copy linkLink copiedCite(2024). PD MKDAChi2 Meta Analysis: included : 2024-07-06 21:37:52 [Dataset]. http://identifiers.org/neurovault.collection:17585zipAvailable download formatsUnique identifierhttps://identifiers.org/neurovault.collection:17585Dataset updatedJul 6, 2024LicenseCC0 1.0 Universal Public Domain Dedicationhttps://creativecommons.org/publicdomain/zero/1.0/
License information was derived automaticallyDescriptionA collection of 13 brain maps. Each brain map is a 3D array of values representing properties of the brain at different locations.
Collection description
MKDAChi2 meta analysis with FDRCorrector
- h
long_dense_structured_table
- huggingface.co
Updated May 9, 2025+ more versionsShareFacebookTwitterEmailClick to copy linkLink copiedCiteNanonets (2025). long_dense_structured_table [Dataset]. https://huggingface.co/datasets/nanonets/long_dense_structured_tableDataset updatedMay 9, 2025Dataset authored and provided byNanonetsLicenseMIT Licensehttps://opensource.org/licenses/MIT
License information was derived automaticallyDescriptionThis dataset is generated syhthetically to create tables with following characteristics:
Empty cell percentage in following range 0,30 There is clear seperator between rows and columns (Structured). 15 <= num rows <= 30, 7 <= num columns <= 15 (Long)
Load the datasetimport io import pandas as pd from PIL import Image
def bytes_to_image(self, image_bytes: bytes): return Image.open(io.BytesIO(image_bytes))
def parse_annotations(self, annotations: str) -> pd.DataFrame:… See the full description on the dataset page: https://huggingface.co/datasets/nanonets/long_dense_structured_table.
- h
pd-extended
- huggingface.co
Updated Jun 8, 2025ShareFacebookTwitterEmailClick to copy linkLink copiedCiteSpawning (2025). pd-extended [Dataset]. https://huggingface.co/datasets/Spawning/pd-extendedDataset updatedJun 8, 2025Dataset authored and provided bySpawningLicensehttps://choosealicense.com/licenses/cdla-permissive-2.0/https://choosealicense.com/licenses/cdla-permissive-2.0/
Descriptionpd-extended
SummaryPD-Extended is a collection of ~34.7 million image/caption pairs derived from the PD12M and Megalith-CC0 datasets. The image/caption pairs are accompanied with metadata, such as mime type and dimensions, as well as the accompanying CLIP-L14 embeddings. Of note, these images retain their original licensing, and the source_id is available to pair any derived image to its source within the original dataset. All images are paired with synthetic captions… See the full description on the dataset page: https://huggingface.co/datasets/Spawning/pd-extended.
- Z
Multimodal Vision-Audio-Language Dataset
- data.niaid.nih.gov
- zenodo.org
Updated Jul 11, 2024ShareFacebookTwitterEmailClick to copy linkLink copiedCiteChoksi, Bhavin (2024). Multimodal Vision-Audio-Language Dataset [Dataset]. https://data.niaid.nih.gov/resources?id=zenodo_10060784Dataset updatedJul 11, 2024Dataset provided byChoksi, Bhavin
Schaumlöffel, Timothy
Roig, GemmaLicenseAttribution 4.0 (CC BY 4.0)https://creativecommons.org/licenses/by/4.0/
License information was derived automaticallyDescriptionThe Multimodal Vision-Audio-Language Dataset is a large-scale dataset for multimodal learning. It contains 2M video clips with corresponding audio and a textual description of the visual and auditory content. The dataset is an ensemble of existing datasets and fills the gap of missing modalities. Details can be found in the attached report. Annotation The annotation files are provided as Parquet files. They can be read using Python and the pandas and pyarrow library. The split into train, validation and test set follows the split of the original datasets. Installation
pip install pandas pyarrow Example
import pandas as pddf = pd.read_parquet('annotation_train.parquet', engine='pyarrow')print(df.iloc[0])
dataset AudioSet filename train/---2_BBVHAA.mp3 captions_visual [a man in a black hat and glasses.] captions_auditory [a man speaks and dishes clank.] tags [Speech] Description The annotation file consists of the following fields:filename: Name of the corresponding file (video or audio file)dataset: Source dataset associated with the data pointcaptions_visual: A list of captions related to the visual content of the video. Can be NaN in case of no visual contentcaptions_auditory: A list of captions related to the auditory content of the videotags: A list of tags, classifying the sound of a file. It can be NaN if no tags are provided Data files The raw data files for most datasets are not released due to licensing issues. They must be downloaded from the source. However, due to missing files, we provide them on request. Please contact us at schaumloeffel@em.uni-frankfurt.de
- h
descriptor_prediction
- huggingface.co
Updated Jul 27, 2025ShareFacebookTwitterEmailClick to copy linkLink copiedCiteYuanhao Qu (2025). descriptor_prediction [Dataset]. https://huggingface.co/datasets/yhqu/descriptor_predictionDataset updatedJul 27, 2025AuthorsYuanhao QuDescriptionDescriptor Prediction Dataset
This dataset is part of the Deep Principle Bench collection.
Filesdescriptor_prediction.csv: Main dataset file
Usageimport pandas as pd from datasets import load_dataset
Load the dataset
dataset = load_dataset("yhqu/descriptor_prediction")
Or load directly as pandas DataFrame
df = pd.read_csv("hf://datasets/yhqu/descriptor_prediction/descriptor_prediction.csv")
CitationPlease cite this work if you use… See the full description on the dataset page: https://huggingface.co/datasets/yhqu/descriptor_prediction.
- N
PD MKDAChi2 Meta Analysis: included : 2024-07-06 21:37:52:...
- neurovault.org
niftiUpdated Jul 6, 2024+ more versionsShareFacebookTwitterEmailClick to copy linkLink copiedCite(2024). PD MKDAChi2 Meta Analysis: included : 2024-07-06 21:37:52: prob_desc-A.nii.gz [Dataset]. http://identifiers.org/neurovault.image:887023niftiAvailable download formatsUnique identifierhttps://identifiers.org/neurovault.image:887023Dataset updatedJul 6, 2024LicenseCC0 1.0 Universal Public Domain Dedicationhttps://creativecommons.org/publicdomain/zero/1.0/
License information was derived automaticallyDescription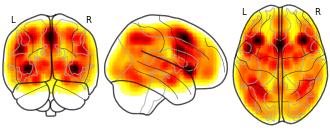
Collection description
MKDAChi2 meta analysis with FDRCorrector
Subject species
homo sapiens
Modality
Other
Analysis level
meta-analysis
Map type
P
- f
Data from: Structural Impact of Platinum on the Incommensurably Modulated...
- figshare.com
txtUpdated Jun 1, 2023ShareFacebookTwitterEmailClick to copy linkLink copiedCitePartha P. Jana; Sven Lidin (2023). Structural Impact of Platinum on the Incommensurably Modulated γ‑Brass Related Composite Structure Pd15Zn54 [Dataset]. http://doi.org/10.1021/ic301326p.s001txtAvailable download formatsUnique identifierhttps://doi.org/10.1021/ic301326p.s001Dataset updatedJun 1, 2023Dataset provided byACS PublicationsAuthorsPartha P. Jana; Sven LidinLicenseAttribution-NonCommercial 4.0 (CC BY-NC 4.0)https://creativecommons.org/licenses/by-nc/4.0/
License information was derived automaticallyDescriptionThe crystal structure of three incommensurately modulated γ-brass related composite structures in the Pd–Zn–Pt system has been solved from X-ray single crystal diffraction data using a 3 + 1-dimensional super space description. The compounds PtxPd15–xZn54 (x ≈ 6, 7, 10) crystallize in orthorhombic superspace group Fmmm(α00)0s0 (F = [(1/2, 1/2, 0, 0); (1/2, 0, 1/2, 0); (0, 1/2, 1/2, 0)] with the following fundamental cell dimensions: a = 4.265(1) Å, b = 9.132(1) Å, c = 12.928(2) Å, q ≈ 0.629a*; a = 4.284(1) Å, b = 9.151(2) Å, c = 12.948(4) Å, q ≈ 0.628a*; and a = 4.288(1) Å, b = 9.140(4) Å, c = 12.926(7) Å, q ≈ 0.627a*. Each structure is built by two sub-latticespentagonal antiprismatic columns parallel to [100] and a zigzag chain of Zn atoms running along the center of the column.
- f
Data from: Pd(II)-Mediated Alkynediol Spiroketalization: First Total...
- figshare.com
txtUpdated Jun 3, 2023ShareFacebookTwitterEmailClick to copy linkLink copiedCiteC. V. Ramana; Sharad B. Suryawanshi; Rajesh G. Gonnade (2023). Pd(II)-Mediated Alkynediol Spiroketalization: First Total Synthesis of (−)-Cephalosporolide E and (+)-Cephalosporolide F [Dataset]. http://doi.org/10.1021/jo802539z.s001txtAvailable download formatsUnique identifierhttps://doi.org/10.1021/jo802539z.s001Dataset updatedJun 3, 2023Dataset provided byACS PublicationsAuthorsC. V. Ramana; Sharad B. Suryawanshi; Rajesh G. GonnadeLicenseAttribution-NonCommercial 4.0 (CC BY-NC 4.0)https://creativecommons.org/licenses/by-nc/4.0/
License information was derived automaticallyDescriptionHerein we describe a concise assembly of the central 1,6-dioxaspiro[4.4]nonane core of cephalosporolides E/F by employing a Pd-mediated alkynediol cycloisomerization and their total synthesis. On the basis of spectroscopic data and optical rotation values, the absolute configurations of cephalosporolides E/F were proposed.

Not seeing a result you expected?
Learn how you can add new datasets to our index.
FacebookTwitterMIT Licensehttps://opensource.org/licenses/MIT
License information was derived automatically
Download the dataset
At the moment to download the dataset you should use Pandas DataFrame: import pandas as pd df = pd.read_csv("https://huggingface.co/datasets/cybernetic-m/oldIT2modIT/resolve/main/oldIT2modIT_dataset.csv")
You can visualize the dataset with: df.head()
To convert into Huggingface dataset: from datasets import Dataset dataset = Dataset.from_pandas(df)
Dataset Description
This is an italian dataset formed by 200 old (ancient) italian sentence and… See the full description on the dataset page: https://huggingface.co/datasets/cybernetic-m/oldIT2modIT.