Voting intention in the United Kingdom 2025, by age
- statista.com
Updated Jul 8, 2025 Share
Share Facebook
 Twitter
 EmailClick to copy linkLink copiedCiteStatista (2025). Voting intention in the United Kingdom 2025, by age [Dataset]. https://www.statista.com/statistics/1379439/uk-election-polls-by-age/Dataset updatedJul 8, 2025Time period coveredJul 6, 2025 - Jul 7, 2025Area coveredUnited KingdomDescription
As of July 2025, the political party that 18 to 24 year-old's in Great Britain would be most likely to vote for was the Labour Party, at 33 percent, with Labour also the most popular party among those aged 25 to 49. Reform UK was the most popular party for the 50 to 64 age group, with 29 percent of voters saying they would vote for them. For the oldest age group, the Reform was also the most popular, with 35 percent of over 65s intending to vote for them. Reform surge in the polls Since winning the last UK general election in July 2024, the ruling Labour Party have steadily become more unpopular among voters. After winning 33.7 percent of the vote in that election, the party was polling at 24 percent in April 2025, only slightly ahead of Reform UK on 23 percent. A right-wing populist party, Reform benefited from the collapse in support for the center-right Conservative Party in the last election, winning several seats at their expense. While the next UK general election is not due to be held until 2029, the government will be keen to address their collapsing approval ratings, in the face of Reform's rising support. Economic headaches for Labour in 2025 Although Labour inherited a growing economy, with falling inflation, and low unemployment from the Conservatives, the overall economic outlook for the UK is still quite gloomy. The country's government debt is around 100 percent of GDP, and without large tax rises and spending cuts, the government hopes to create a stronger, more resilient economy to reduce the deficit. While this is still a possibility, the UK's economic prospects for 2025 were recently slashed, with growth of one percent forecast, down from an earlier prediction of two percent. Although mainly due to external factors such as the threat of increasing tariffs, and general geopolitical instability, the UK's faltering economy will add further problems to the embattled government.
UK Parliamentary Constituency boundaries for the island of Ireland,...
- zenodo.org
binUpdated Oct 25, 2024ShareFacebookTwitterEmailClick to copy linkLink copiedCiteCharlton Martin; Charlton Martin; Eoin McLaughlin; Eoin McLaughlin; Jack Kavanagh; Jack Kavanagh (2024). UK Parliamentary Constituency boundaries for the island of Ireland, 1885-1918 [Dataset]. http://doi.org/10.5281/zenodo.13993331binAvailable download formatsUnique identifierhttps://doi.org/10.5281/zenodo.13993331Dataset updatedOct 25, 2024AuthorsCharlton Martin; Charlton Martin; Eoin McLaughlin; Eoin McLaughlin; Jack Kavanagh; Jack KavanaghLicenseAttribution 4.0 (CC BY 4.0)https://creativecommons.org/licenses/by/4.0/
License information was derived automaticallyTime period covered2017Area coveredIreland, United KingdomDescriptionThe 1885 UK parliamentary constituencies for Ireland were re-created in 2017 as part of a conference paper delivered at the Southern Irish Loyalism in Context conference at Maynooth University. The intial map only included the territory of the Irish Free State and was created by Martin Charlton and Jack Kavanagh. The remaining six counties of Ulster were completed by Eoin McLaughlin in 2018-19, the combined result is a GIS map of all the parliamentary constituecies across the island of Ireland for the period 1885-1918. The map is available in both ESRI Shapefile format and as a GeoPackage (GPKG). The methodology for creating the constituencies is outlined in detail below.
Methodology
A map showing the outlines of the 1855 – 1918 Constituency boundaries can be found on page 401 of Parliamentary Elections in Ireland, 1801-1922 (Dublin, 1978) by Brian Walker. This forms the basis for the creation of a set of digital boundaries which can then be used in a GIS. The general workflow involves allocating an 1885 Constituency identifier to each of the 309 Electoral Divisions present in the boundaries made available for the 2011 Census of Population data release by CSO. The ED boundaries are available in ‘shapefile’ format (a de facto standard for spatial data transfer). Once a Constituency identifier has been given to each ED, the GIS operation known as ‘dissolve’ is used to remove the boundaries between EDs in the same Constituency. To begin with Walker’s map was scanned at 1200 dots per inch in JPEG form. A scanned map cannot be linked to other spatial data without undergoing a process known as georeferencing. The CSO boundaries are available with spatial coordinates in the Irish National Grid system. The goal of georeferencing is to produce a rectified version of the map together with a world file. Rectification refers to the process of recomputing the pixel positions in the scanned map so that they are oriented with the ING coordinate system; the world file contains the extent in both the east-west and north-south directions of each pixel (in metres) and the coordinates of the most north-westerly pixel in the rectified image.
Georeferencing involves the identification of Ground Control Points – these are locations on the scanned map for which the spatial coordinates in ING are known. The Georeferencing option in ArcGIS 10.4 makes this a reasonably pain free task. For this map 36 GCPs were required for a local spline transformation. The Redistribution of Seats Act 1885 provides the legal basis for the constituencies to be used for future elections in England, Wales, Scotland and Ireland. Part III of the Seventh Schedule of the Act defines the Constituencies in terms of Baronies, Parishes (and part Parishes) and Townlands for Ireland. Part III of the Sixth Schedule provides definitions for the Boroughs of Belfast and Dublin.
The CSO boundary collection also includes a shapefile of Barony boundaries. This makes it possible code a barony in two ways: (i) allocated completely to a Division or (ii) split between two Divisions. For the first type, the code is just the division name, and for the second the code includes both (or more) division names. Allocation of these names to the data in the ED shapefile is accomplished by a spatial join operation. Recoding the areas in the split Baronies is done interactively using the GIS software’s editing option. EDs or groups of EDs can be selected on the screen, and the correct Division code updated in the attribute table. There are a handful of cases where an ED is split between divisions, so a simple ‘majority’ rule was used for the allocation. As the maps are to be used at mainly for displaying data at the national level, a misallocation is unlikely to be noticed. The final set of boundaries was created using the dissolve operation mentioned earlier. There were a dozen ED that had initially escaped being allocated a code, but these were quickly updated. Similarly, a few of the EDs in the split divisions had been overlooked; again updating was painless. This meant that the dissolve had to be run a few more times before all the errors have been corrected.
For the Northern Ireland districts, a slightly different methodology was deployed which involved linking parishes and townlands along side baronies, using open data sources from the OSM Townlands.ie project and OpenData NI.
- s
Counties and Unitary Authorities (April 2023) Map in the UK
- geoportal.statistics.gov.uk
- hub.arcgis.com
Updated May 31, 2023+ more versionsShareFacebookTwitterEmailClick to copy linkLink copiedCiteOffice for National Statistics (2023). Counties and Unitary Authorities (April 2023) Map in the UK [Dataset]. https://geoportal.statistics.gov.uk/documents/1aa806eb35ee4334a87f5970c82e3ac0Dataset updatedMay 31, 2023Dataset authored and provided byOffice for National StatisticsLicensehttps://www.ons.gov.uk/methodology/geography/licenceshttps://www.ons.gov.uk/methodology/geography/licences
Area coveredDescriptionA PDF map that shows the counties and unitary authorities in the United Kingdom as at 1 April 2023. (File Size - 583 KB)
- E
Popple, Henry 1733. A Map of the British Empire in America (Sheet 18)
- ecaidata.org
Updated Oct 4, 2014ShareFacebookTwitterEmailClick to copy linkLink copiedCiteECAI Clearinghouse (2014). Popple, Henry 1733. A Map of the British Empire in America (Sheet 18) [Dataset]. https://ecaidata.org/dataset/ecaiclearinghouse-id-436Dataset updatedOct 4, 2014Dataset provided byECAI ClearinghouseDescriptionHistorical Map of South / Central America from the David Rumsey Historical Map Collection
- e
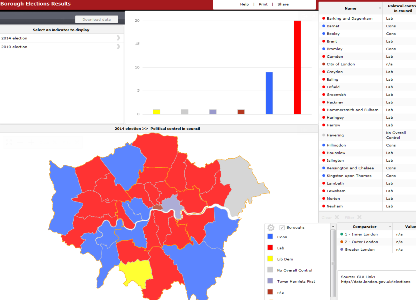
Borough Council Election Results 2014
- data.europa.eu
excel xls, pdfUpdated Dec 1, 2014+ more versionsShareFacebookTwitterEmailClick to copy linkLink copiedCiteGreater London Authority (2014). Borough Council Election Results 2014 [Dataset]. https://data.europa.eu/data/datasets/borough-council-election-results-2014excel xls, pdfAvailable download formatsDataset updatedDec 1, 2014Dataset authored and provided byGreater London AuthorityDescription
This report includes a great deal of detail on every aspect of the 2014 London Borough council general elections. No other single volume presents the full results and election statistics from the 32 London boroughs enabling the reader to analyse and compare the results across London in one place. The report presents data for every candidate in every ward (excluding the City of London which operates on a different electoral model). The report also contains analysis of the European election results for London that took place on the same day.
Printed Copies We are able to accept orders for hard copies £30. Click here for further details.
Details of all previous elections reports in the series can be found here.
Summary results of the 2014 local elections in London, showing number and percentage of seats won, turnout and political control.
Final 2014 ward results
These results show the number of votes for each candidate in each ward in London. Turnout, number of ballots, postal votes, and breakdown of rejected votes, Mayoral and European voting figures are also included where available.
Map showing political control in each ward.
https://londondatastore-upload.s3.amazonaws.com/images/London-ward-map-borough-election-2014-new-colours-small.png" alt="">
Also, using these ward results, Oliver O'Brien from CASA has created some eye catching interactive ward maps.
The borough map shows the summary results in both the 2010 and 2014 elections.
The ward interactive map shows the detailed results for each candidate at ward level for the last three elections between 2006 and 2014.

This motion chart shows the relationship, between share of votes and seats won by the major parties in elections since 1964 at borough level (requires Adobe Flash Player).
 )
) - G
Political stability by country, around the world | TheGlobalEconomy.com
- theglobaleconomy.com
csv, excel, xmlUpdated Apr 7, 2016+ more versionsShareFacebookTwitterEmailClick to copy linkLink copiedCiteGlobalen LLC (2016). Political stability by country, around the world | TheGlobalEconomy.com [Dataset]. www.theglobaleconomy.com/rankings/wb_political_stability/xml, excel, csvAvailable download formatsDataset updatedApr 7, 2016Dataset authored and provided byGlobalen LLCLicenseAttribution 4.0 (CC BY 4.0)https://creativecommons.org/licenses/by/4.0/
License information was derived automaticallyTime period coveredDec 31, 1996 - Dec 31, 2023Area coveredWorld, WorldDescriptionThe average for 2023 based on 193 countries was -0.07 points. The highest value was in Liechtenstein: 1.61 points and the lowest value was in Syria: -2.75 points. The indicator is available from 1996 to 2023. Below is a chart for all countries where data are available.
Mapping income deprivation at a local authority level: 2019
- gov.uk
- s3.amazonaws.com
Updated May 24, 2021ShareFacebookTwitterEmailClick to copy linkLink copiedCiteOffice for National Statistics (2021). Mapping income deprivation at a local authority level: 2019 [Dataset]. https://www.gov.uk/government/statistics/mapping-income-deprivation-at-a-local-authority-level-2019Dataset updatedMay 24, 2021AuthorsOffice for National StatisticsDescriptionOfficial statistics are produced impartially and free from political influence.
- o
Geographical, historical, political, philosophical and mechanical essays....
- llds.ling-phil.ox.ac.uk
Updated Aug 19, 2023ShareFacebookTwitterEmailClick to copy linkLink copiedCiteLewis Evans; Lewis Evans; James Turner; Lewis Evans (2023). Geographical, historical, political, philosophical and mechanical essays. The first, containing an analysis of a general map of the middle British colonies in America; and of the country of the confederate Indians: a description of the face of the country; the boundaries of the confederates; and the maritime and inland navigations of the several rivers and lakes contained therein. / By Lewis Evans. [Dataset]. https://llds.ling-phil.ox.ac.uk/llds/xmlui/handle/20.500.14106/N05835?show=fullDataset updatedAug 19, 2023AuthorsLewis Evans; Lewis Evans; James Turner; Lewis EvansLicenseCC0 1.0 Universal Public Domain Dedicationhttps://creativecommons.org/publicdomain/zero/1.0/
License information was derived automaticallyArea coveredUnited States, Confederate States of AmericaDescription(:unav)...........................................
- E
Data from: Scottish Independence Referendum 2014
- find.data.gov.scot
- dtechtive.com
xml, zipUpdated Feb 22, 2017ShareFacebookTwitterEmailClick to copy linkLink copiedCiteUniversity of Edinburgh (2017). Scottish Independence Referendum 2014 [Dataset]. http://doi.org/10.7488/ds/1964zip(7.987 MB), xml(0.0041 MB)Available download formatsUnique identifierhttps://doi.org/10.7488/ds/1964Dataset updatedFeb 22, 2017Dataset provided byUniversity of EdinburghArea coveredScotlandDescriptionthis dataset shows the results of the 2014 referendum on Scottish Independence which took place on the 18th September 2014. The data is broken down into the geographical areas such as Edinburgh, Midlothian, Fife and the Highlands. The data shows the number of Yes/No votes, the percentage and the difference between the two (positive depicts a No win). It is interesting to note that anyone over the age of 16 was eligible to vote, a change to the normal over 18 policy in general elections. Turnout was high with 84.6% of those eligible voting. The data was sourced from: http://www.cityam.com/1411046935/who-won-where-how-scottish-councils-voted-independence-referendum-results-map and then combined with Boundary Data from the OS Opendata that provided the geographical boundaries. Another good source of info and maps is http://www.bbc.co.uk/news/uk-scotland-scotland-politics-29255449. GIS vector data. This dataset was first accessioned in the EDINA ShareGeo Open repository on 2014-09-24 and migrated to Edinburgh DataShare on 2017-02-22.
Discourses of Globalisation and European Integration in the United Kingdom...
- beta.ukdataservice.ac.uk
Updated 2006ShareFacebookTwitterEmailClick to copy linkLink copiedCiteN. Smith (2006). Discourses of Globalisation and European Integration in the United Kingdom and Ireland, 2004-2005 [Dataset]. http://doi.org/10.5255/ukda-sn-5370-1Unique identifierhttps://doi.org/10.5255/ukda-sn-5370-1Dataset updated2006AuthorsN. SmithArea coveredIreland, United KingdomDescriptionThe principal objective of the research was to survey and map elite political attitudes to globalisation, European integration and the relationship between the two. Explicitly designed as a pilot study for a broader multi-country and multi-language European comparative analysis, the focus of the project was restricted to the United Kingdom (UK) and Ireland, two countries that are particularly well suited to a comparative analysis of this kind due to their common language, their common institutional origins and the structural similarities in their political economies.
The research was informed by the following key questions:- how policy-makers perceive globalisation and European integration (including the relationship between them)
- whether distinctive discourses of globalisation, European integration and the relationship between the two can be identified, how pervasive the concepts are, and to what extent they are conserved between cases and, within cases, between political parties, civil servants and politicians, and front- and back-benchers
- whether such discourses are national in character or are party-political factors the principal determinants of attitudes towards globalisation and European integration
- whether there are disparities between policy-makers' attitudes towards globalisation and European integration, as revealed in survey-based research and the official/public appeal to such discourses
- C
Baldwin Borough Municipal Boundary
- data.wprdc.org
- datadiscoverystudio.org
- +2more
zipUpdated May 21, 2023ShareFacebookTwitterEmailClick to copy linkLink copiedCiteBaldwin Borough Municipal Boundary [Dataset]. https://data.wprdc.org/dataset/borough-boundaryzipAvailable download formatsDataset updatedMay 21, 2023Dataset provided byBaldwin BoroughLicenseOpen Data Commons Attribution License (ODC-By) v1.0https://www.opendatacommons.org/licenses/by/1.0/
License information was derived automaticallyArea coveredBaldwinDescriptionMap of Baldwin Borough's political subdivision boundry

Not seeing a result you expected?
Learn how you can add new datasets to our index.
FacebookTwitterAs of July 2025, the political party that 18 to 24 year-old's in Great Britain would be most likely to vote for was the Labour Party, at 33 percent, with Labour also the most popular party among those aged 25 to 49. Reform UK was the most popular party for the 50 to 64 age group, with 29 percent of voters saying they would vote for them. For the oldest age group, the Reform was also the most popular, with 35 percent of over 65s intending to vote for them. Reform surge in the polls Since winning the last UK general election in July 2024, the ruling Labour Party have steadily become more unpopular among voters. After winning 33.7 percent of the vote in that election, the party was polling at 24 percent in April 2025, only slightly ahead of Reform UK on 23 percent. A right-wing populist party, Reform benefited from the collapse in support for the center-right Conservative Party in the last election, winning several seats at their expense. While the next UK general election is not due to be held until 2029, the government will be keen to address their collapsing approval ratings, in the face of Reform's rising support. Economic headaches for Labour in 2025 Although Labour inherited a growing economy, with falling inflation, and low unemployment from the Conservatives, the overall economic outlook for the UK is still quite gloomy. The country's government debt is around 100 percent of GDP, and without large tax rises and spending cuts, the government hopes to create a stronger, more resilient economy to reduce the deficit. While this is still a possibility, the UK's economic prospects for 2025 were recently slashed, with growth of one percent forecast, down from an earlier prediction of two percent. Although mainly due to external factors such as the threat of increasing tariffs, and general geopolitical instability, the UK's faltering economy will add further problems to the embattled government.