- B
Belgium PPI: Manufacturing of Transport Means
- ceicdata.com
+ more versions Share
Share Facebook
 Twitter
 EmailClick to copy linkLink copiedCiteCEICdata.com, Belgium PPI: Manufacturing of Transport Means [Dataset]. https://www.ceicdata.com/en/belgium/producer-price-index-2000100/ppi-manufacturing-of-transport-meansDataset provided byCEICdata.comLicense
Attribution 4.0 (CC BY 4.0)https://creativecommons.org/licenses/by/4.0/
License information was derived automaticallyTime period coveredJan 1, 2009 - Dec 1, 2009Area coveredBelgiumVariables measuredProducer PricesDescriptionBelgium PPI: Manufacturing of Transport Means data was reported at 103.500 2000=100 in Dec 2009. This records a decrease from the previous number of 104.600 2000=100 for Nov 2009. Belgium PPI: Manufacturing of Transport Means data is updated monthly, averaging 100.600 2000=100 from Jan 2001 (Median) to Dec 2009, with 108 observations. The data reached an all-time high of 104.700 2000=100 in Nov 2008 and a record low of 98.400 2000=100 in Jul 2003. Belgium PPI: Manufacturing of Transport Means data remains active status in CEIC and is reported by National Bank of Belgium. The data is categorized under Global Database’s Belgium – Table BE.I023: Producer Price Index: 2000=100.
Petroleum and gas extraction PPI per month in China 2023-2025
- statista.com
Updated Jul 17, 2025ShareFacebookTwitterEmailClick to copy linkLink copiedCiteStatista (2025). Petroleum and gas extraction PPI per month in China 2023-2025 [Dataset]. https://www.statista.com/statistics/1281570/monthly-ppi-petroleum-and-gas-extraction-china/Dataset updatedJul 17, 2025Time period coveredJun 2023 - Jun 2025Area coveredChinaDescriptionIn June 2025, the producer price index (PPI) for the petroleum extraction industry stood at 82.5 index points, meaning prices had decreased compared to the same month last year. The PPI for petroleum extraction has been especially volatile throughout most of 2023 and 2024. By comparison, the PPI for natural gas has been relatively stable, with the largest increase noted for July 2022, when the PPI amounted to 107.4 index points.
Belgium PPI: ND: Manufacturing of Transport Means
- dr.ceicdata.com
- ceicdata.com
Updated Apr 15, 2023+ more versionsShareFacebookTwitterEmailClick to copy linkLink copiedCiteCEICdata.com (2023). Belgium PPI: ND: Manufacturing of Transport Means [Dataset]. https://www.dr.ceicdata.com/en/belgium/producer-price-index-2000100-non-domestic-market/ppi-nd-manufacturing-of-transport-meansDataset updatedApr 15, 2023Dataset provided byCEIC DataLicenseAttribution 4.0 (CC BY 4.0)https://creativecommons.org/licenses/by/4.0/
License information was derived automaticallyTime period coveredJan 1, 2009 - Dec 1, 2009Area coveredBelgiumVariables measuredProducer PricesDescriptionBelgium PPI: ND: Manufacturing of Transport Means data was reported at 106.600 2000=100 in Dec 2009. This records a decrease from the previous number of 108.000 2000=100 for Nov 2009. Belgium PPI: ND: Manufacturing of Transport Means data is updated monthly, averaging 102.000 2000=100 from Jan 2001 (Median) to Dec 2009, with 108 observations. The data reached an all-time high of 108.000 2000=100 in Nov 2009 and a record low of 99.000 2000=100 in Jan 2002. Belgium PPI: ND: Manufacturing of Transport Means data remains active status in CEIC and is reported by National Bank of Belgium. The data is categorized under Global Database’s Belgium – Table BE.I025: Producer Price Index: 2000=100: Non Domestic Market.
- f
Coevolution between PPI partners detected using correlated changes in...
- plos.figshare.com
xlsUpdated Jun 2, 2023ShareFacebookTwitterEmailClick to copy linkLink copiedCiteÅsa Pérez-Bercoff; Corey M. Hudson; Gavin C. Conant (2023). Coevolution between PPI partners detected using correlated changes in selective constraint. [Dataset]. http://doi.org/10.1371/journal.pone.0052581.t001xlsAvailable download formatsUnique identifierhttps://doi.org/10.1371/journal.pone.0052581.t001Dataset updatedJun 2, 2023Dataset provided byPLOS ONEAuthorsÅsa Pérez-Bercoff; Corey M. Hudson; Gavin C. ConantLicenseAttribution 4.0 (CC BY 4.0)https://creativecommons.org/licenses/by/4.0/
License information was derived automaticallyDescriptionaValues of branch-wise selective constraint (ω) allowed in the computation of Spearman’s correlation between these ω values between paired branches for two proteins with a known PPI in humans (Methods).bValues of ω from the indicated clades were removed before the calculation of the Spearman’s correlation.cWe required at least 6 common branches between the two orthologous genes trees for the two interacting proteins: the column indicates the number of PPIs meeting this requirement.dP-value of the hypothesis test that the real PPI pairs had a higher mean Spearman’s correlation than would be expected, given the distribution of correlations seen from 1000 simulations of the same number of pseudo-PPI pairs drawn from non-interacting proteins (Methods).eMean of the mean correlation seen from 1000 simulations, each consisting of the same number of pseudo-PPIs from c.
Petroleum products manufacturing PPI per month in China 2023-2025
- statista.com
Updated Jul 17, 2025ShareFacebookTwitterEmailClick to copy linkLink copiedCiteStatista (2025). Petroleum products manufacturing PPI per month in China 2023-2025 [Dataset]. https://www.statista.com/statistics/1310400/monthly-ppi-petroleum-products-manufacturing-china/Dataset updatedJul 17, 2025Time period coveredJun 2023 - Jun 2025Area coveredChinaDescriptionThe producer price index (PPI) for refined petroleum products manufacturing in China stood at 89.6 index points in June 2025. This means prices had decreased by 10.4 percent compared to the same month last year. The PPI has dropped in the second half of 2024. This was also true for the PPI for petroleum and gas extraction in China.
- F
Producer Price Index by Commodity: All Commodities
- fred.stlouisfed.org
jsonUpdated Jul 16, 2025+ more versionsShareFacebookTwitterEmailClick to copy linkLink copiedCite(2025). Producer Price Index by Commodity: All Commodities [Dataset]. https://fred.stlouisfed.org/series/PPIACOjsonAvailable download formatsDataset updatedJul 16, 2025Licensehttps://fred.stlouisfed.org/legal/#copyright-public-domainhttps://fred.stlouisfed.org/legal/#copyright-public-domain
DescriptionGraph and download economic data for Producer Price Index by Commodity: All Commodities (PPIACO) from Jan 1913 to Jun 2025 about commodities, PPI, inflation, price index, indexes, price, and USA.
- e
Simple download service (Atom) of the dataset: Gathering points for those...
- data.europa.eu
unknownUpdated Feb 19, 2022+ more versionsShareFacebookTwitterEmailClick to copy linkLink copiedCite(2022). Simple download service (Atom) of the dataset: Gathering points for those involved defined in the framework of the implementation of a Special Intervention Plan (PPI) in Seine-et-Marne [Dataset]. https://data.europa.eu/data/datasets/fr-120066022-srv-5ae6550f-a6fc-47e4-ad32-91d7bd7de318?locale=enunknownAvailable download formatsDataset updatedFeb 19, 2022DescriptionThe Special Intervention Plan (PPI) is a local mechanism defined in France to protect people, property and the environment, to deal with the particular risks associated with the existence of one or more industrial installations. The term also refers to the document that defines the device. It shall define the means of rescue used and how they are managed in the event of an accident the consequences of which go beyond the enclosure of the risk installation concerned. These arrangements cover the phases of alerting, alerting and intervention, as well as civil security exercises carried out periodically to ensure proper ownership of the system. The special intervention plan, designed and drafted by the public authorities, forms part of the departmental ORSEC scheme. It interfaces with the emergency plans drawn up by the manufacturers responsible for the risks concerned.
- h
atom3d-ppi
- huggingface.co
Updated Aug 26, 2024ShareFacebookTwitterEmailClick to copy linkLink copiedCiteVector Institute (2024). atom3d-ppi [Dataset]. https://huggingface.co/datasets/vector-institute/atom3d-ppiCroissantCroissant is a format for machine-learning datasets. Learn more about this at mlcommons.org/croissant.Dataset updatedAug 26, 2024Dataset authored and provided byVector InstituteDescriptionPPI: Protein-Protein Interfaces
OverviewThis task relates to predicting which pairs of amino acids, spanning two different proteins, will interact upon binding (when they form a complex). Amino acids are defined as interacting if any of their heavy atoms are within 6 Angstroms from one another.
Datasetssplits: DIPS-split: DIPS dataset, split by sequence identity (see add. inf.)
FormatEach entry in the dataset contains the following keys:… See the full description on the dataset page: https://huggingface.co/datasets/vector-institute/atom3d-ppi.
Vietnam PPI: Industrial: Mfg: Other Transport Means
- ceicdata.com
ShareFacebookTwitterEmailClick to copy linkLink copiedCiteCEICdata.com, Vietnam PPI: Industrial: Mfg: Other Transport Means [Dataset]. https://www.ceicdata.com/en/vietnam/producer-price-index-2010100/ppi-industrial-mfg-other-transport-meansDataset provided byCEIC DataLicenseAttribution 4.0 (CC BY 4.0)https://creativecommons.org/licenses/by/4.0/
License information was derived automaticallyTime period coveredDec 1, 2011 - Dec 1, 2016Area coveredVietnamVariables measuredProducer PricesDescriptionVietnam PPI: Industrial: Mfg: Other Transport Means data was reported at 120.400 2010=100 in 2017. This records an increase from the previous number of 120.090 2010=100 for 2016. Vietnam PPI: Industrial: Mfg: Other Transport Means data is updated yearly, averaging 119.120 2010=100 from Dec 2011 (Median) to 2017, with 7 observations. The data reached an all-time high of 120.650 2010=100 in 2015 and a record low of 103.320 2010=100 in 2011. Vietnam PPI: Industrial: Mfg: Other Transport Means data remains active status in CEIC and is reported by General Statistics Office. The data is categorized under Global Database’s Vietnam – Table VN.I032: Producer Price Index: 2010=100 .
Producer price index for fish, fish products and seafood in Germany...
- statista.com
Updated Jul 10, 2025ShareFacebookTwitterEmailClick to copy linkLink copiedCiteStatista (2025). Producer price index for fish, fish products and seafood in Germany 1995-2024 [Dataset]. https://www.statista.com/statistics/1368047/fish-fish-products-and-seafood-producer-price-index-germany/Dataset updatedJul 10, 2025Area coveredGermanyDescriptionIn 2024, the producer price index for fish products and other seafood in Germany was *****. This means that prices had increased by around ** percent compared to the base year of 2021.The producer price or producer price index (PPI) lists the change in prices that producers receive for what they produce. The PPI is also indicative of inflation in the country at the wholesale level.
- c
Producer Price Index (PPI); output and importprices, 2015=100, 2012-2023
- cbs.nl
- data.overheid.nl
xmlUpdated Jan 30, 2025+ more versionsShareFacebookTwitterEmailClick to copy linkLink copiedCiteCentraal Bureau voor de Statistiek (2025). Producer Price Index (PPI); output and importprices, 2015=100, 2012-2023 [Dataset]. https://www.cbs.nl/en-gb/figures/detail/83935ENGxmlAvailable download formatsDataset updatedJan 30, 2025Dataset authored and provided byCentraal Bureau voor de StatistiekLicenseAttribution 4.0 (CC BY 4.0)https://creativecommons.org/licenses/by/4.0/
License information was derived automaticallyArea coveredThe NetherlandsDescriptionThis table contains figures on the average price development of the selling prices, the import prices and the domestic consumption of industrial products with a base year of 2015=100. This data is available for both domestic and foreign sales. The products are classified based on the goods classification PRODCOM (PRODuction COMmunautaire).
Data available from January 2012 up to and including December 2023.
Status of the figures: The data for August 2023 up to and including December 2023 and the 2023 annual rate are provisional. Since this table has been stopped, the data is no longer made definitive.
Changes as of March 6th 2024 None, this table is stopped.
When will new figures be published? The results in this series are based on 2015=100. Due to the base shift this table is stopped. Figures based on 2021=100 are published in table Producer Price Index (PPI), output and importprices by product, 2021=100. Further information, see Base Year Revision Industrial Producer Price Index, 2021=100 in paragraph 3.
Summary of DSD improvements of all four methods in 2-fold cross validation...
- plos.figshare.com
xlsUpdated Jun 3, 2023ShareFacebookTwitterEmailClick to copy linkLink copiedCiteMengfei Cao; Hao Zhang; Jisoo Park; Noah M. Daniels; Mark E. Crovella; Lenore J. Cowen; Benjamin Hescott (2023). Summary of DSD improvements of all four methods in 2-fold cross validation (mean and standard deviation in percentage) for the PPI network of S. cerevisiae. [Dataset]. http://doi.org/10.1371/journal.pone.0076339.t001xlsAvailable download formatsUnique identifierhttps://doi.org/10.1371/journal.pone.0076339.t001Dataset updatedJun 3, 2023AuthorsMengfei Cao; Hao Zhang; Jisoo Park; Noah M. Daniels; Mark E. Crovella; Lenore J. Cowen; Benjamin HescottLicenseAttribution 4.0 (CC BY 4.0)https://creativecommons.org/licenses/by/4.0/
License information was derived automaticallyDescriptionSummary of DSD improvements of all four methods in 2-fold cross validation (mean and standard deviation in percentage) for the PPI network of S. cerevisiae.
Fitting results for scale-free model, and Clustering Coefficient and Mean...
- plos.figshare.com
xlsUpdated Jun 1, 2023ShareFacebookTwitterEmailClick to copy linkLink copiedCiteAntonio M. Rezende; Edson L. Folador; Daniela de M. Resende; Jeronimo C. Ruiz (2023). Fitting results for scale-free model, and Clustering Coefficient and Mean Shortest Path for PPIs compared against the same measure extracted from 1000 Random PPIs. [Dataset]. http://doi.org/10.1371/journal.pone.0051304.t003xlsAvailable download formatsUnique identifierhttps://doi.org/10.1371/journal.pone.0051304.t003Dataset updatedJun 1, 2023AuthorsAntonio M. Rezende; Edson L. Folador; Daniela de M. Resende; Jeronimo C. RuizLicenseAttribution 4.0 (CC BY 4.0)https://creativecommons.org/licenses/by/4.0/
License information was derived automaticallyDescriptionFitting results for scale-free model, and Clustering Coefficient and Mean Shortest Path for PPIs compared against the same measure extracted from 1000 Random PPIs.
- F
Producer Price Index by Commodity: Final Demand
- fred.stlouisfed.org
jsonUpdated Jun 12, 2025+ more versionsShareFacebookTwitterEmailClick to copy linkLink copiedCite(2025). Producer Price Index by Commodity: Final Demand [Dataset]. https://fred.stlouisfed.org/series/PPIFISjsonAvailable download formatsDataset updatedJun 12, 2025Licensehttps://fred.stlouisfed.org/legal/#copyright-public-domainhttps://fred.stlouisfed.org/legal/#copyright-public-domain
DescriptionGraph and download economic data for Producer Price Index by Commodity: Final Demand (PPIFIS) from Nov 2009 to May 2025 about final demand, headline figure, PPI, inflation, price index, indexes, price, and USA.
Civil engineering and architectural services PPI in Japan 2010-2015
- statista.com
Updated Nov 25, 2016ShareFacebookTwitterEmailClick to copy linkLink copiedCiteStatista (2016). Civil engineering and architectural services PPI in Japan 2010-2015 [Dataset]. https://www.statista.com/statistics/706671/japan-producer-price-index-civil-engineering-and-architectural-services/Dataset updatedNov 25, 2016Time period covered2010 - 2015Area coveredJapanDescriptionThe statistic shows the producer price index (PPI) of civil engineering and architectural services in Japan from 2010 to 2015. The PPI of the Japanese civil engineering and architectural services industry was at 115.7 index points in 2015, which means an increase by 15.7 points compared to the base year 2010.
Romania PPI: NACE 1: EM: Mfg: Means of Road Transport
- ceicdata.com
- dr.ceicdata.com
Updated Jan 15, 2025+ more versionsShareFacebookTwitterEmailClick to copy linkLink copiedCiteCEICdata.com (2025). Romania PPI: NACE 1: EM: Mfg: Means of Road Transport [Dataset]. https://www.ceicdata.com/en/romania/producer-price-index-by-division-of-economic-activity-nace-1-2000100/ppi-nace-1-em-mfg-means-of-road-transportDataset updatedJan 15, 2025Dataset provided byCEIC DataLicenseAttribution 4.0 (CC BY 4.0)https://creativecommons.org/licenses/by/4.0/
License information was derived automaticallyTime period coveredJan 1, 2008 - Dec 1, 2008Area coveredRomaniaVariables measuredProducer PricesDescriptionRomania PPI: NACE 1: EM: Mfg: Means of Road Transport data was reported at 155.360 2000=100 in Dec 2008. This records an increase from the previous number of 153.400 2000=100 for Nov 2008. Romania PPI: NACE 1: EM: Mfg: Means of Road Transport data is updated monthly, averaging 142.635 2000=100 from Jan 2004 (Median) to Dec 2008, with 60 observations. The data reached an all-time high of 160.500 2000=100 in Oct 2004 and a record low of 124.990 2000=100 in Jul 2007. Romania PPI: NACE 1: EM: Mfg: Means of Road Transport data remains active status in CEIC and is reported by National Institute of Statistics. The data is categorized under Global Database’s Romania – Table RO.I027: Producer Price Index: by Division of Economic Activity: NACE 1: 2000=100.
- T
United States Producer Prices Final Demand Less Foods, Energy, and Trade...
- tradingeconomics.com
- zh.tradingeconomics.com
- +11more
csv, excel, json, xmlUpdated Jul 24, 2025+ more versionsShareFacebookTwitterEmailClick to copy linkLink copiedCiteTRADING ECONOMICS (2025). United States Producer Prices Final Demand Less Foods, Energy, and Trade Services MoM [Dataset]. https://tradingeconomics.com/united-states/ppi-ex-food-energy-and-trade-services-momexcel, csv, xml, jsonAvailable download formatsDataset updatedJul 24, 2025Dataset authored and provided byTRADING ECONOMICSLicenseAttribution 4.0 (CC BY 4.0)https://creativecommons.org/licenses/by/4.0/
License information was derived automaticallyTime period coveredSep 30, 2013 - Jun 30, 2025Area coveredUnited StatesDescriptionPPI Ex Food Energy and Trade Services MoM in the United States decreased to 0 percent in June from 0.10 percent in May of 2025. This dataset includes a chart with historical data for the United States Producer Prices Final Demand Less Foods, Energy, and Trade Services MoM.
Process Performance Indicators for IT Service Management: The PPI Dataset
- zenodo.org
zipUpdated Jan 23, 2023ShareFacebookTwitterEmailClick to copy linkLink copiedCiteBedilia Estrada; Adela del-Río-Ortega; Manuel Resinas; Antonio Ruiz-Cortés; Bedilia Estrada; Adela del-Río-Ortega; Manuel Resinas; Antonio Ruiz-Cortés (2023). Process Performance Indicators for IT Service Management: The PPI Dataset [Dataset]. http://doi.org/10.5281/zenodo.6021669zipAvailable download formatsUnique identifierhttps://doi.org/10.5281/zenodo.6021669Dataset updatedJan 23, 2023AuthorsBedilia Estrada; Adela del-Río-Ortega; Manuel Resinas; Antonio Ruiz-Cortés; Bedilia Estrada; Adela del-Río-Ortega; Manuel Resinas; Antonio Ruiz-CortésDescriptionSet of process performance indicators defined in natural language, related to the IT service management processes of several public organizations in Spain as published in Estrada-Torres, B., del-Río-Ortega, A., Resinas, M., & Ruiz-Cortés, A. (2021). Process Performance Indicators for IT Service Management: The PPI Dataset. In Research and Evidence in Software Engineering: From Empirical Studies to Open Source Artifacts (pp. 125-132). CRC Press. DOI: https://doi.org/10.1201/9781003168393-8
- N
NEMO Error Detection: PPI Connectivity analysis
- neurovault.org
niftiUpdated Mar 17, 2025+ more versionsShareFacebookTwitterEmailClick to copy linkLink copiedCite(2025). NEMO Error Detection: PPI Connectivity analysis [Dataset]. http://identifiers.org/neurovault.image:898341niftiAvailable download formatsUnique identifierhttps://identifiers.org/neurovault.image:898341Dataset updatedMar 17, 2025LicenseCC0 1.0 Universal Public Domain Dedicationhttps://creativecommons.org/publicdomain/zero/1.0/
License information was derived automaticallyDescriptionMean correlation with ACC seed for error > no-error connectivity analysis.
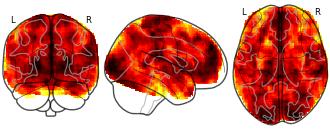
Collection description
This study examines error detection in life sciences students in a 100-level life sciences course.
Subject species
homo sapiens
Modality
fMRI-BOLD
Analysis level
group
Cognitive paradigm (task)
None / Other
Map type
Z
- N
Age-Related Differences in Ventral Striatal and Default Mode Network...
- neurovault.org
niftiUpdated Apr 28, 2022+ more versionsShareFacebookTwitterEmailClick to copy linkLink copiedCite(2022). Age-Related Differences in Ventral Striatal and Default Mode Network Function During Reciprocated Trust: Young-Old PPI-VMPFCface: Rec > Def thresh [Dataset]. http://identifiers.org/neurovault.image:512044niftiAvailable download formatsUnique identifierhttps://identifiers.org/neurovault.image:512044Dataset updatedApr 28, 2022LicenseCC0 1.0 Universal Public Domain Dedicationhttps://creativecommons.org/publicdomain/zero/1.0/
License information was derived automaticallyDescription6.0.4:ddd0a010
Collection description
Our social relationships change as we grow older. Despite the ubiquity of these changes, little is known about how they impact neural and behavioral responses to financial decisions involving other people. We examined this problem in the context of a trust game played with three partners varying in social closeness (friend, stranger, computer) while participants underwent fMRI. We found that, relative to younger adults, older adults demonstrated both blunted striatal activation and enhanced DMN-TPJ connectivity during experiences of reciprocated trust from friends relative to strangers and computers. These results suggest that older adults demonstrate altered neural representations of social closeness within financial exchanges involving trust, which may expose them to increased risk for financial exploitation perpetrated by strangers.
ADDITIONAL INFO AND NAMING CONVENTIONS: In this study, we tested two imaging-related pre-registered hypotheses, which are explained in our manuscript: H2.1: We expected enhanced reward-related responses within the striatum when experiencing reciprocity from a close friend relative to other partners; however, we expected this effect would be stronger in younger adults. H2.2: We expected age-related differences in striatal responses to reciprocity with different partners to be tied to increased connectivity between with the default-mode network (DMN). Images that are related to these hypotheses include "H2.1" or "H2.2" in the name, and images linked to specific figures in the paper include the figure number. Aside from one image that did not have suprathesholded results (id: 512030), all images include both a thresholded (with thresh at the end of the name) and unthresholded image. ABBREVIATIONS: Friend (F), Stranger (S), Computer (C), Reciprocate (Rec), Defect (Def), psychophysiological interaction analyses (PPI), network PPI (nPPI).
Subject species
homo sapiens
Modality
fMRI-BOLD
Analysis level
group
Cognitive paradigm (task)
social decision-making task
Map type
Z
FacebookTwitterAttribution 4.0 (CC BY 4.0)https://creativecommons.org/licenses/by/4.0/
License information was derived automatically
Belgium PPI: Manufacturing of Transport Means data was reported at 103.500 2000=100 in Dec 2009. This records a decrease from the previous number of 104.600 2000=100 for Nov 2009. Belgium PPI: Manufacturing of Transport Means data is updated monthly, averaging 100.600 2000=100 from Jan 2001 (Median) to Dec 2009, with 108 observations. The data reached an all-time high of 104.700 2000=100 in Nov 2008 and a record low of 98.400 2000=100 in Jul 2003. Belgium PPI: Manufacturing of Transport Means data remains active status in CEIC and is reported by National Bank of Belgium. The data is categorized under Global Database’s Belgium – Table BE.I023: Producer Price Index: 2000=100.